| Param | Original file | Final file |
|---|---|---|
| Filename | modeM0/AS1A14_126T15_9000006516_54357cztM0_level2.fits | modeM0/AS1A14_126T15_9000006516_54357cztM0_level2_quad_clean.evt |
| Size (bytes) | 720,768,960 | 82,304,640 |
| Size | 687.4 MB | 78.5 MB |
| Events in quadrant A | 3,398,275 | 648,073 |
| Events in quadrant B | 3,363,965 | 695,019 |
| Events in quadrant C | 5,671,755 | 528,833 |
| Events in quadrant D | 13,736,814 | 163,064 |
| Mode SS | |||
|---|---|---|---|
| Quadrant | BADHDUFLAG | Total packets | Discarded packets |
| A | 0 | 134 | 0 |
| B | 0 | 134 | 0 |
| C | 0 | 134 | 0 |
| D | 0 | 134 | 0 |
| Mode M0 | |||
|---|---|---|---|
| Quadrant | BADHDUFLAG | Total packets | Discarded packets |
| A | 0 | 14920 | 2 |
| B | 0 | 14806 | 2 |
| C | 0 | 21718 | 2 |
| D | 0 | 45279 | 2 |
| Mode M9 | |||
|---|---|---|---|
| Quadrant | BADHDUFLAG | Total packets | Discarded packets |
| A | 0 | 11 | 0 |
| B | 0 | 11 | 0 |
| C | 0 | 11 | 0 |
| D | 0 | 11 | 0 |
| Quadrant | Total seconds | Saturated seconds | Saturation percentage |
|---|---|---|---|
| A | 6551 | 123 | 1.877576% |
| B | 6551 | 149 | 2.274462% |
| C | 6551 | 1051 | 16.043352% |
| D | 6552 | 4962 | 75.732601% |
Noise dominated data is calculated using 1-second bins in cleaned event files. If a bin has >2000 counts, and if more than 50% of those come from <1% of pixels, then it is considered to be noise-dominated and hence unusable.
| Quadrant | # 1 sec bins | Bins with >0 counts | Bins with >2000 counts | High rate bins dominated by noise | Noise dominated (total time) | Noise dominated (detector-on time) | Marked lightcurve |
|---|---|---|---|---|---|---|---|
| A | 7651 | 6552 | 54 | 54 | 0.71% | 0.82% | 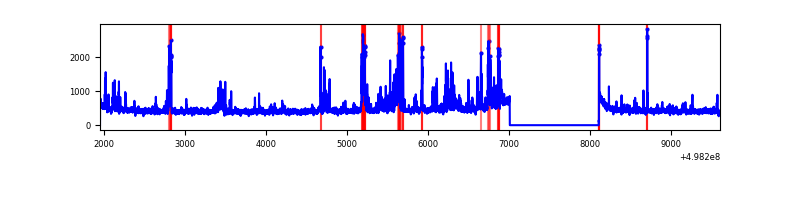 |
| B | 7651 | 6552 | 55 | 55 | 0.72% | 0.84% | 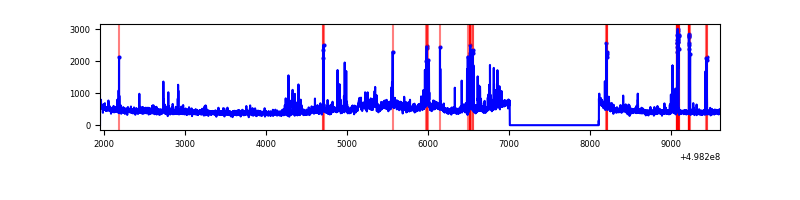 |
| C | 7651 | 6552 | 1048 | 1048 | 13.70% | 16.00% | 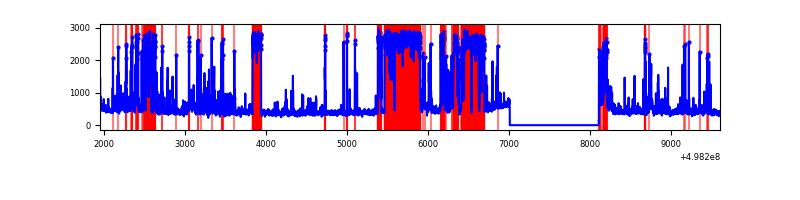 |
| D | 7652 | 6553 | 4250 | 4250 | 55.54% | 64.86% | 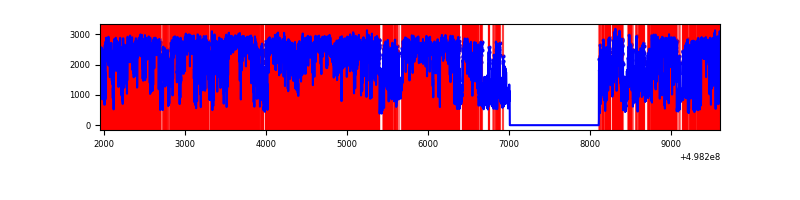 |
Top three noisy pixels from each quadrant. If the there are fewer than three noisy pixels in the level2.evt file, extra rows are filled as -1
| Pixel properties | Quadrant properties | ||||||
|---|---|---|---|---|---|---|---|
| Quadrant | DetID | PixID | Counts | Sigma | Mean | Median | Sigma |
| A | 7 | 206 | 444664 | 2561.79 | 703 | 686 | 173.3 |
| A | 7 | 14 | 72579 | 414.83 | 703 | 686 | 173.3 |
| A | 0 | 8 | 42677 | 242.29 | 703 | 686 | 173.3 |
| B | 7 | 0 | 209492 | 1417.33 | 692 | 668 | 147.3 |
| B | 10 | 247 | 143044 | 966.34 | 692 | 668 | 147.3 |
| B | 0 | 213 | 106116 | 715.7 | 692 | 668 | 147.3 |
| C | 1 | 241 | 2348670 | 13689.07 | 617 | 610 | 171.5 |
| C | 13 | 3 | 217803 | 1266.22 | 617 | 610 | 171.5 |
| C | 13 | 16 | 165293 | 960.09 | 617 | 610 | 171.5 |
| D | 8 | 176 | 11458869 | 115896.92 | 347 | 330 | 98.9 |
| D | 12 | 3 | 217123 | 2192.74 | 347 | 330 | 98.9 |
| D | 15 | 108 | 198076 | 2000.09 | 347 | 330 | 98.9 |
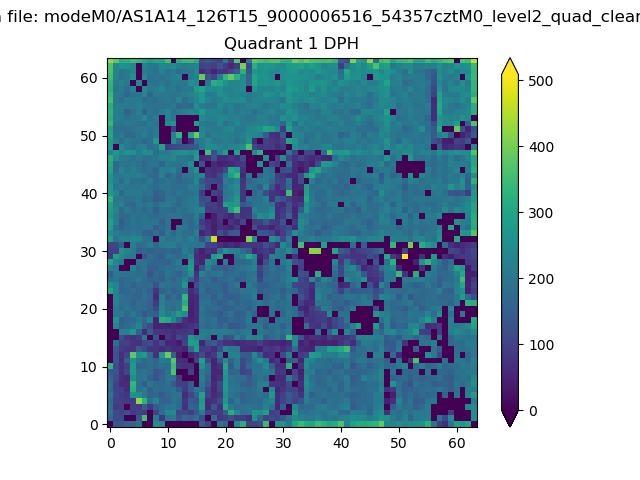
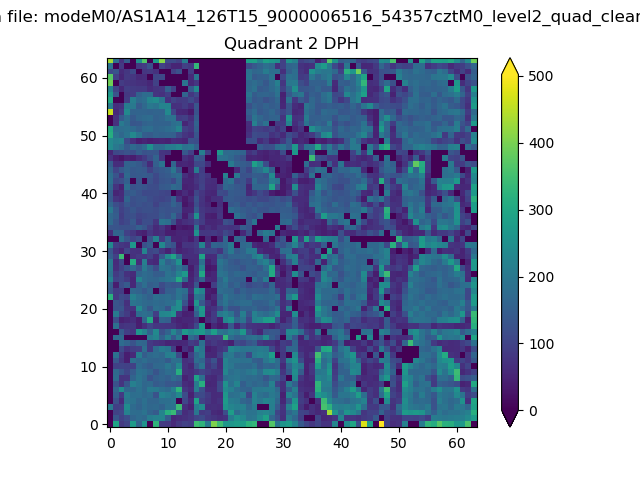
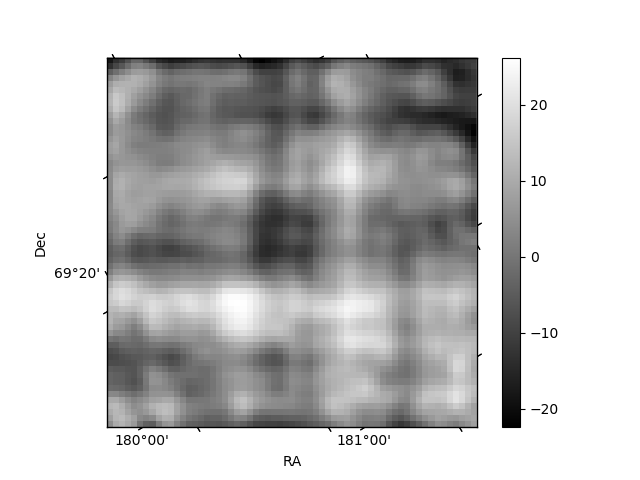
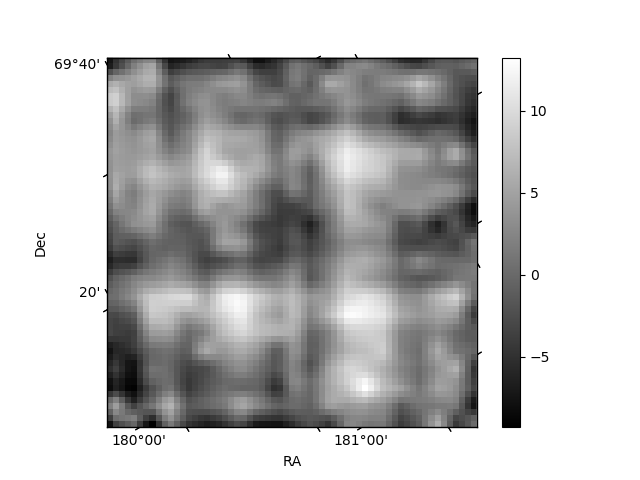
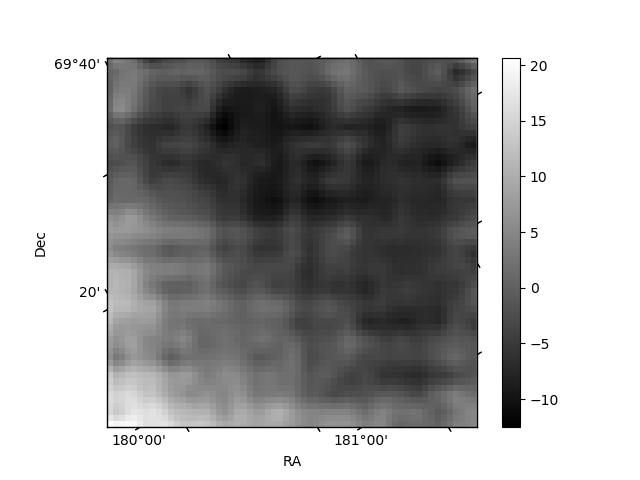
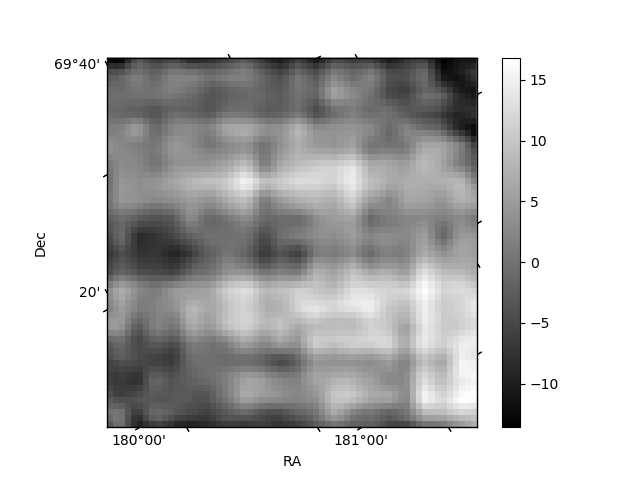
Histogram calculated using DETX and DETY for each event in the final _common_clean file
| Quadrant A |  |
 |
Quadrant B |
|---|---|---|---|
| Quadrant D | 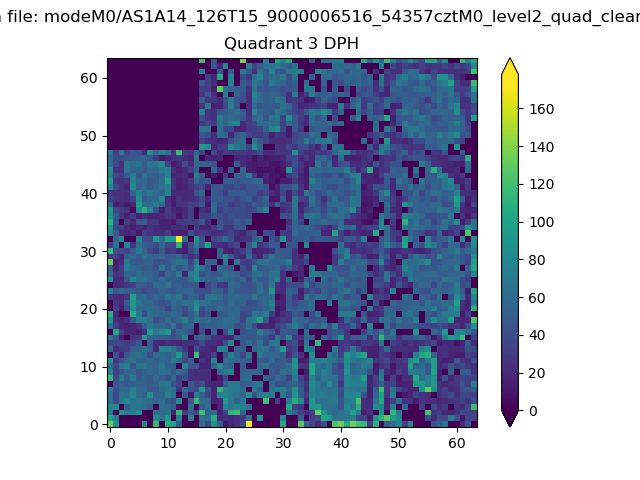 |
 |
Quadrant C |
| Plot type | Count rate plots | Images |
|---|---|---|
| Comparison with Poisson distribution Blue bars denote a histogram of data divided into 1 sec bins. Red curve is a Poisson curve with rate = median count rate of data. |
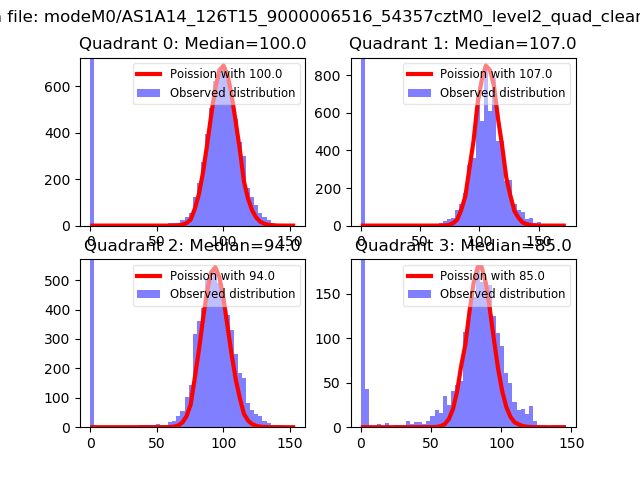 |
 |
| Quadrant-wise count rates Data is divided into 100 sec bins |
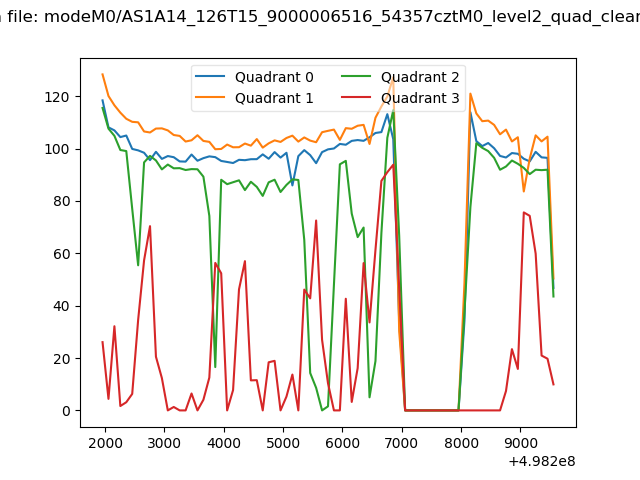 |
|
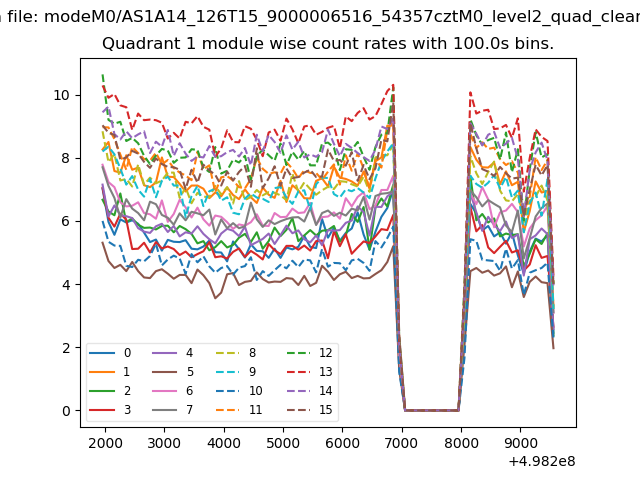
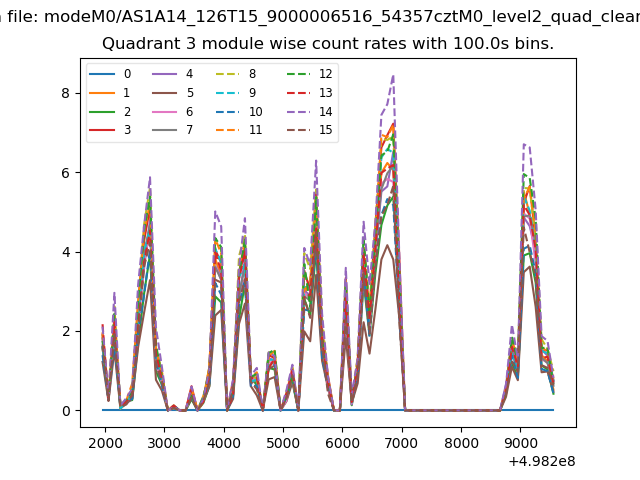
| Module-wise count rates for Quadrant A Data is divided into 100 sec bins |
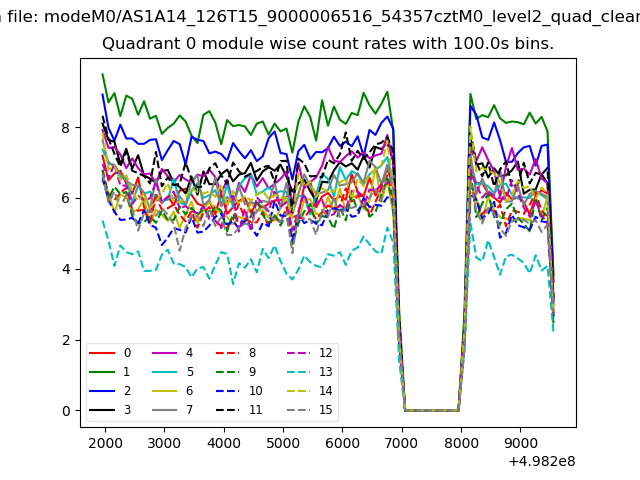 |
 |
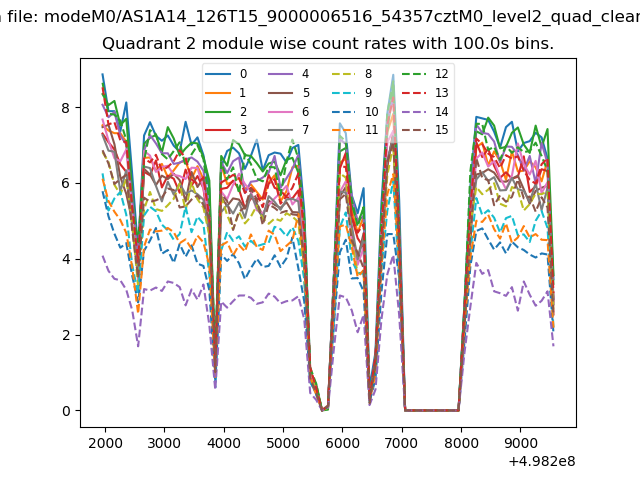
| Module-wise count rates for Quadrant B Data is divided into 100 sec bins |
 |
 |
| Module-wise count rates for Quadrant C Data is divided into 100 sec bins |
 |
 |
| Module-wise count rates for Quadrant D Data is divided into 100 sec bins |
 |
 |
| Parameter | Plot |
|---|---|
| CZT HV Monitor | 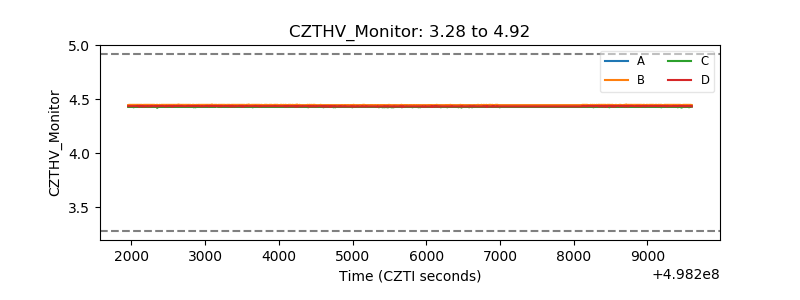 |
| D_VDD | 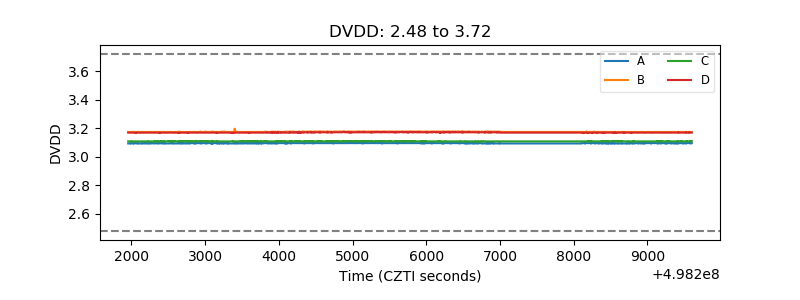 |
| Temperature 1 | 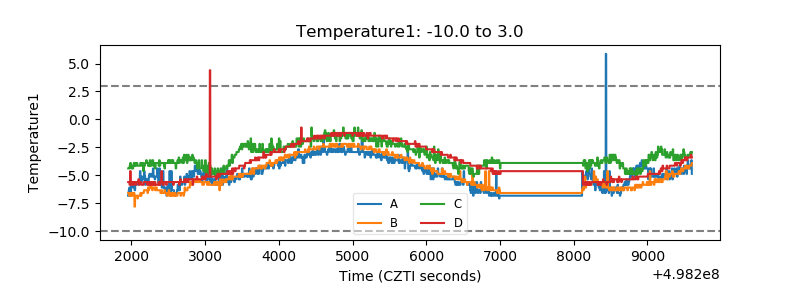 |
| Veto HV Monitor | 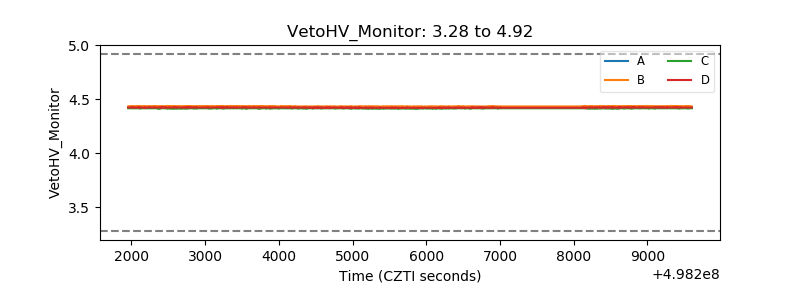 |
| Veto LLD | 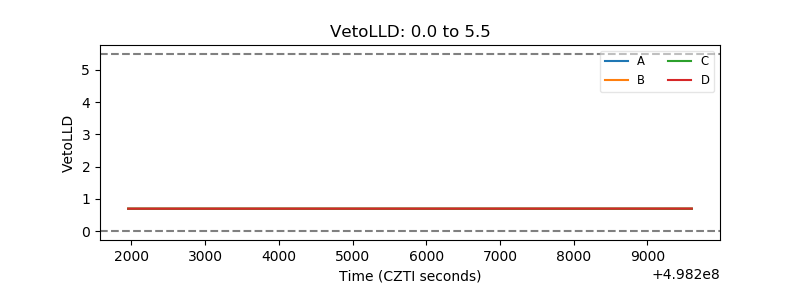 |
| Alpha Counter | 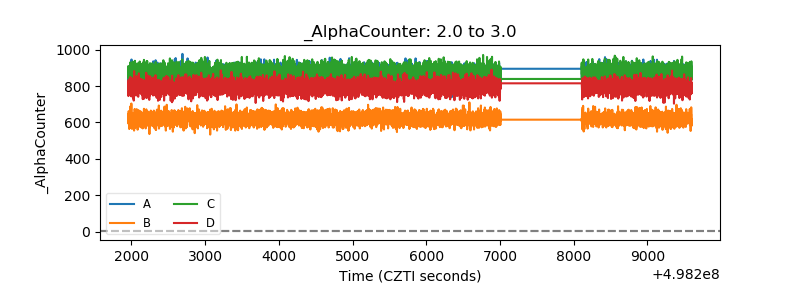 |
| _CPM_Rate | 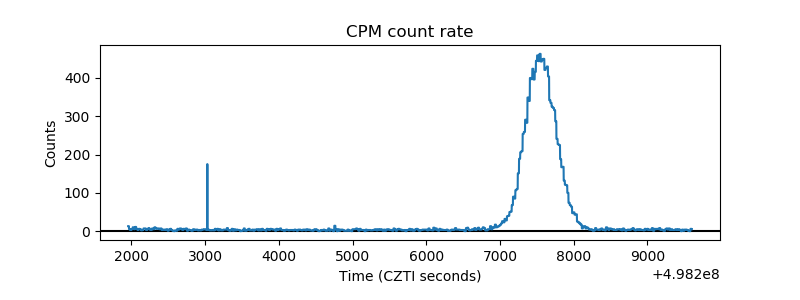 |
| CZT Counter | 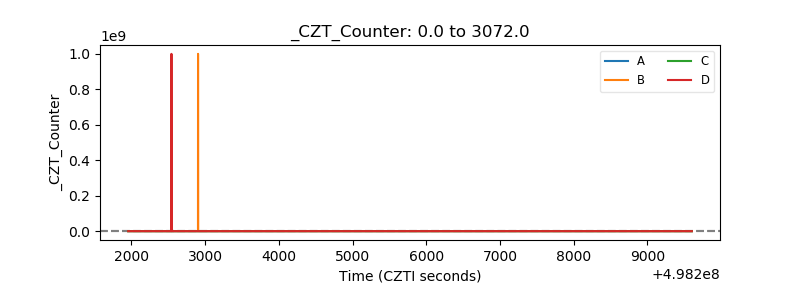 |
| +2.5 Volts monitor |  |
| +5 Volts monitor |  |
| _ROLL_ROT | 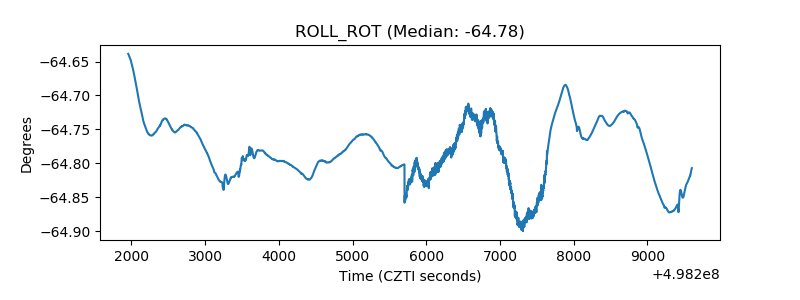 |
| _Roll_DEC | 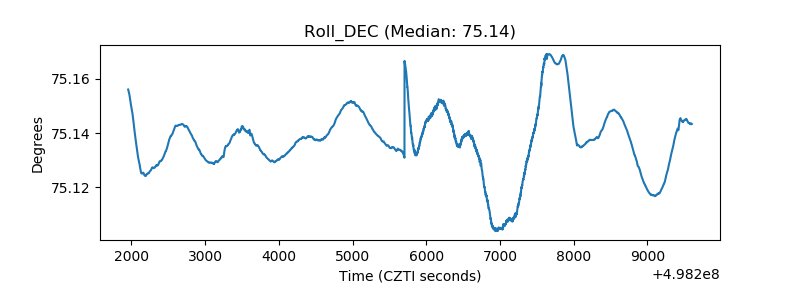 |
| _Roll_RA | 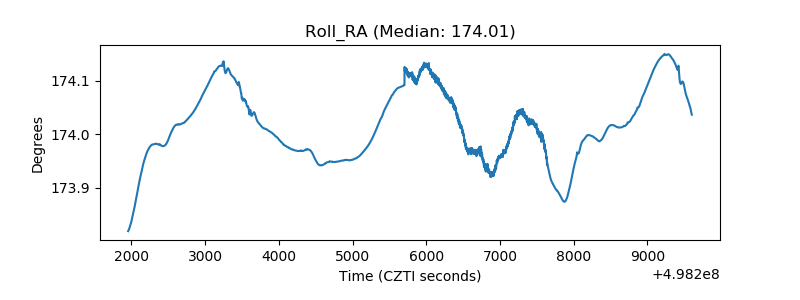 |
| Veto Counter | 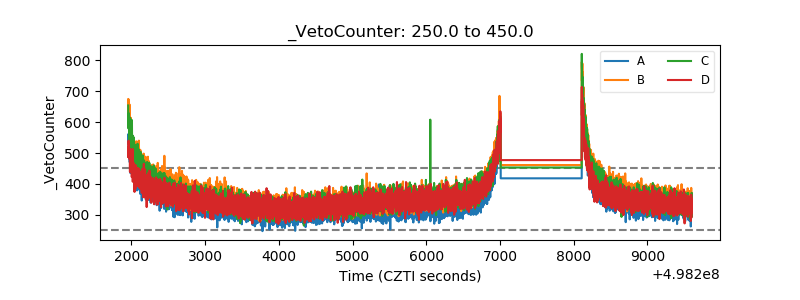 |