| Param | Original file | Final file |
|---|---|---|
| Filename | modeM0/AS1A14_126T15_9000006516_54358cztM0_level2.fits | modeM0/AS1A14_126T15_9000006516_54358cztM0_level2_quad_clean.evt |
| Size (bytes) | 668,548,800 | 83,030,400 |
| Size | 637.6 MB | 79.2 MB |
| Events in quadrant A | 3,021,939 | 640,856 |
| Events in quadrant B | 3,095,697 | 678,032 |
| Events in quadrant C | 4,879,328 | 567,456 |
| Events in quadrant D | 13,238,875 | 169,570 |
| Mode SS | |||
|---|---|---|---|
| Quadrant | BADHDUFLAG | Total packets | Discarded packets |
| A | 0 | 134 | 0 |
| B | 0 | 134 | 0 |
| C | 0 | 134 | 0 |
| D | 0 | 134 | 0 |
| Mode M0 | |||
|---|---|---|---|
| Quadrant | BADHDUFLAG | Total packets | Discarded packets |
| A | 0 | 13804 | 0 |
| B | 0 | 14173 | 0 |
| C | 0 | 19360 | 2 |
| D | 0 | 43848 | 0 |
| Mode M9 | |||
|---|---|---|---|
| Quadrant | BADHDUFLAG | Total packets | Discarded packets |
| A | 0 | 11 | 0 |
| B | 0 | 11 | 0 |
| C | 0 | 11 | 0 |
| D | 0 | 11 | 0 |
| Quadrant | Total seconds | Saturated seconds | Saturation percentage |
|---|---|---|---|
| A | 6571 | 71 | 1.080505% |
| B | 6572 | 153 | 2.328058% |
| C | 6571 | 532 | 8.096180% |
| D | 6571 | 4832 | 73.535231% |
Noise dominated data is calculated using 1-second bins in cleaned event files. If a bin has >2000 counts, and if more than 50% of those come from <1% of pixels, then it is considered to be noise-dominated and hence unusable.
| Quadrant | # 1 sec bins | Bins with >0 counts | Bins with >2000 counts | High rate bins dominated by noise | Noise dominated (total time) | Noise dominated (detector-on time) | Marked lightcurve |
|---|---|---|---|---|---|---|---|
| A | 7556 | 6573 | 5 | 5 | 0.07% | 0.08% | 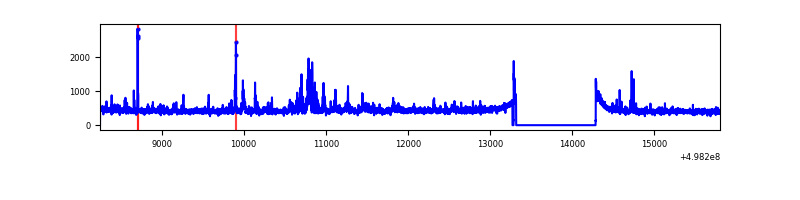 |
| B | 7557 | 6574 | 59 | 59 | 0.78% | 0.90% | 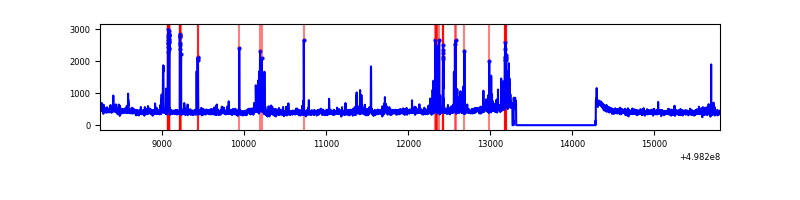 |
| C | 7556 | 6573 | 489 | 489 | 6.47% | 7.44% | 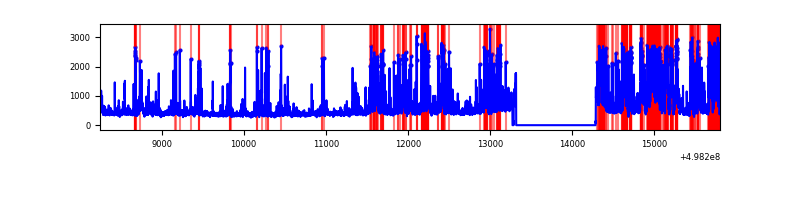 |
| D | 7556 | 6573 | 3891 | 3891 | 51.50% | 59.20% | 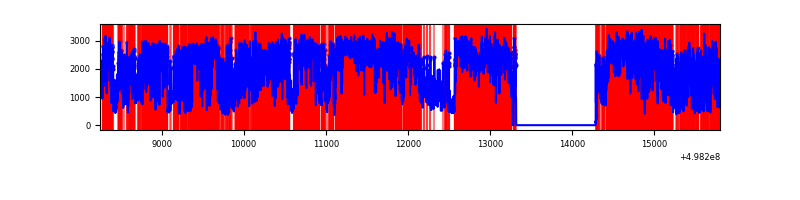 |
Top three noisy pixels from each quadrant. If the there are fewer than three noisy pixels in the level2.evt file, extra rows are filled as -1
| Pixel properties | Quadrant properties | ||||||
|---|---|---|---|---|---|---|---|
| Quadrant | DetID | PixID | Counts | Sigma | Mean | Median | Sigma |
| A | 7 | 206 | 210611 | 1219.5 | 699 | 682 | 172.1 |
| A | 4 | 78 | 14921 | 82.72 | 699 | 682 | 172.1 |
| A | 13 | 254 | 13367 | 73.69 | 699 | 682 | 172.1 |
| B | 0 | 213 | 152156 | 1043.74 | 682 | 658 | 145.1 |
| B | 10 | 247 | 87913 | 601.14 | 682 | 658 | 145.1 |
| B | 0 | 171 | 36171 | 244.67 | 682 | 658 | 145.1 |
| C | 1 | 29 | 916511 | 5159.57 | 644 | 637 | 177.5 |
| C | 14 | 254 | 366075 | 2058.69 | 644 | 637 | 177.5 |
| C | 2 | 255 | 309403 | 1739.43 | 644 | 637 | 177.5 |
| D | 8 | 176 | 10692758 | 113731.35 | 329 | 313 | 94.0 |
| D | 15 | 108 | 741010 | 7878.5 | 329 | 313 | 94.0 |
| D | 12 | 3 | 181822 | 1930.64 | 329 | 313 | 94.0 |
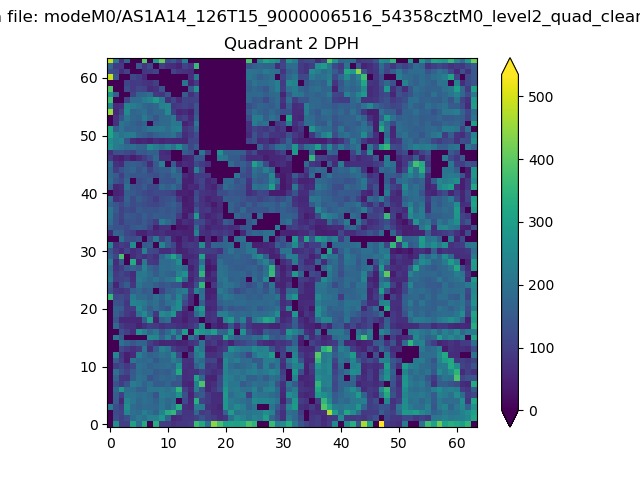
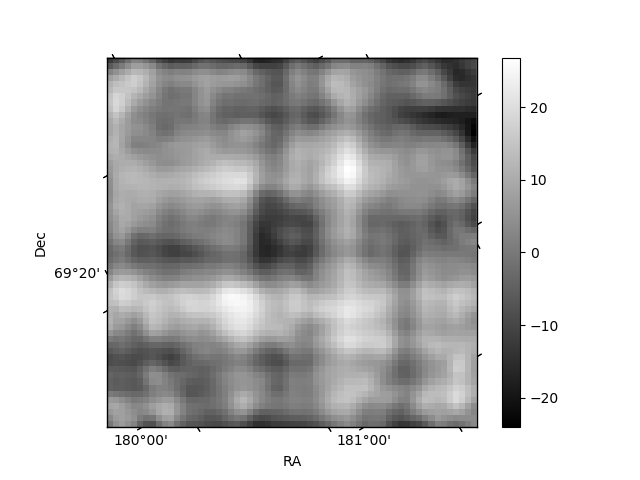
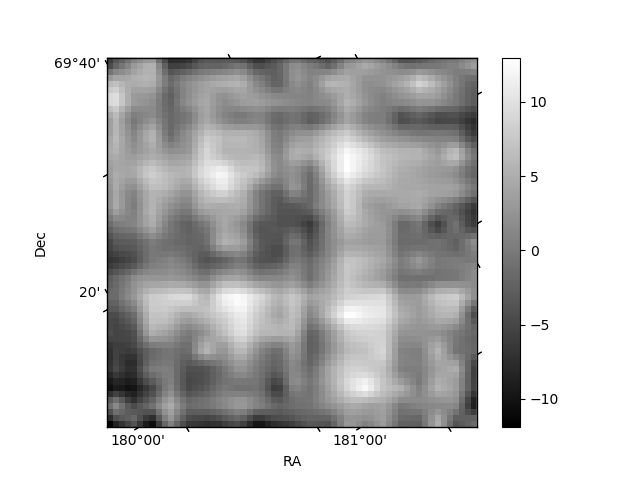
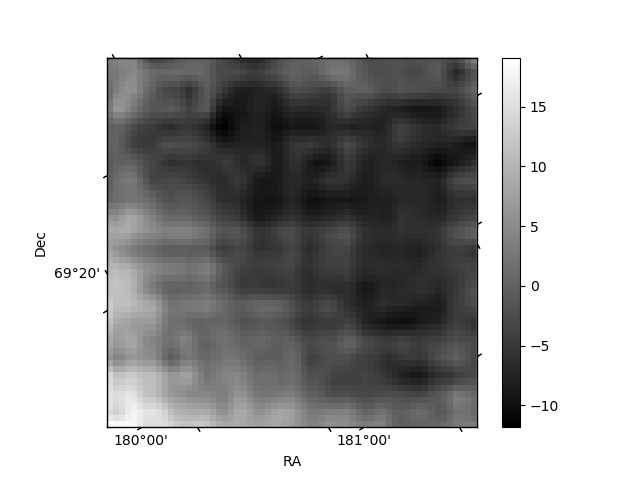
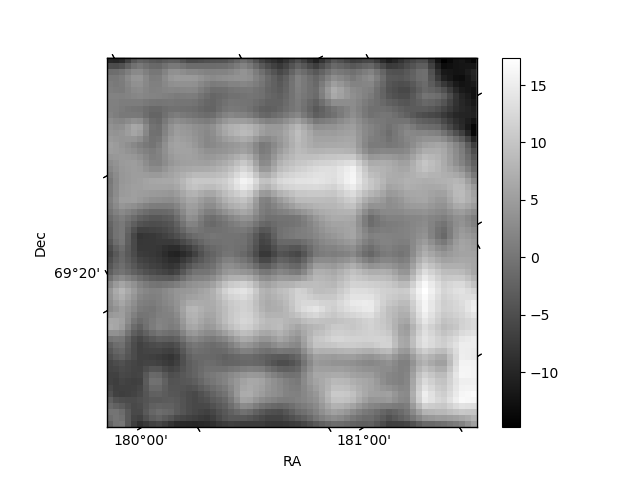
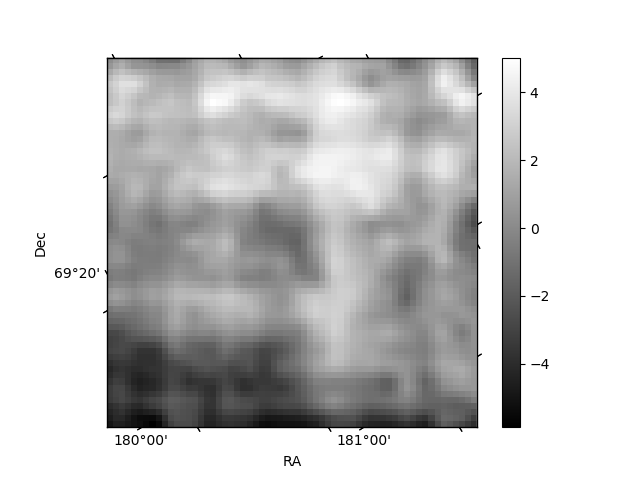
Histogram calculated using DETX and DETY for each event in the final _common_clean file
| Quadrant A | 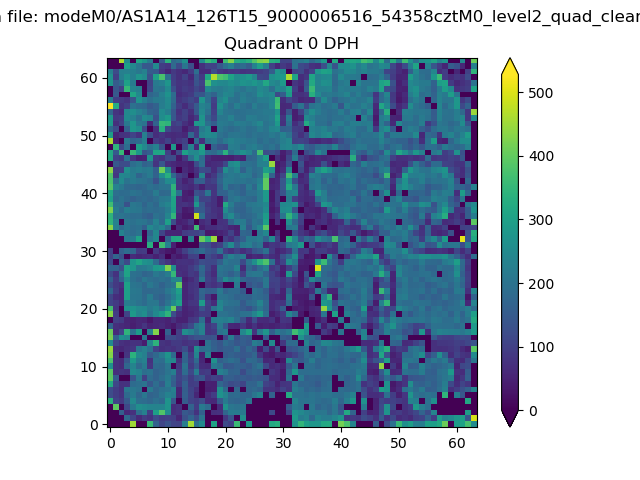 |
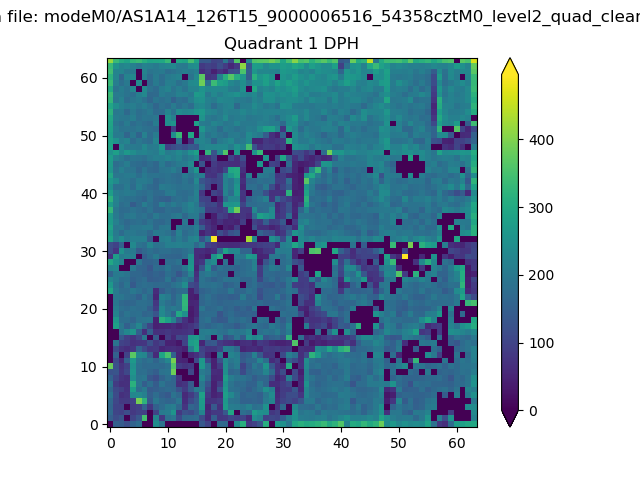 |
Quadrant B |
|---|---|---|---|
| Quadrant D | 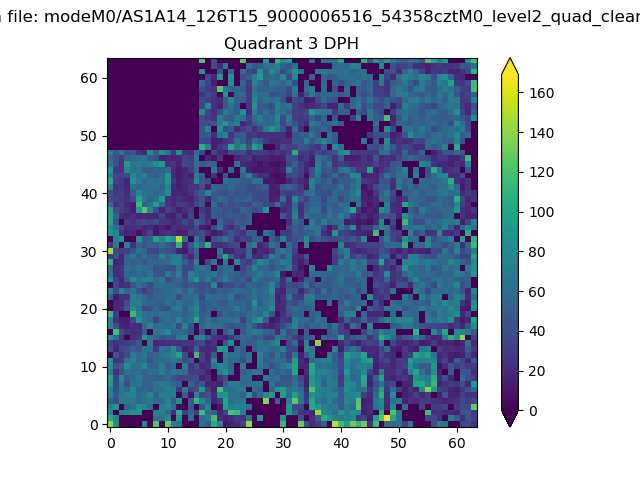 |
 |
Quadrant C |
| Plot type | Count rate plots | Images |
|---|---|---|
| Comparison with Poisson distribution Blue bars denote a histogram of data divided into 1 sec bins. Red curve is a Poisson curve with rate = median count rate of data. |
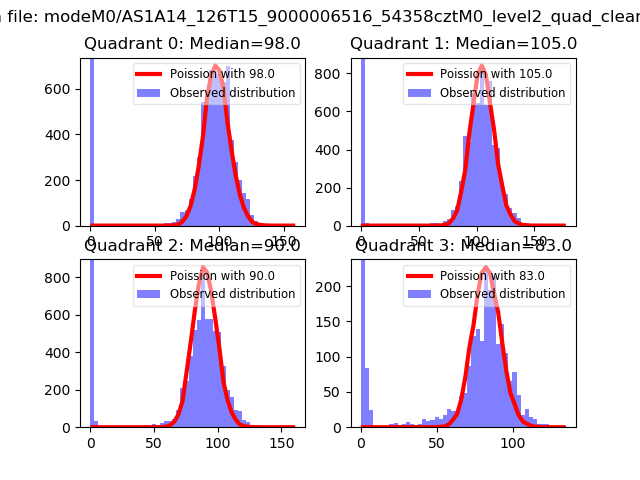 |
 |
| Quadrant-wise count rates Data is divided into 100 sec bins |
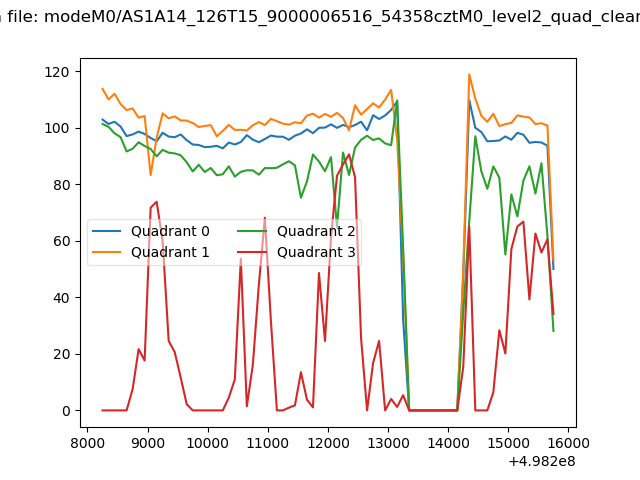 |
|
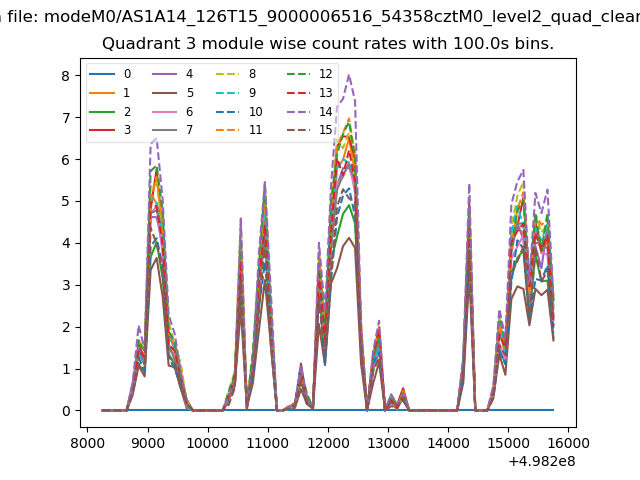
| Module-wise count rates for Quadrant A Data is divided into 100 sec bins |
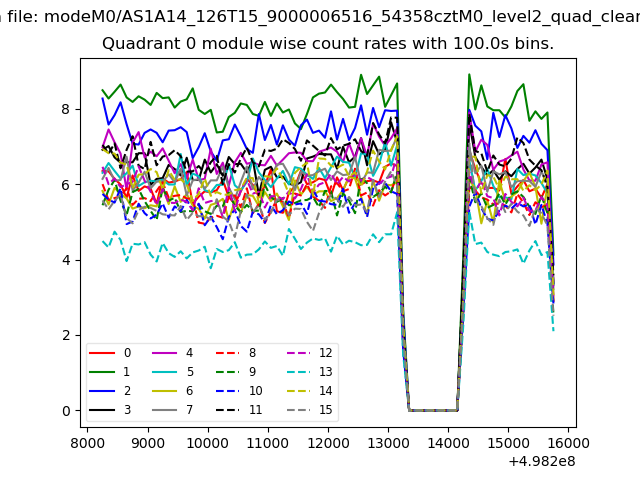 |
 |
| Module-wise count rates for Quadrant B Data is divided into 100 sec bins |
 |
 |
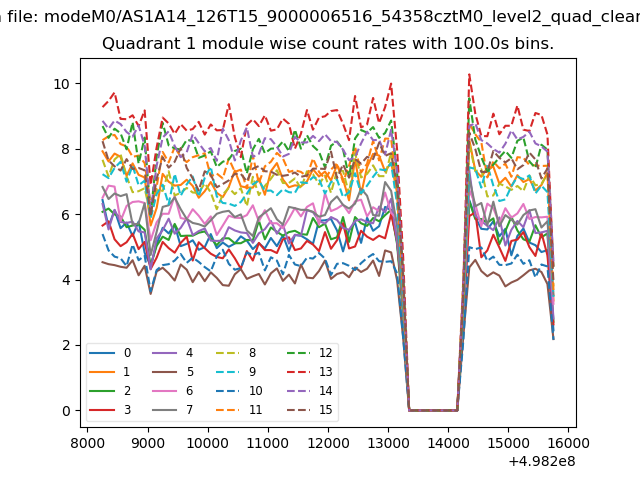
| Module-wise count rates for Quadrant C Data is divided into 100 sec bins |
 |
 |
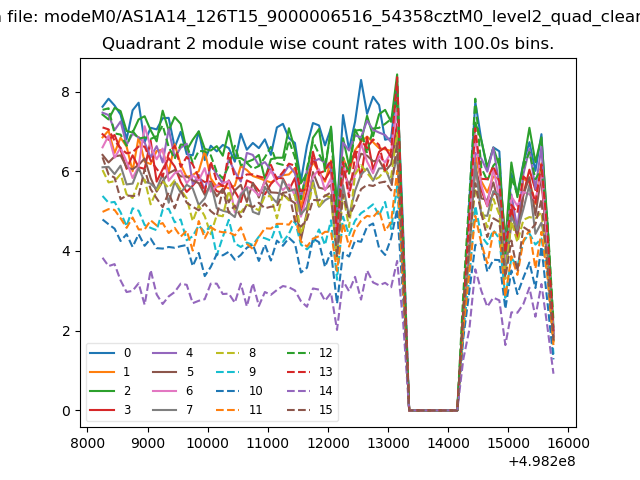
| Module-wise count rates for Quadrant D Data is divided into 100 sec bins |
 |
 |
| Parameter | Plot |
|---|---|
| CZT HV Monitor | 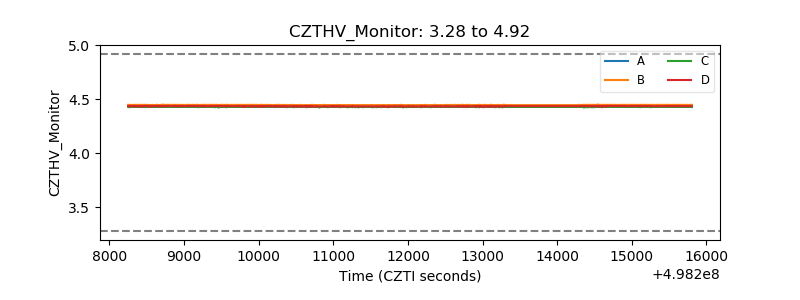 |
| D_VDD | 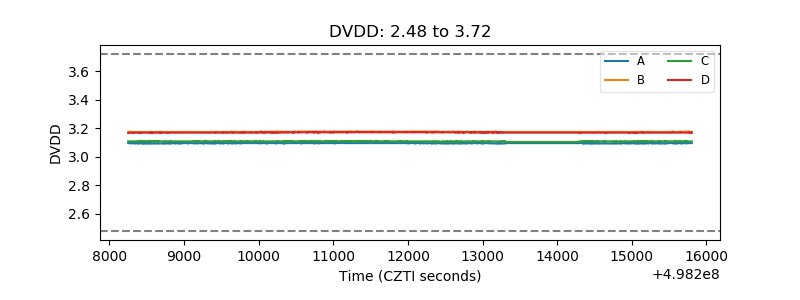 |
| Temperature 1 | 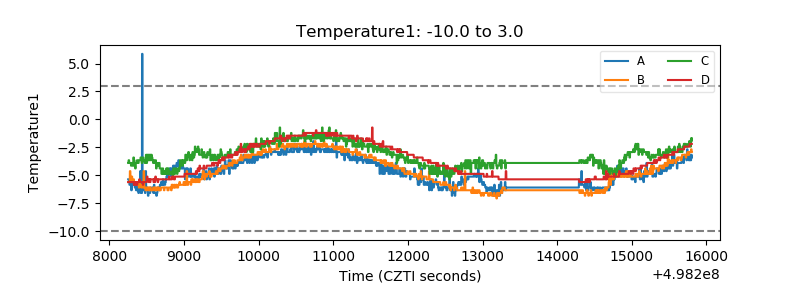 |
| Veto HV Monitor | 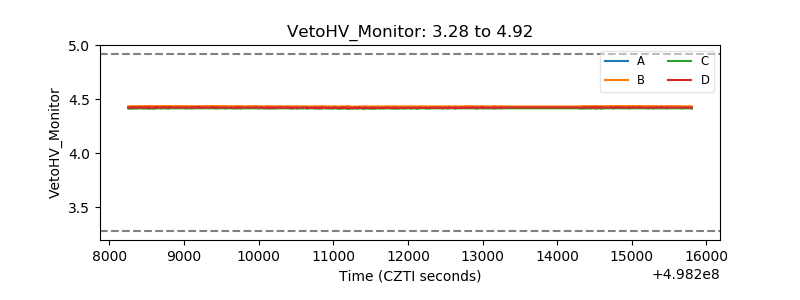 |
| Veto LLD | 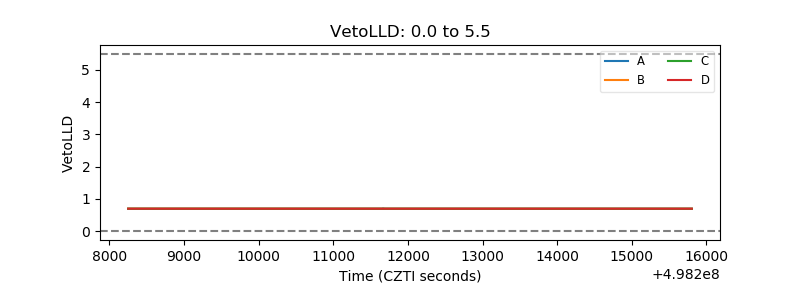 |
| Alpha Counter | 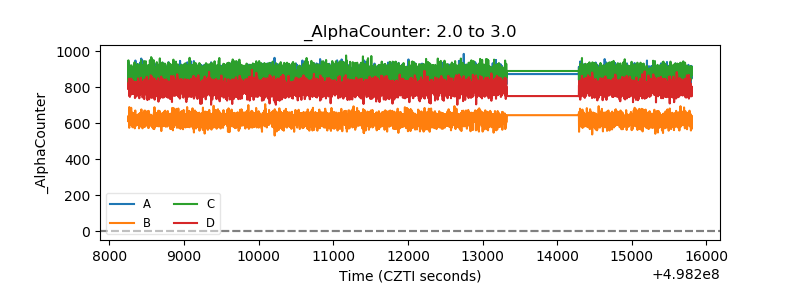 |
| _CPM_Rate | 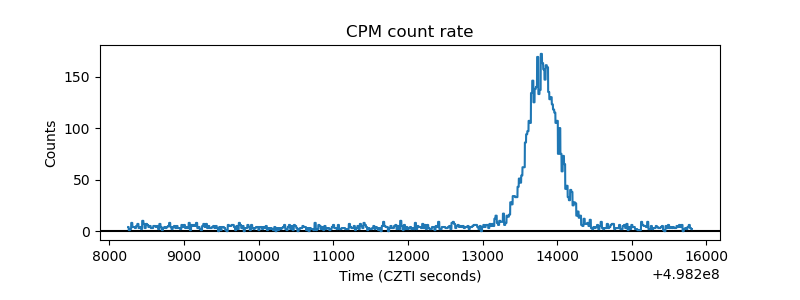 |
| CZT Counter | 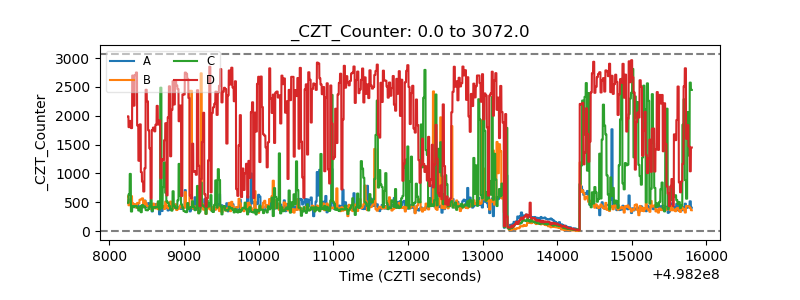 |
| +2.5 Volts monitor | 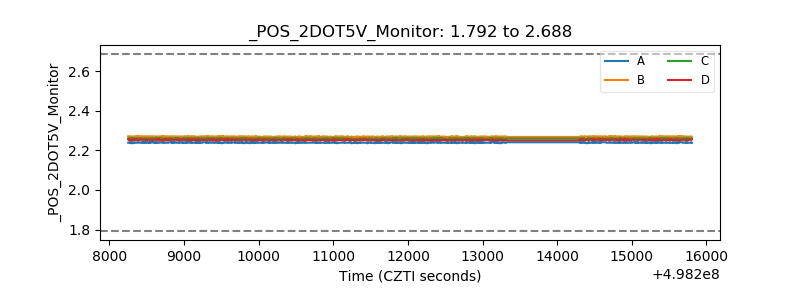 |
| +5 Volts monitor | 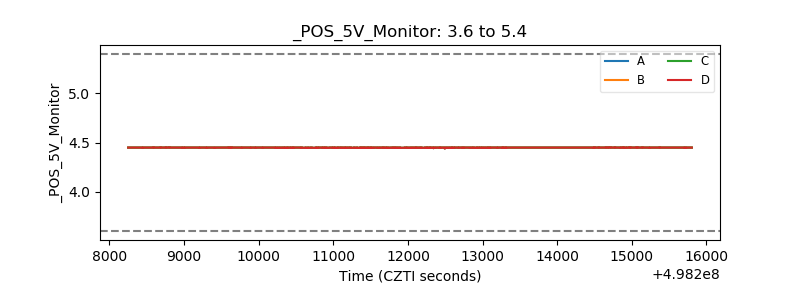 |
| _ROLL_ROT | 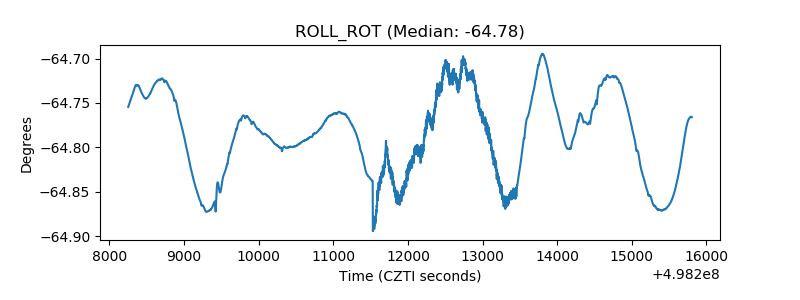 |
| _Roll_DEC | 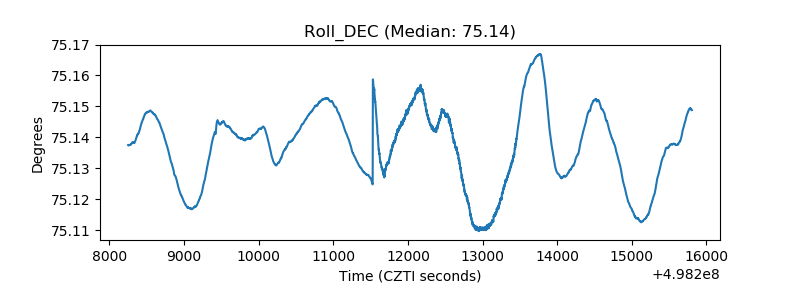 |
| _Roll_RA | 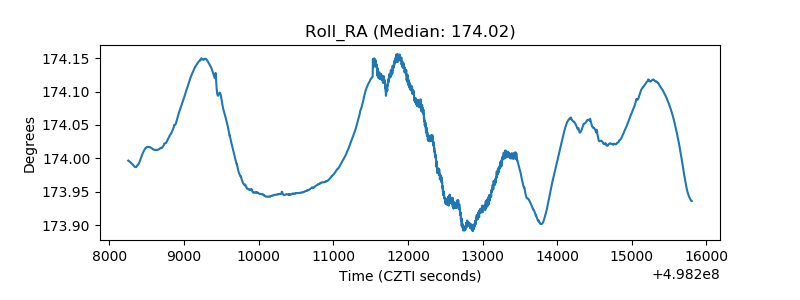 |
| Veto Counter | 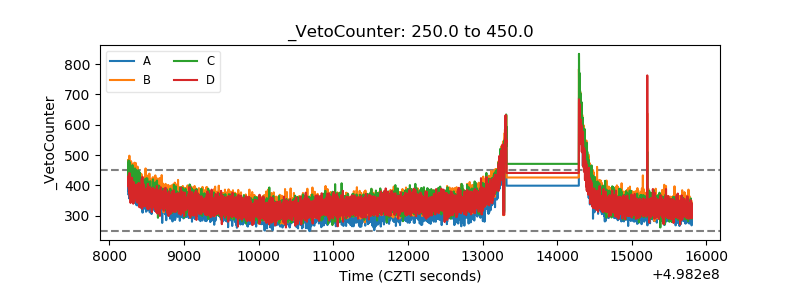 |