| Param | Original file | Final file |
|---|---|---|
| Filename | modeM0/AS1A14_126T15_9000006516_54360cztM0_level2.fits | modeM0/AS1A14_126T15_9000006516_54360cztM0_level2_quad_clean.evt |
| Size (bytes) | 878,935,680 | 83,321,280 |
| Size | 838.2 MB | 79.5 MB |
| Events in quadrant A | 3,684,338 | 688,019 |
| Events in quadrant B | 3,697,902 | 725,263 |
| Events in quadrant C | 7,582,300 | 545,393 |
| Events in quadrant D | 17,012,232 | 63,016 |
| Mode SS | |||
|---|---|---|---|
| Quadrant | BADHDUFLAG | Total packets | Discarded packets |
| A | 0 | 144 | 0 |
| B | 0 | 144 | 0 |
| C | 0 | 144 | 0 |
| D | 0 | 144 | 0 |
| Mode M0 | |||
|---|---|---|---|
| Quadrant | BADHDUFLAG | Total packets | Discarded packets |
| A | 0 | 16248 | 0 |
| B | 0 | 16176 | 0 |
| C | 0 | 27590 | 2 |
| D | 0 | 55444 | 0 |
| Quadrant | Total seconds | Saturated seconds | Saturation percentage |
|---|---|---|---|
| A | 7195 | 76 | 1.056289% |
| B | 7195 | 160 | 2.223767% |
| C | 7194 | 1296 | 18.015013% |
| D | 7194 | 6617 | 91.979427% |
Noise dominated data is calculated using 1-second bins in cleaned event files. If a bin has >2000 counts, and if more than 50% of those come from <1% of pixels, then it is considered to be noise-dominated and hence unusable.
| Quadrant | # 1 sec bins | Bins with >0 counts | Bins with >2000 counts | High rate bins dominated by noise | Noise dominated (total time) | Noise dominated (detector-on time) | Marked lightcurve |
|---|---|---|---|---|---|---|---|
| A | 7195 | 7195 | 23 | 23 | 0.32% | 0.32% | 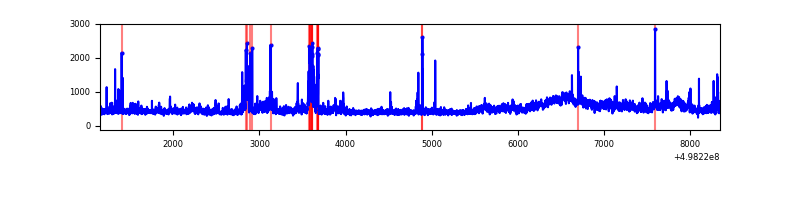 |
| B | 7195 | 7195 | 68 | 68 | 0.95% | 0.95% | 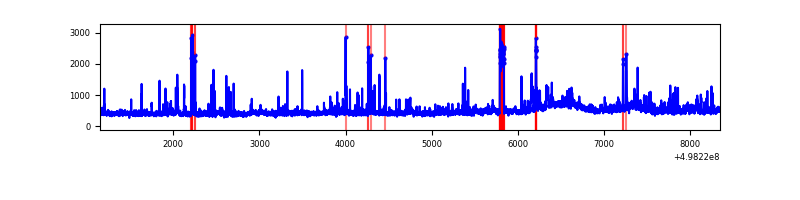 |
| C | 7194 | 7194 | 1223 | 1223 | 17.00% | 17.00% | 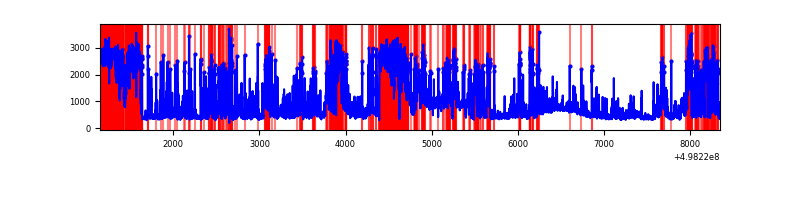 |
| D | 7194 | 7194 | 5512 | 5512 | 76.62% | 76.62% | 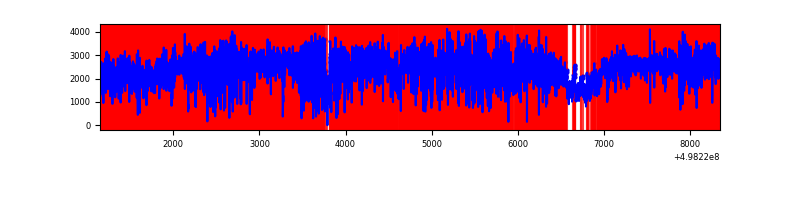 |
Top three noisy pixels from each quadrant. If the there are fewer than three noisy pixels in the level2.evt file, extra rows are filled as -1
| Pixel properties | Quadrant properties | ||||||
|---|---|---|---|---|---|---|---|
| Quadrant | DetID | PixID | Counts | Sigma | Mean | Median | Sigma |
| A | 4 | 78 | 307230 | 1621.54 | 773 | 754 | 189.0 |
| A | 15 | 174 | 187227 | 986.61 | 773 | 754 | 189.0 |
| A | 4 | 249 | 46595 | 242.54 | 773 | 754 | 189.0 |
| B | 0 | 213 | 258397 | 1597.83 | 754 | 726 | 161.3 |
| B | 5 | 172 | 126233 | 778.28 | 754 | 726 | 161.3 |
| B | 14 | 167 | 95059 | 584.96 | 754 | 726 | 161.3 |
| C | 1 | 241 | 1430362 | 7730.97 | 678 | 673 | 184.9 |
| C | 13 | 3 | 954249 | 5156.41 | 678 | 673 | 184.9 |
| C | 1 | 16 | 858662 | 4639.53 | 678 | 673 | 184.9 |
| D | 8 | 176 | 14669272 | 197076.88 | 257 | 245 | 74.4 |
| D | 15 | 108 | 1031935 | 13860.65 | 257 | 245 | 74.4 |
| D | 3 | 176 | 73103 | 978.84 | 257 | 245 | 74.4 |
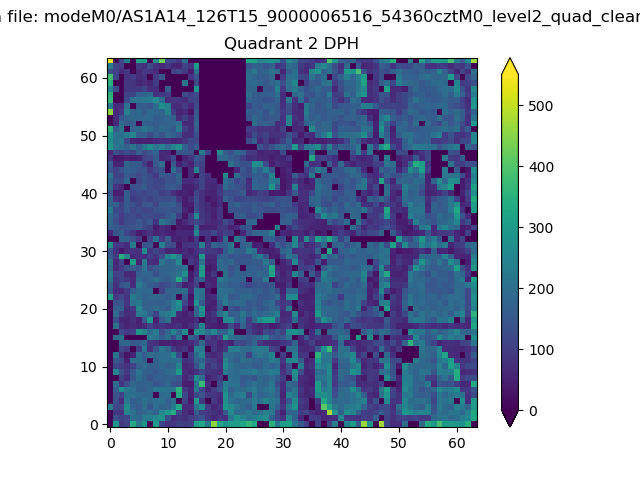
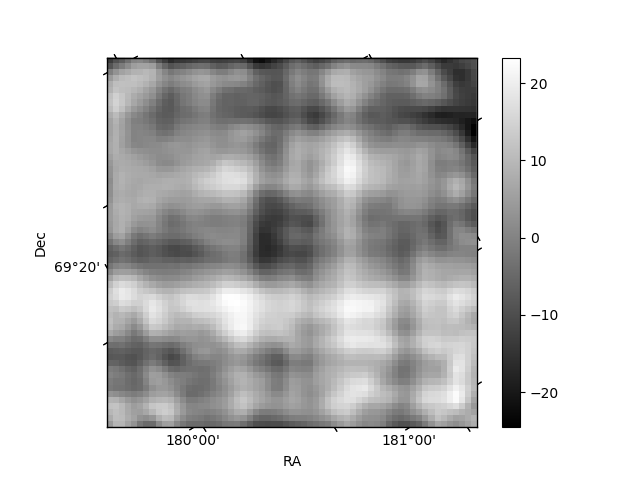
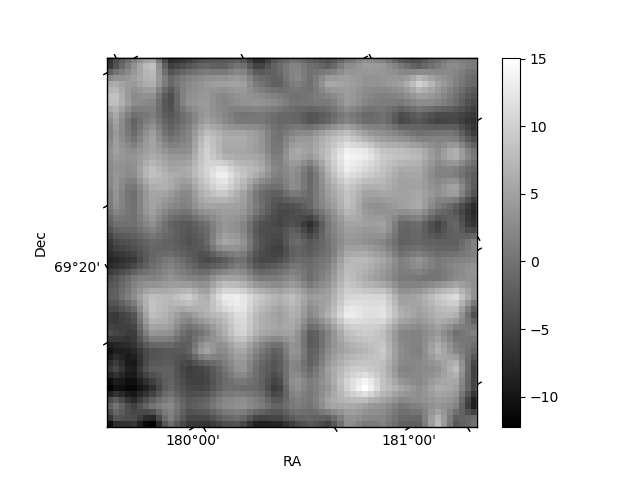
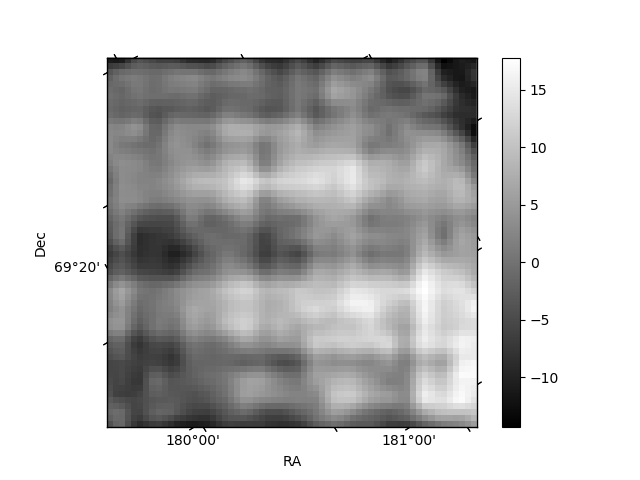
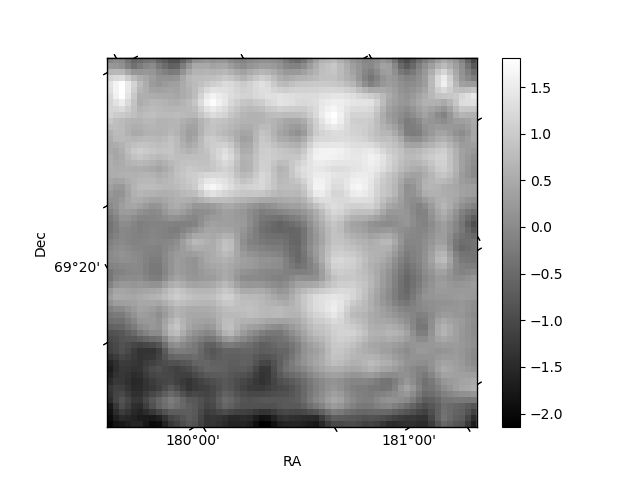
Histogram calculated using DETX and DETY for each event in the final _common_clean file
| Quadrant A | 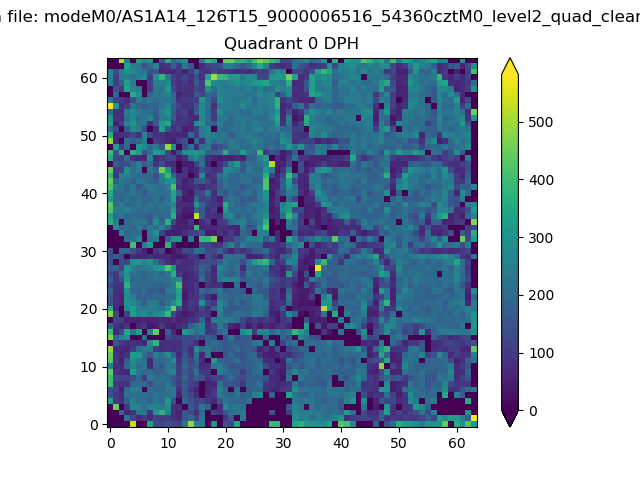 |
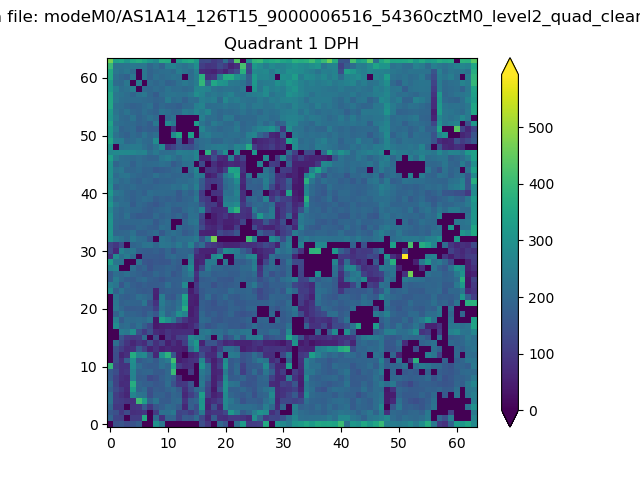 |
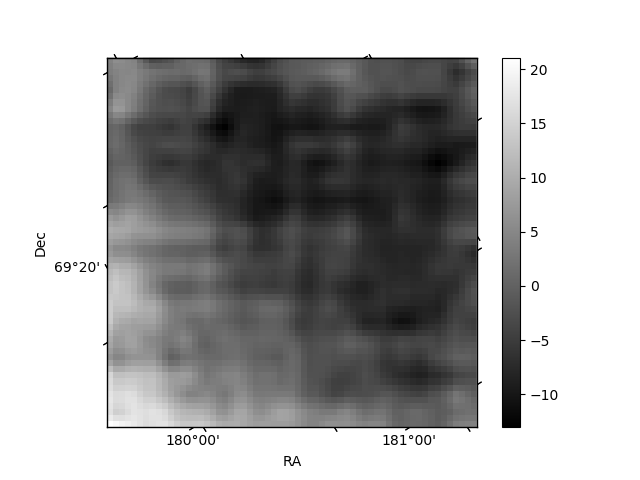
Quadrant B |
|---|---|---|---|
| Quadrant D | 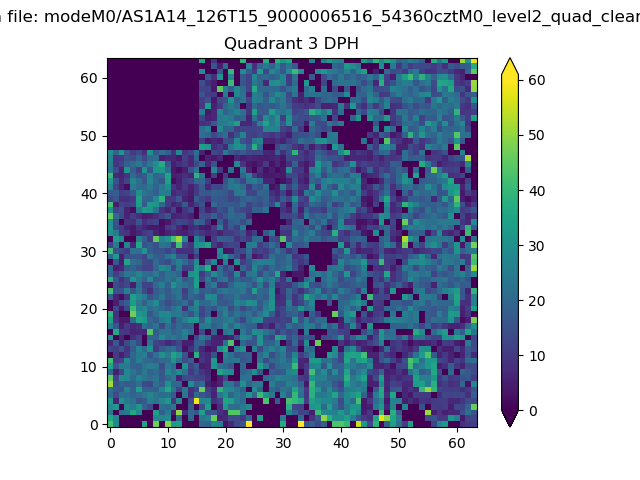 |
 |
Quadrant C |
| Plot type | Count rate plots | Images |
|---|---|---|
| Comparison with Poisson distribution Blue bars denote a histogram of data divided into 1 sec bins. Red curve is a Poisson curve with rate = median count rate of data. |
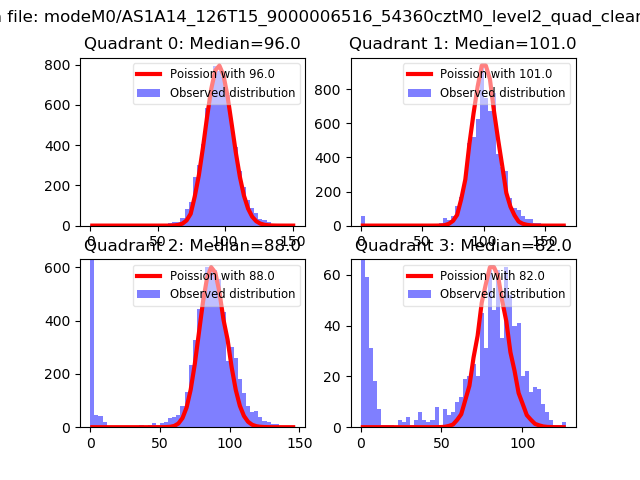 |
 |
| Quadrant-wise count rates Data is divided into 100 sec bins |
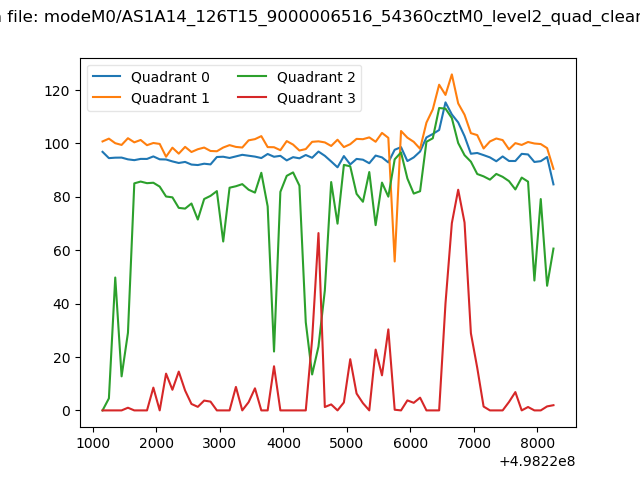 |
|
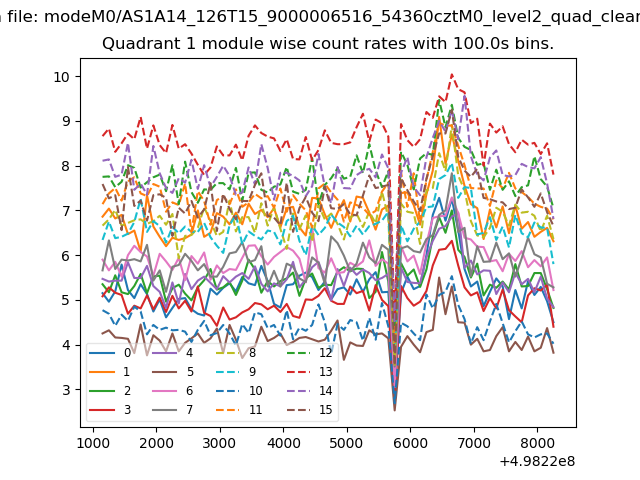
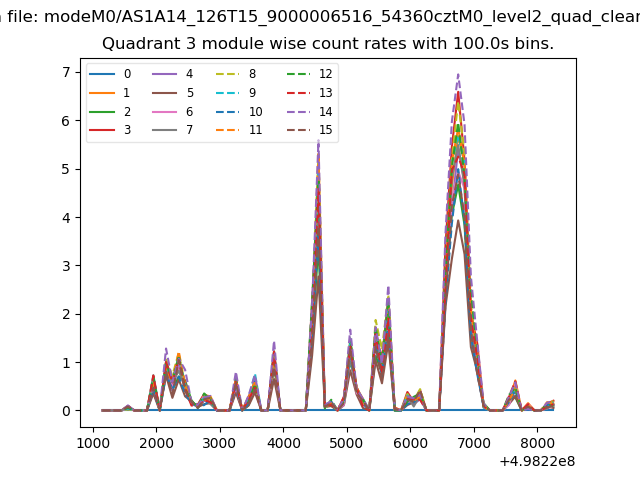
| Module-wise count rates for Quadrant A Data is divided into 100 sec bins |
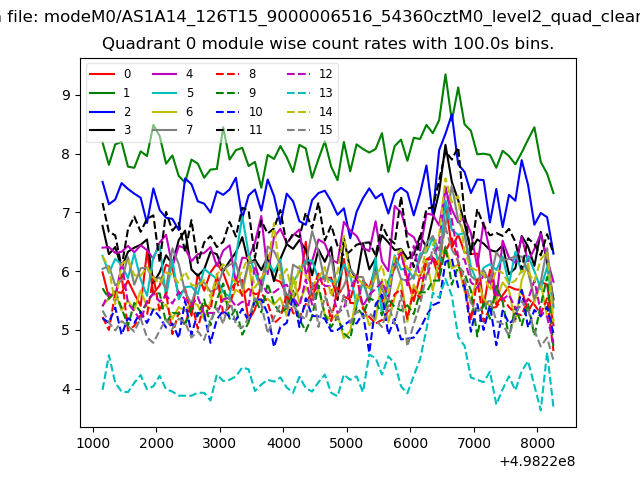 |
 |
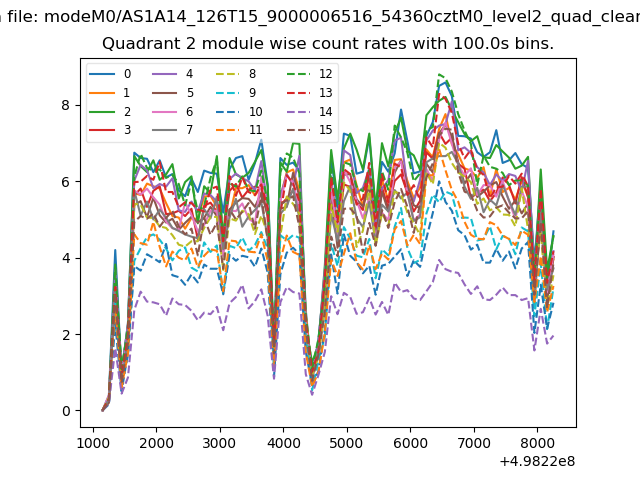
| Module-wise count rates for Quadrant B Data is divided into 100 sec bins |
 |
 |
| Module-wise count rates for Quadrant C Data is divided into 100 sec bins |
 |
 |
| Module-wise count rates for Quadrant D Data is divided into 100 sec bins |
 |
 |
| Parameter | Plot |
|---|---|
| CZT HV Monitor | 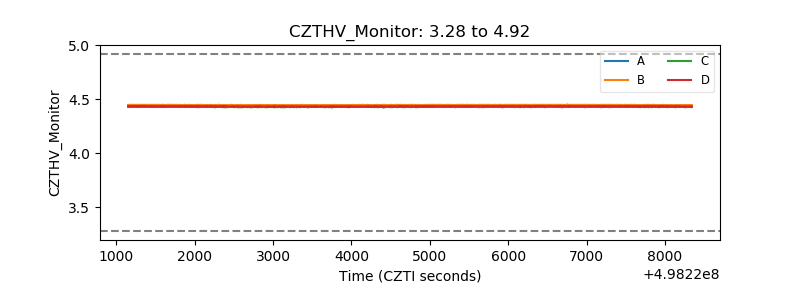 |
| D_VDD | 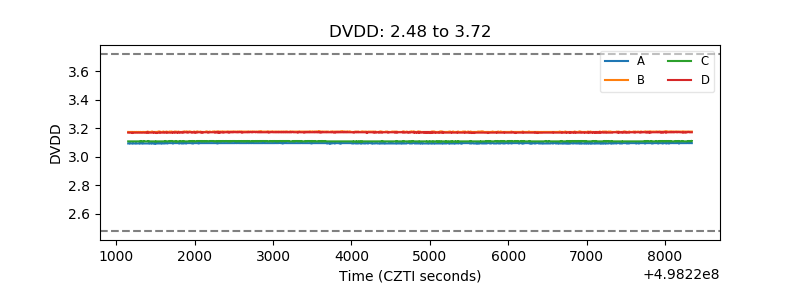 |
| Temperature 1 | 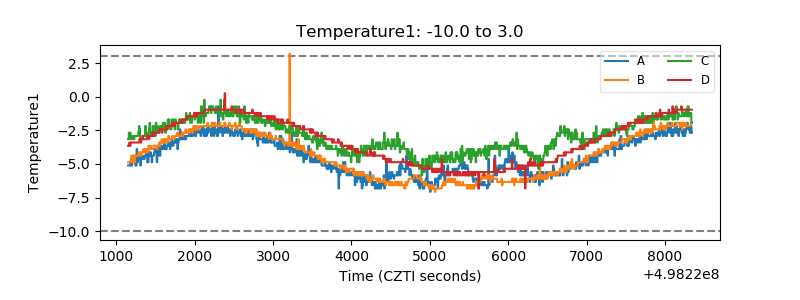 |
| Veto HV Monitor | 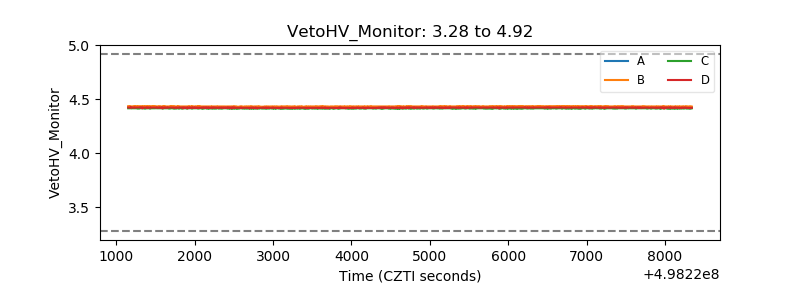 |
| Veto LLD | 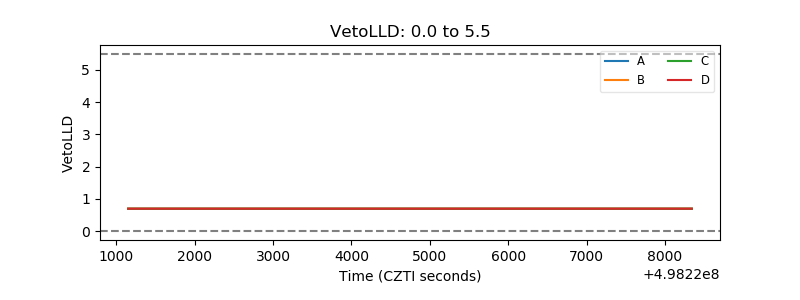 |
| Alpha Counter | 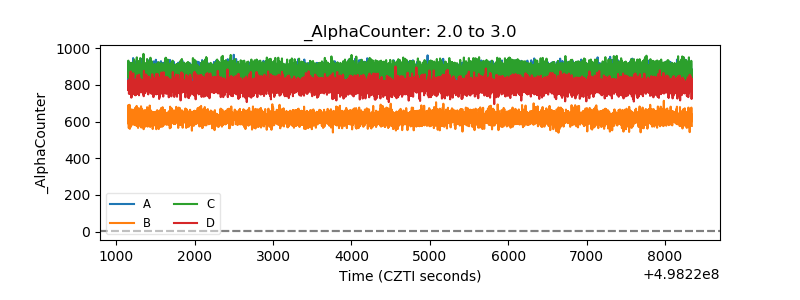 |
| _CPM_Rate | 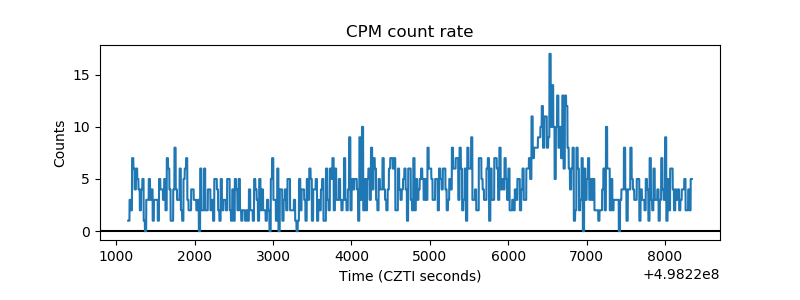 |
| CZT Counter | 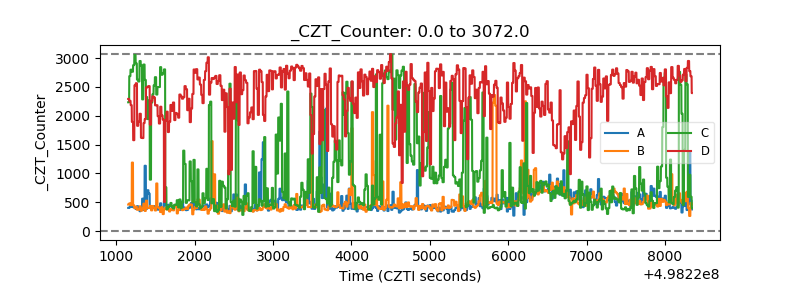 |
| +2.5 Volts monitor | 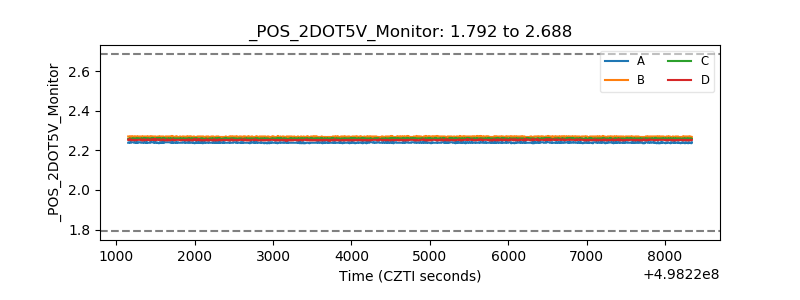 |
| +5 Volts monitor | 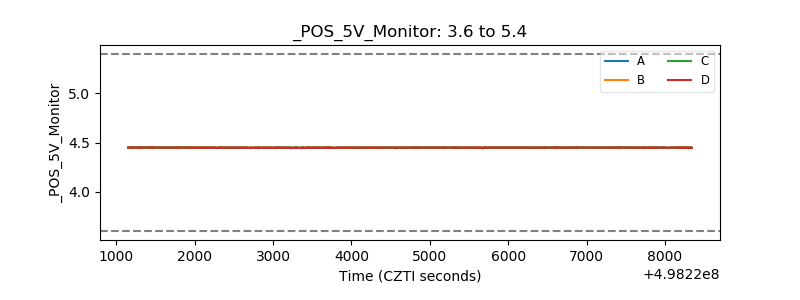 |
| _ROLL_ROT | 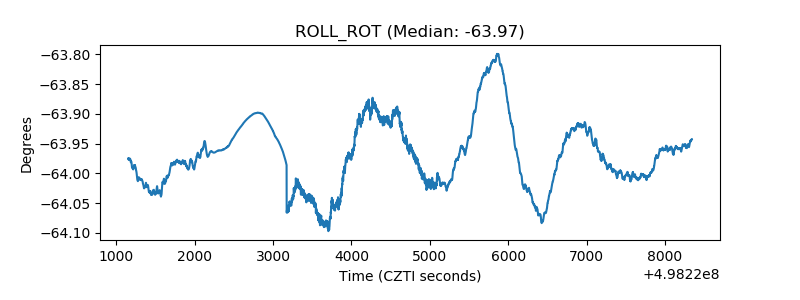 |
| _Roll_DEC | 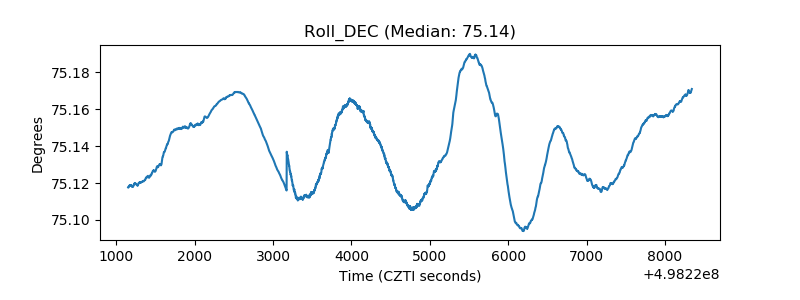 |
| _Roll_RA | 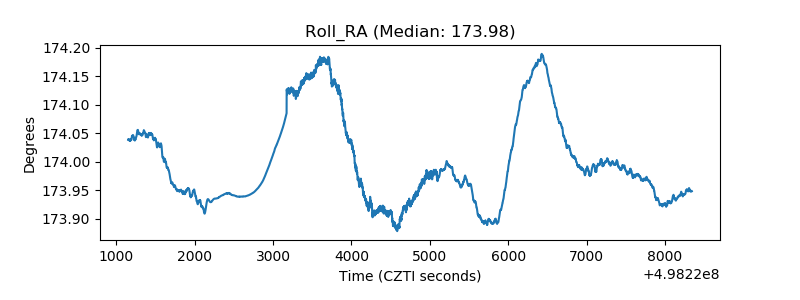 |
| Veto Counter | 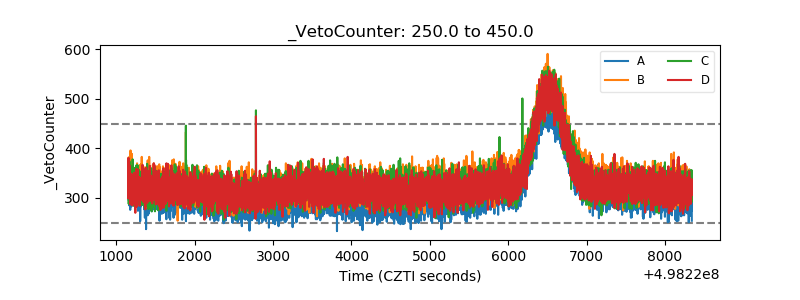 |