| Param | Original file | Final file |
|---|---|---|
| Filename | modeM0/AS1A14_126T15_9000006516_54361cztM0_level2.fits | modeM0/AS1A14_126T15_9000006516_54361cztM0_level2_quad_clean.evt |
| Size (bytes) | 916,179,840 | 88,309,440 |
| Size | 873.7 MB | 84.2 MB |
| Events in quadrant A | 4,158,592 | 714,274 |
| Events in quadrant B | 4,020,835 | 759,054 |
| Events in quadrant C | 6,987,881 | 584,050 |
| Events in quadrant D | 18,158,682 | 88,813 |
| Mode SS | |||
|---|---|---|---|
| Quadrant | BADHDUFLAG | Total packets | Discarded packets |
| A | 0 | 152 | 0 |
| B | 0 | 152 | 0 |
| C | 0 | 152 | 0 |
| D | 0 | 152 | 0 |
| Mode M0 | |||
|---|---|---|---|
| Quadrant | BADHDUFLAG | Total packets | Discarded packets |
| A | 0 | 17746 | 0 |
| B | 0 | 16792 | 0 |
| C | 0 | 26137 | 0 |
| D | 0 | 59009 | 0 |
| Quadrant | Total seconds | Saturated seconds | Saturation percentage |
|---|---|---|---|
| A | 7580 | 93 | 1.226913% |
| B | 7581 | 40 | 0.527635% |
| C | 7581 | 1097 | 14.470386% |
| D | 7581 | 6670 | 87.983116% |
Noise dominated data is calculated using 1-second bins in cleaned event files. If a bin has >2000 counts, and if more than 50% of those come from <1% of pixels, then it is considered to be noise-dominated and hence unusable.
| Quadrant | # 1 sec bins | Bins with >0 counts | Bins with >2000 counts | High rate bins dominated by noise | Noise dominated (total time) | Noise dominated (detector-on time) | Marked lightcurve |
|---|---|---|---|---|---|---|---|
| A | 7580 | 7580 | 70 | 70 | 0.92% | 0.92% | 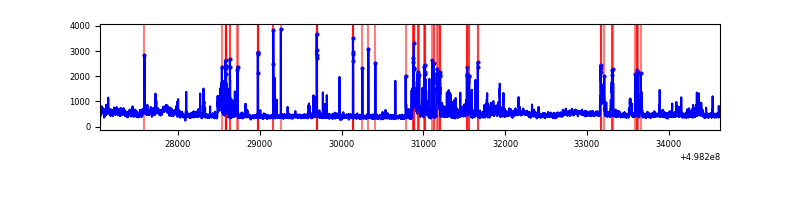 |
| B | 7581 | 7581 | 22 | 22 | 0.29% | 0.29% | 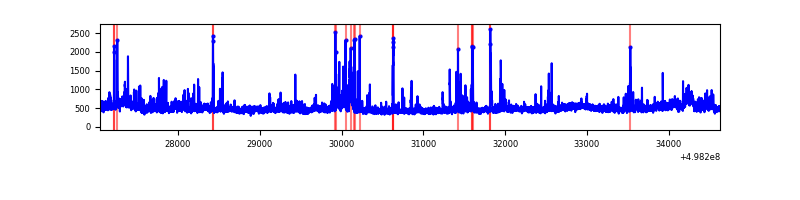 |
| C | 7581 | 7581 | 1070 | 1070 | 14.11% | 14.11% | 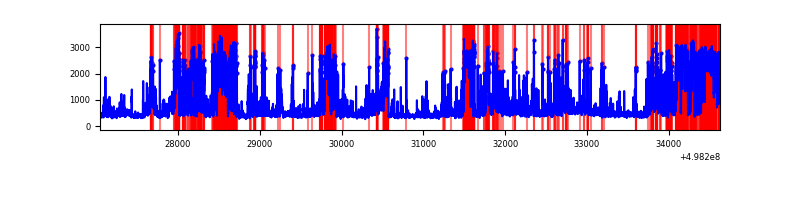 |
| D | 7581 | 7581 | 5925 | 5925 | 78.16% | 78.16% | 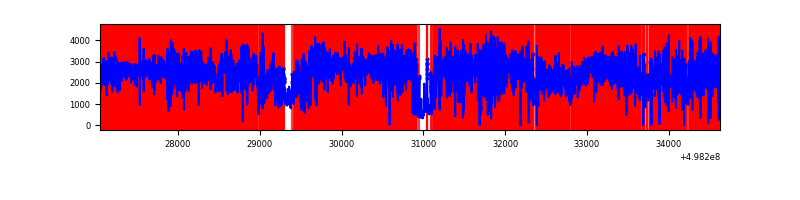 |
Top three noisy pixels from each quadrant. If the there are fewer than three noisy pixels in the level2.evt file, extra rows are filled as -1
| Pixel properties | Quadrant properties | ||||||
|---|---|---|---|---|---|---|---|
| Quadrant | DetID | PixID | Counts | Sigma | Mean | Median | Sigma |
| A | 15 | 174 | 517737 | 2636.81 | 790 | 769 | 196.1 |
| A | 4 | 249 | 180212 | 915.26 | 790 | 769 | 196.1 |
| A | 4 | 78 | 151823 | 770.46 | 790 | 769 | 196.1 |
| B | 14 | 167 | 255142 | 1512.74 | 779 | 749 | 168.2 |
| B | 5 | 172 | 113556 | 670.8 | 779 | 749 | 168.2 |
| B | 0 | 171 | 95178 | 561.52 | 779 | 749 | 168.2 |
| C | 1 | 241 | 1934174 | 10007.65 | 710 | 704 | 193.2 |
| C | 1 | 29 | 547389 | 2829.64 | 710 | 704 | 193.2 |
| C | 13 | 3 | 322104 | 1663.57 | 710 | 704 | 193.2 |
| D | 8 | 176 | 13431255 | 164614.4 | 284 | 270 | 81.6 |
| D | 15 | 108 | 3272593 | 40106.63 | 284 | 270 | 81.6 |
| D | 3 | 144 | 103840 | 1269.39 | 284 | 270 | 81.6 |
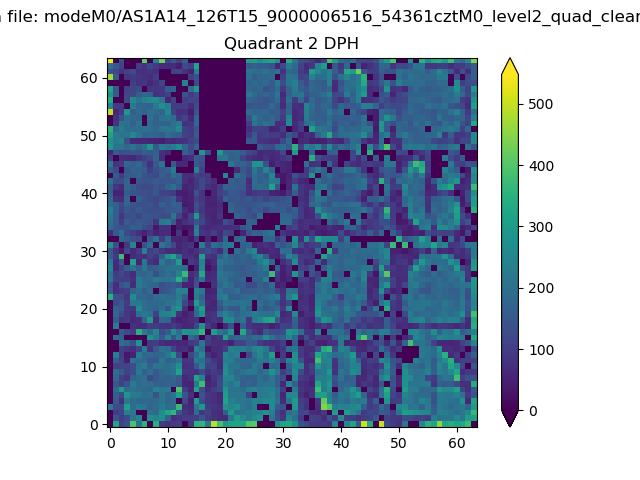
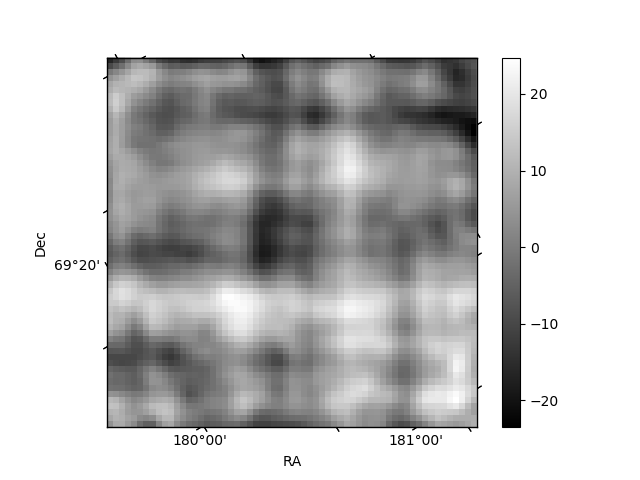
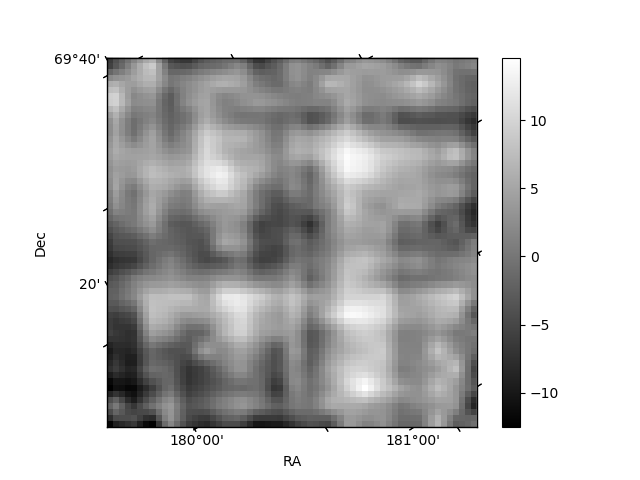
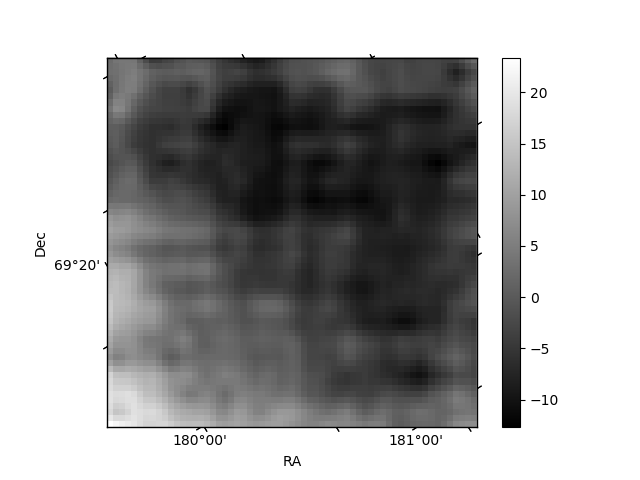
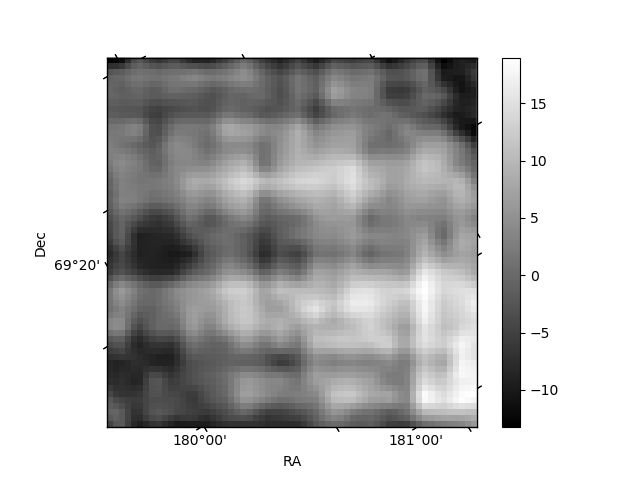
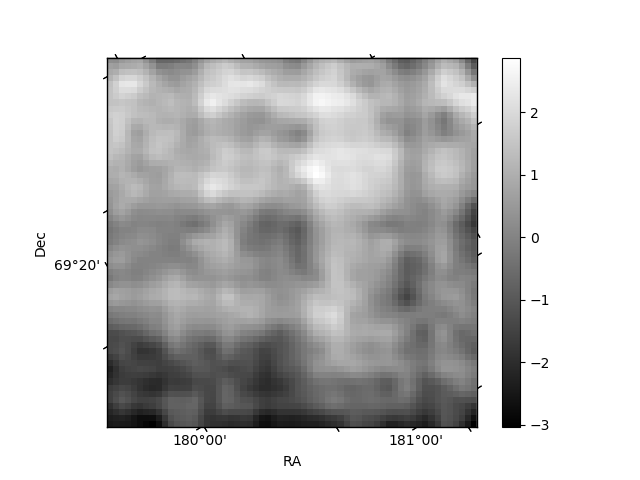
Histogram calculated using DETX and DETY for each event in the final _common_clean file
| Quadrant A | 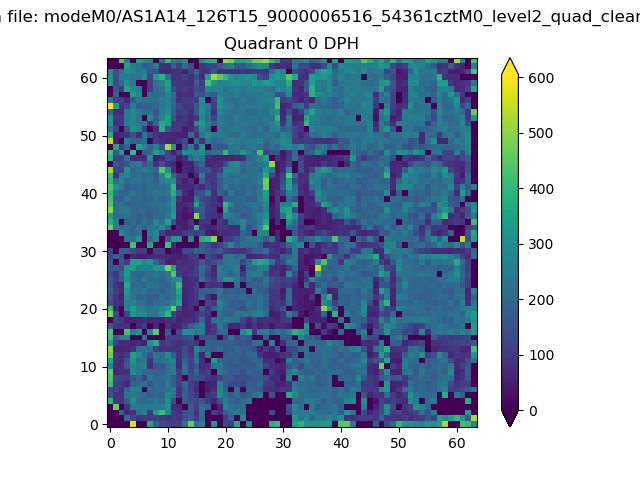 |
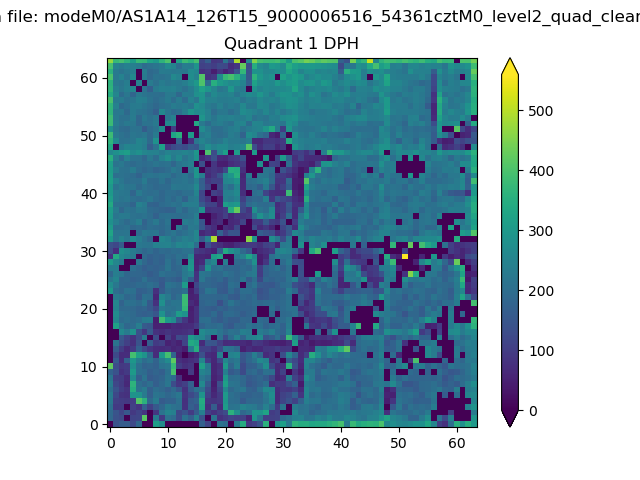 |
Quadrant B |
|---|---|---|---|
| Quadrant D | 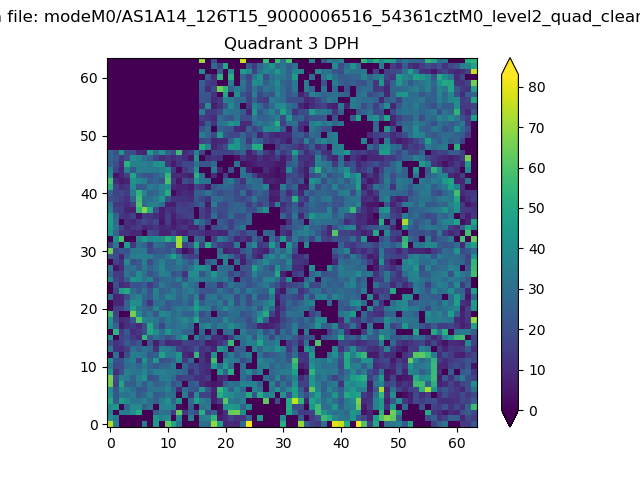 |
 |
Quadrant C |
| Plot type | Count rate plots | Images |
|---|---|---|
| Comparison with Poisson distribution Blue bars denote a histogram of data divided into 1 sec bins. Red curve is a Poisson curve with rate = median count rate of data. |
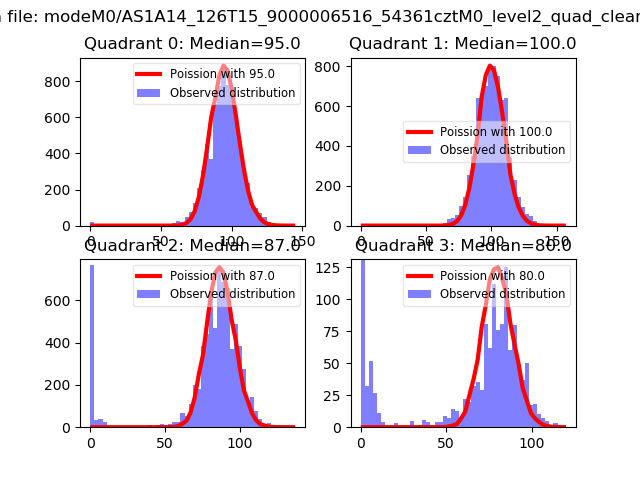 |
 |
| Quadrant-wise count rates Data is divided into 100 sec bins |
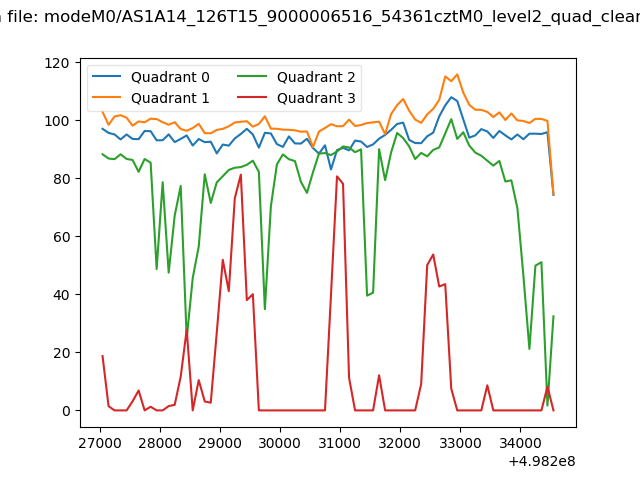 |
|
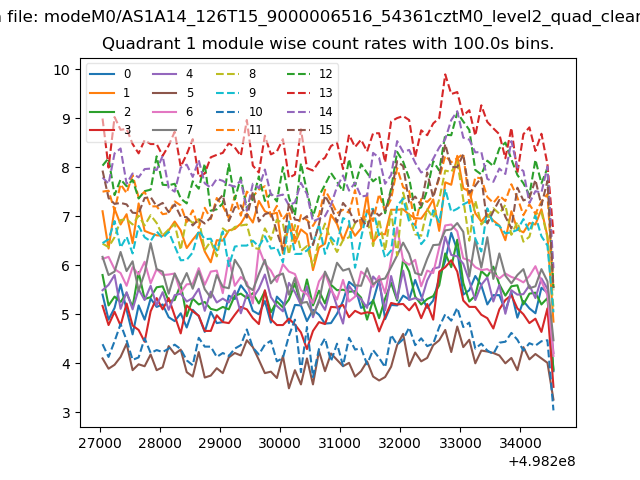
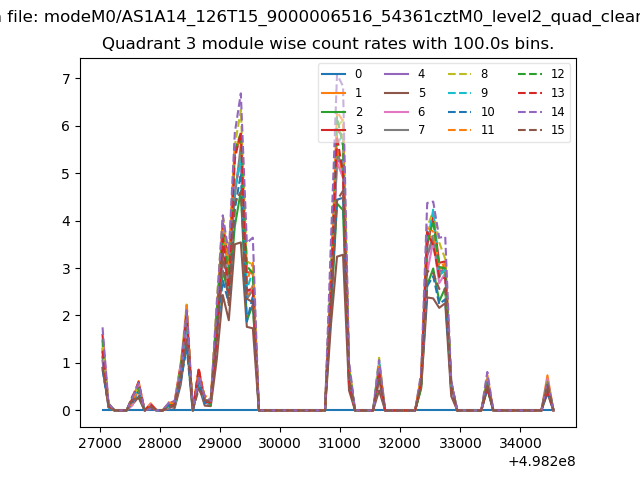
| Module-wise count rates for Quadrant A Data is divided into 100 sec bins |
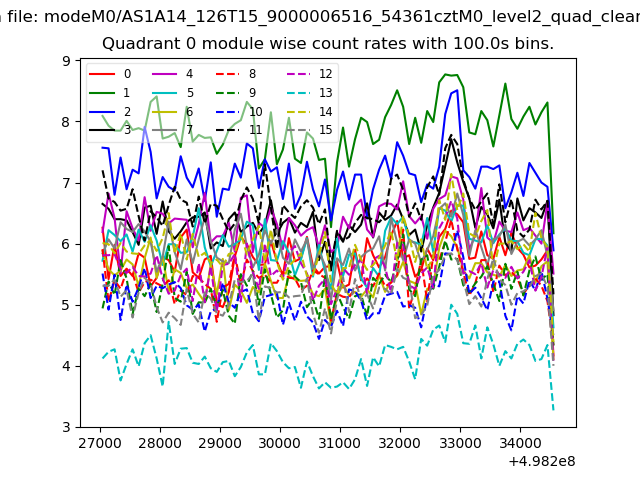 |
 |
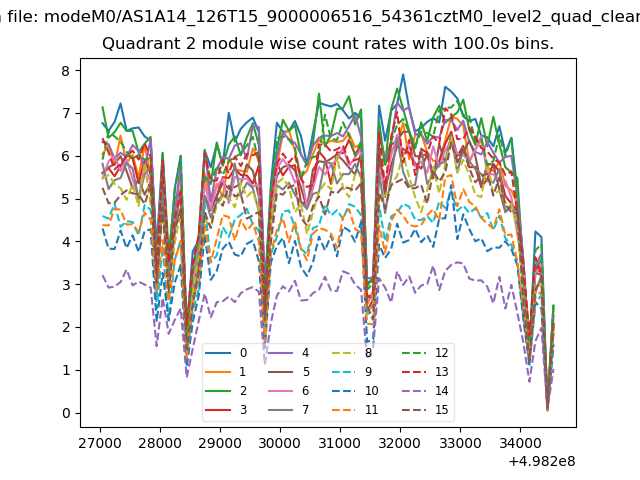
| Module-wise count rates for Quadrant B Data is divided into 100 sec bins |
 |
 |
| Module-wise count rates for Quadrant C Data is divided into 100 sec bins |
 |
 |
| Module-wise count rates for Quadrant D Data is divided into 100 sec bins |
 |
 |
| Parameter | Plot |
|---|---|
| CZT HV Monitor | 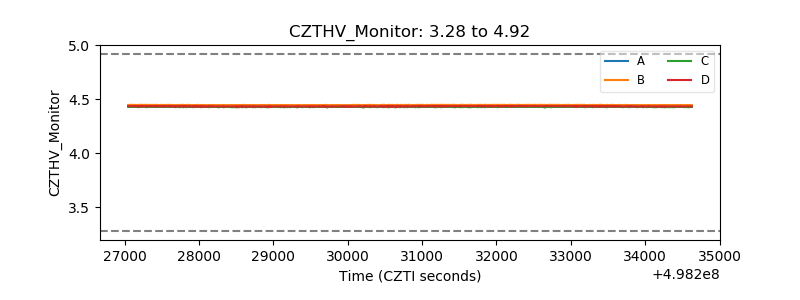 |
| D_VDD | 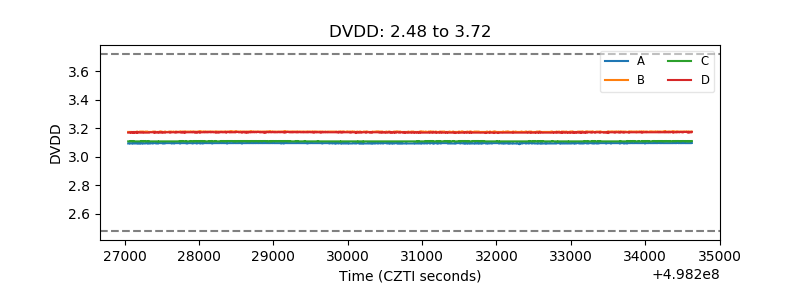 |
| Temperature 1 | 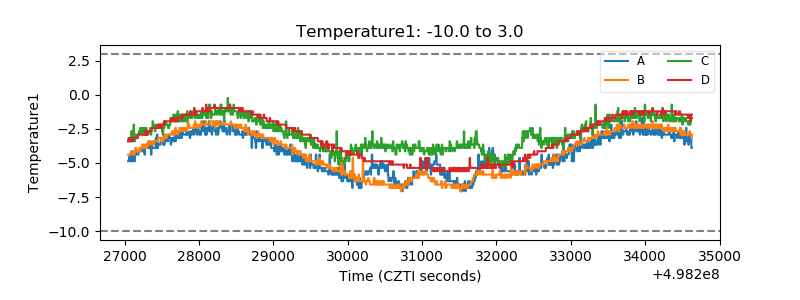 |
| Veto HV Monitor | 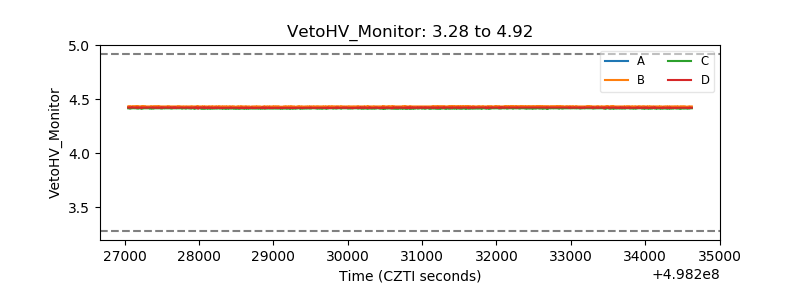 |
| Veto LLD | 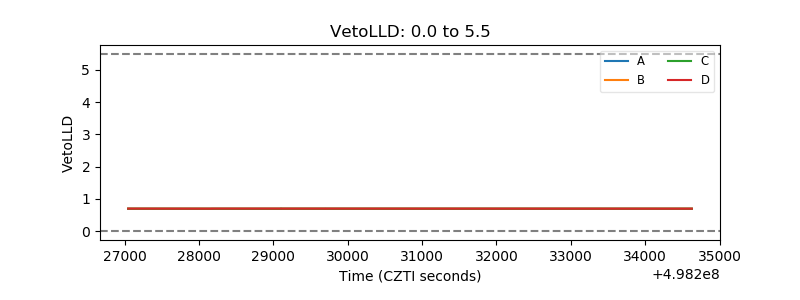 |
| Alpha Counter | 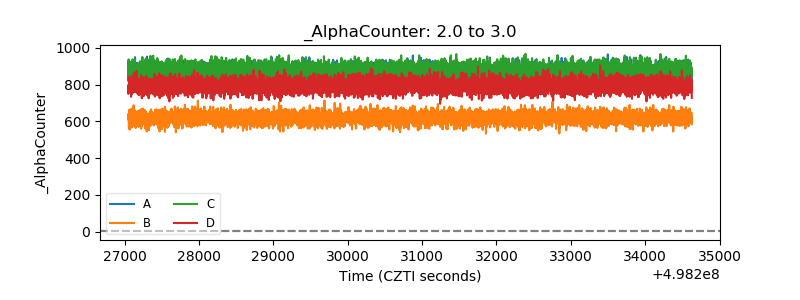 |
| _CPM_Rate | 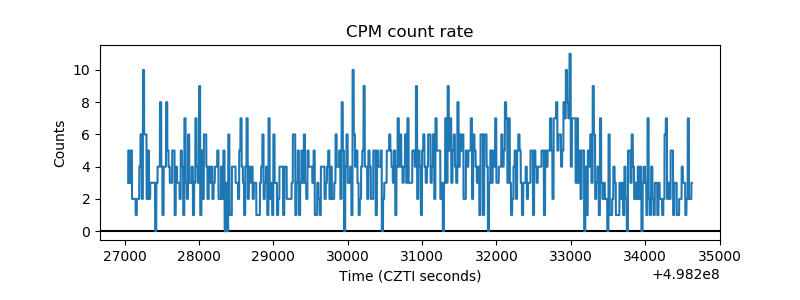 |
| CZT Counter | 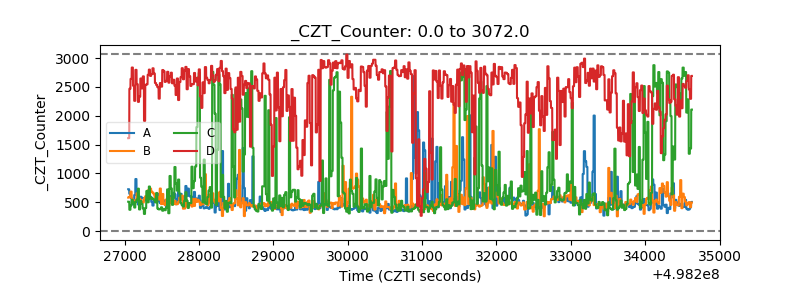 |
| +2.5 Volts monitor |  |
| +5 Volts monitor |  |
| _ROLL_ROT | 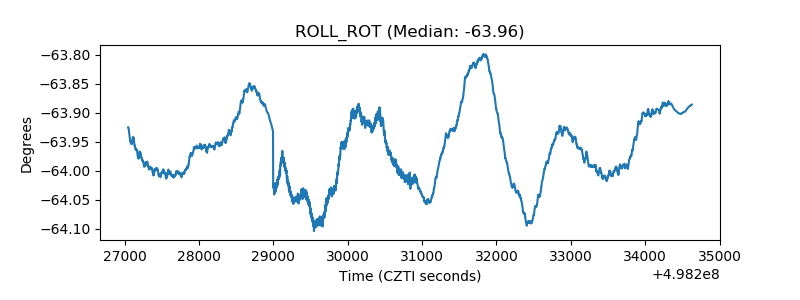 |
| _Roll_DEC | 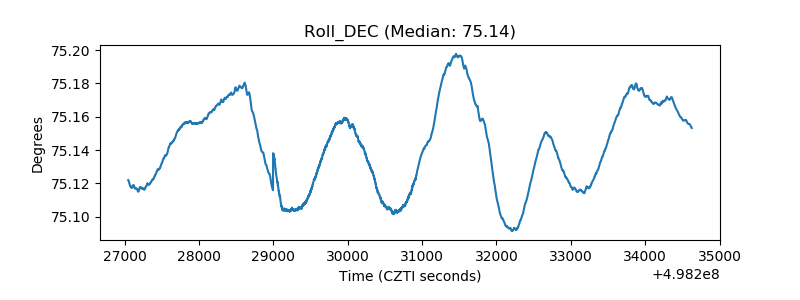 |
| _Roll_RA | 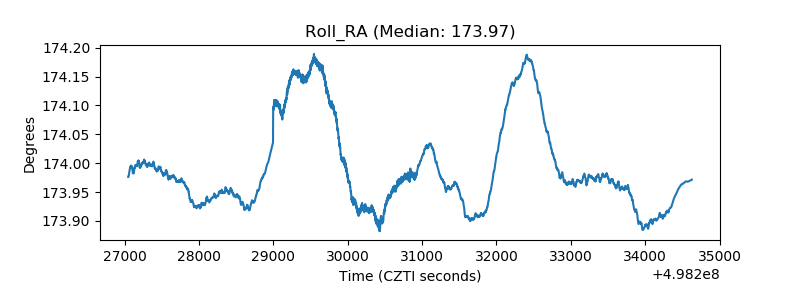 |
| Veto Counter | 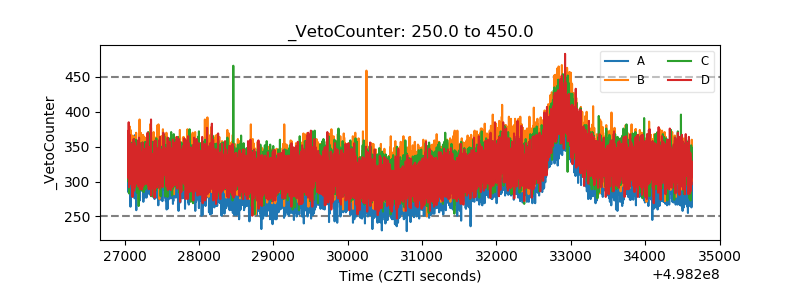 |