| Param | Original file | Final file |
|---|---|---|
| Filename | modeM0/AS1A14_126T15_9000006516_54362cztM0_level2.fits | modeM0/AS1A14_126T15_9000006516_54362cztM0_level2_quad_clean.evt |
| Size (bytes) | 834,333,120 | 85,095,360 |
| Size | 795.7 MB | 81.2 MB |
| Events in quadrant A | 4,237,503 | 651,952 |
| Events in quadrant B | 3,564,028 | 728,910 |
| Events in quadrant C | 6,182,615 | 585,598 |
| Events in quadrant D | 16,336,724 | 104,938 |
| Mode SS | |||
|---|---|---|---|
| Quadrant | BADHDUFLAG | Total packets | Discarded packets |
| A | 0 | 144 | 0 |
| B | 0 | 144 | 0 |
| C | 0 | 144 | 0 |
| D | 0 | 144 | 0 |
| Mode M0 | |||
|---|---|---|---|
| Quadrant | BADHDUFLAG | Total packets | Discarded packets |
| A | 0 | 18009 | 0 |
| B | 0 | 15443 | 0 |
| C | 0 | 23565 | 0 |
| D | 0 | 53497 | 3 |
| Quadrant | Total seconds | Saturated seconds | Saturation percentage |
|---|---|---|---|
| A | 7254 | 379 | 5.224704% |
| B | 7255 | 26 | 0.358374% |
| C | 7255 | 819 | 11.288766% |
| D | 7254 | 6120 | 84.367246% |
Noise dominated data is calculated using 1-second bins in cleaned event files. If a bin has >2000 counts, and if more than 50% of those come from <1% of pixels, then it is considered to be noise-dominated and hence unusable.
| Quadrant | # 1 sec bins | Bins with >0 counts | Bins with >2000 counts | High rate bins dominated by noise | Noise dominated (total time) | Noise dominated (detector-on time) | Marked lightcurve |
|---|---|---|---|---|---|---|---|
| A | 7254 | 7254 | 326 | 326 | 4.49% | 4.49% | 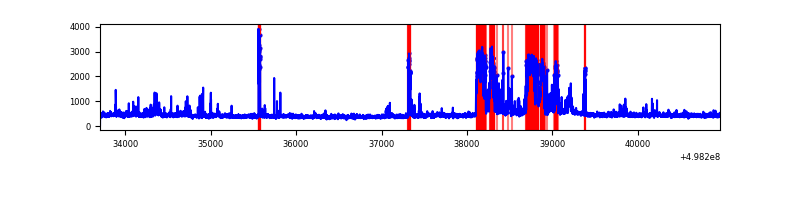 |
| B | 7255 | 7255 | 9 | 9 | 0.12% | 0.12% | 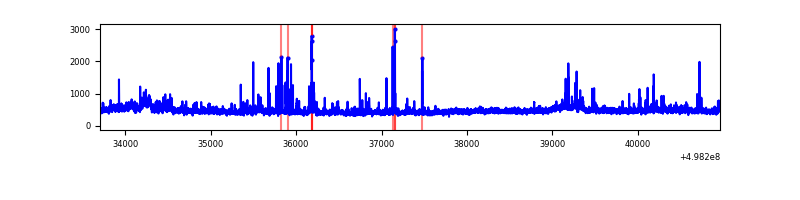 |
| C | 7255 | 7255 | 828 | 828 | 11.41% | 11.41% | 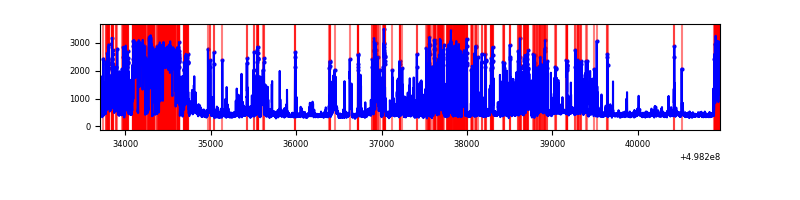 |
| D | 7254 | 7254 | 5054 | 5054 | 69.67% | 69.67% | 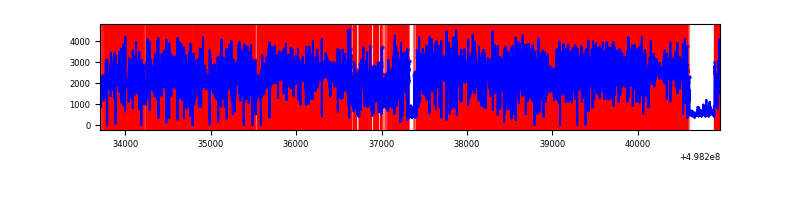 |
Top three noisy pixels from each quadrant. If the there are fewer than three noisy pixels in the level2.evt file, extra rows are filled as -1
| Pixel properties | Quadrant properties | ||||||
|---|---|---|---|---|---|---|---|
| Quadrant | DetID | PixID | Counts | Sigma | Mean | Median | Sigma |
| A | 15 | 174 | 1027024 | 5559.83 | 746 | 727 | 184.6 |
| A | 4 | 249 | 117212 | 631.04 | 746 | 727 | 184.6 |
| A | 1 | 241 | 58717 | 314.15 | 746 | 727 | 184.6 |
| B | 14 | 167 | 191889 | 1188.86 | 752 | 725 | 160.8 |
| B | 10 | 247 | 77083 | 474.88 | 752 | 725 | 160.8 |
| B | 7 | 0 | 70311 | 432.76 | 752 | 725 | 160.8 |
| C | 1 | 241 | 1527873 | 7901.57 | 703 | 697 | 193.3 |
| C | 1 | 16 | 778913 | 4026.47 | 703 | 697 | 193.3 |
| C | 14 | 254 | 351625 | 1815.69 | 703 | 697 | 193.3 |
| D | 8 | 176 | 12474729 | 159343.18 | 271 | 258 | 78.3 |
| D | 15 | 108 | 2642009 | 33744.52 | 271 | 258 | 78.3 |
| D | 3 | 12 | 59951 | 762.49 | 271 | 258 | 78.3 |
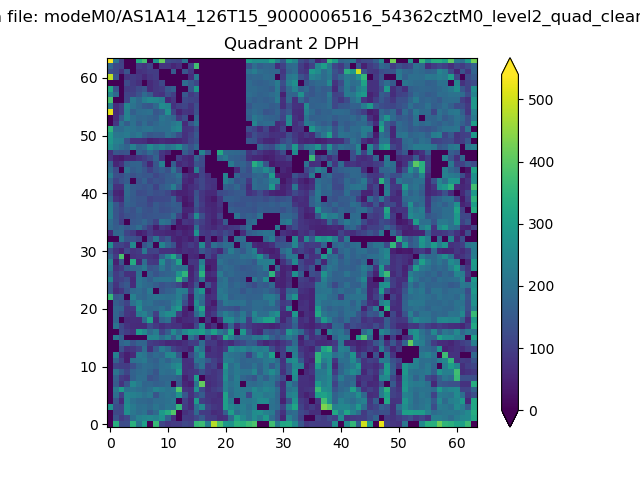
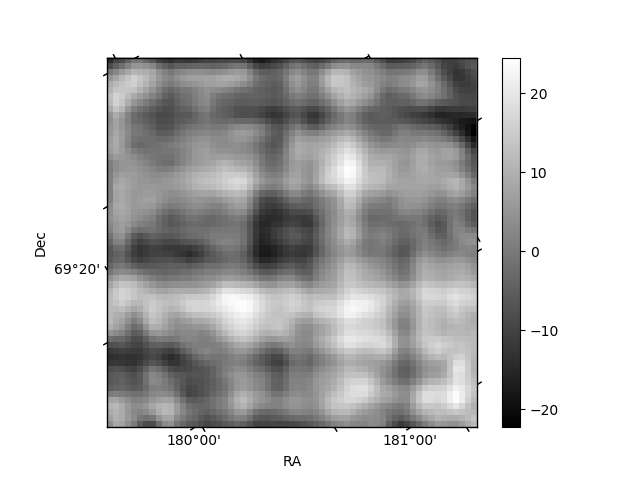
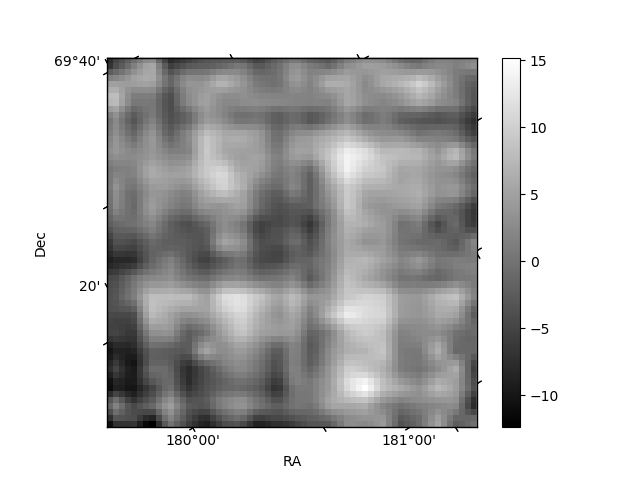
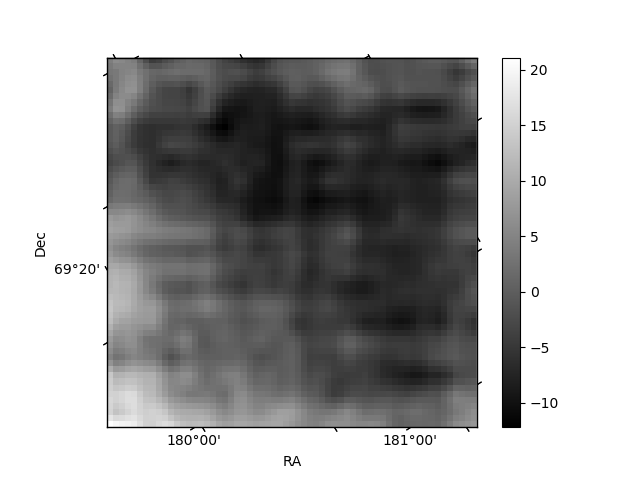
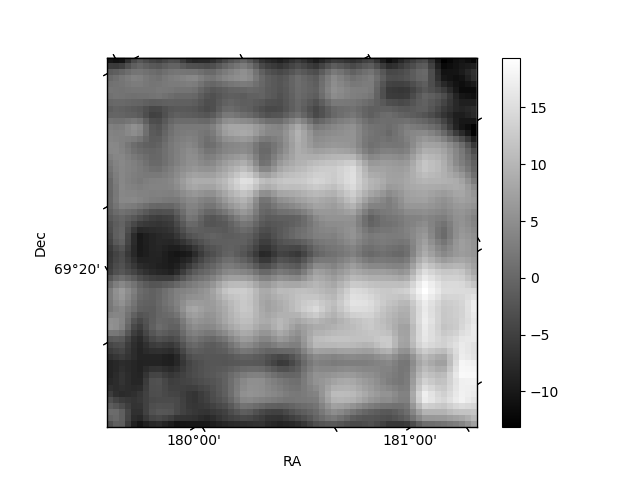
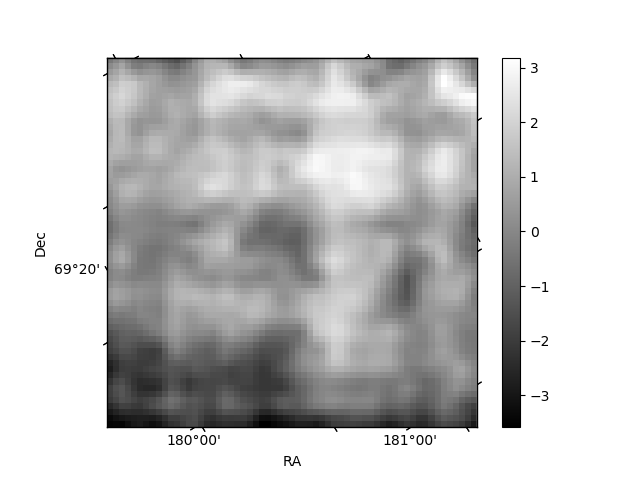
Histogram calculated using DETX and DETY for each event in the final _common_clean file
| Quadrant A | 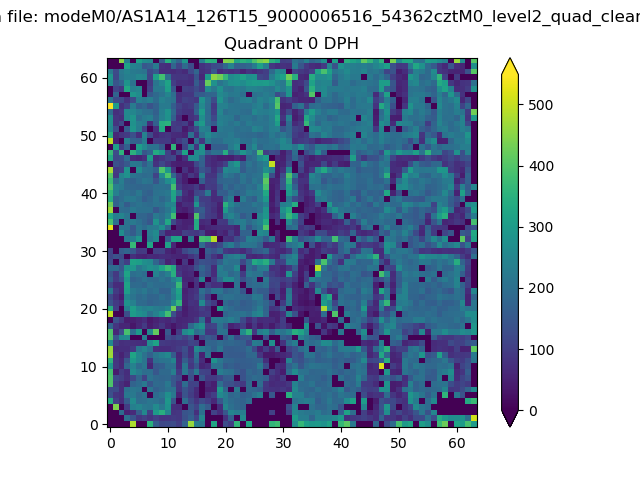 |
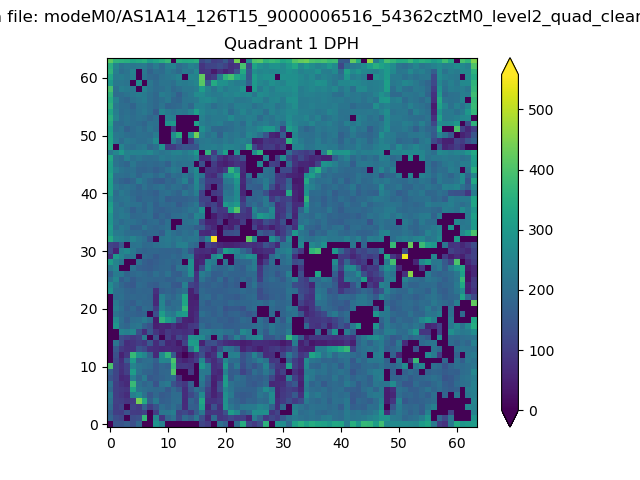 |
Quadrant B |
|---|---|---|---|
| Quadrant D | 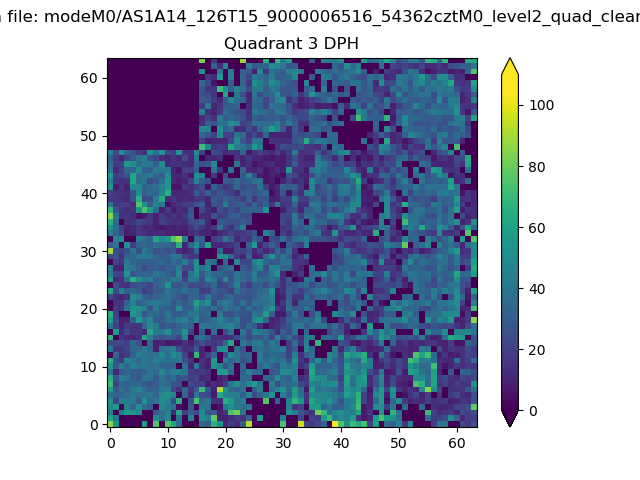 |
 |
Quadrant C |
| Plot type | Count rate plots | Images |
|---|---|---|
| Comparison with Poisson distribution Blue bars denote a histogram of data divided into 1 sec bins. Red curve is a Poisson curve with rate = median count rate of data. |
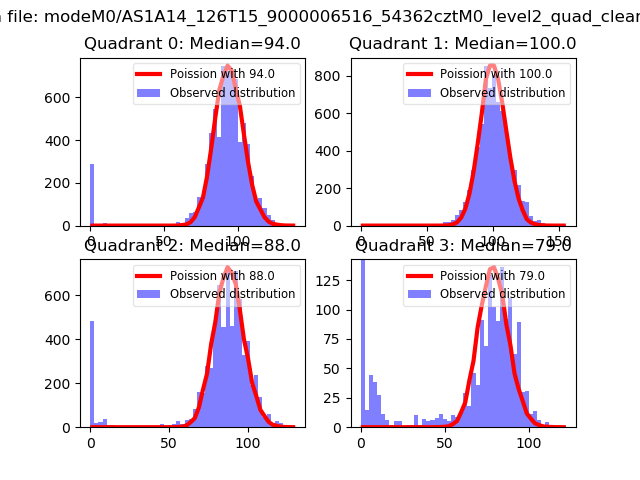 |
 |
| Quadrant-wise count rates Data is divided into 100 sec bins |
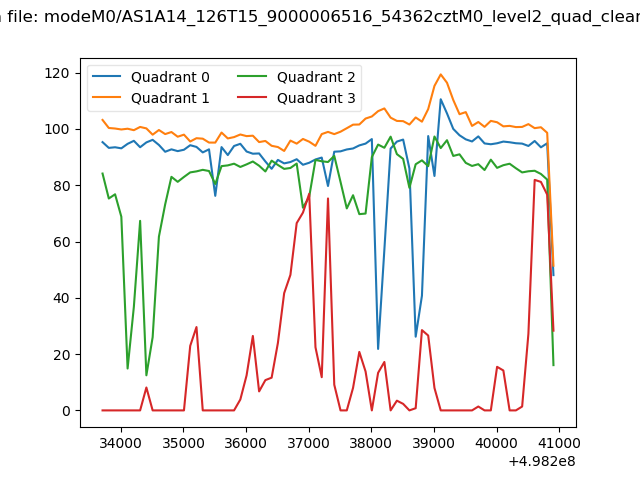 |
|
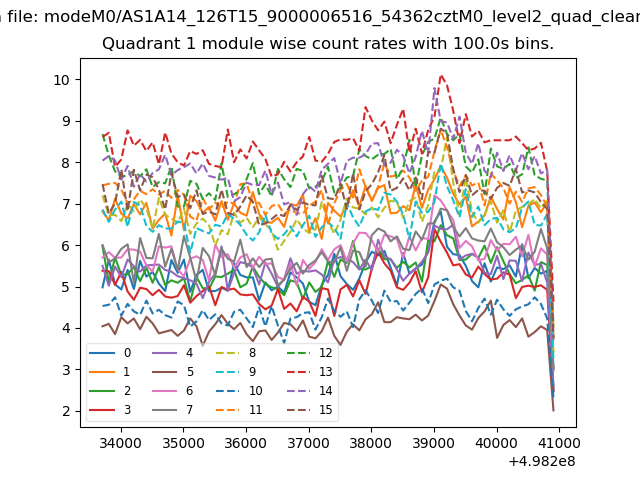
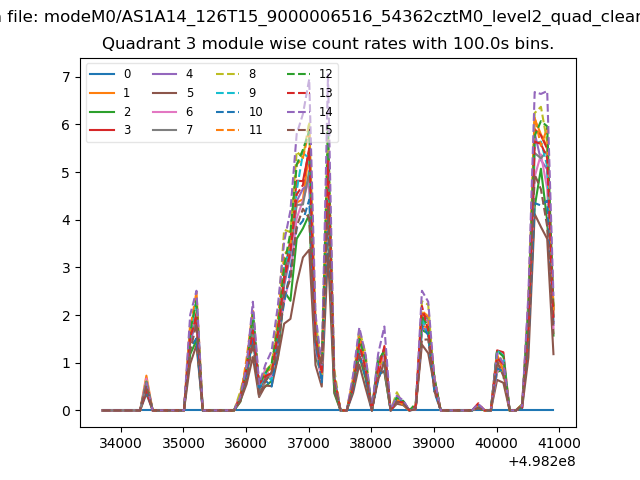
| Module-wise count rates for Quadrant A Data is divided into 100 sec bins |
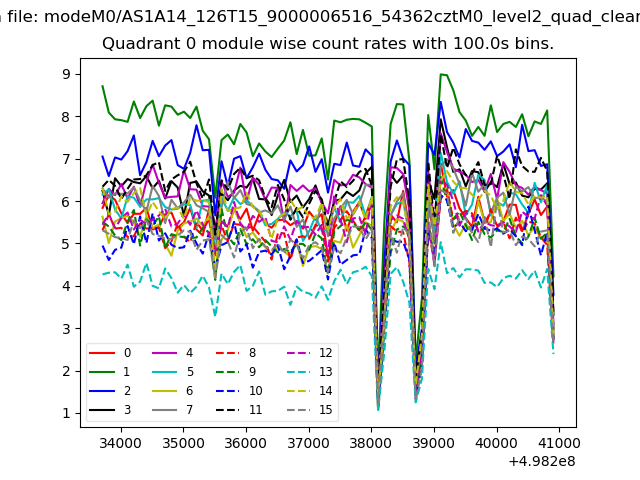 |
 |
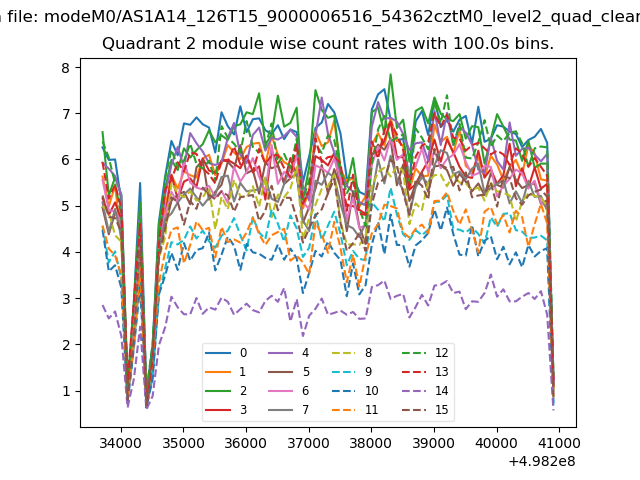
| Module-wise count rates for Quadrant B Data is divided into 100 sec bins |
 |
 |
| Module-wise count rates for Quadrant C Data is divided into 100 sec bins |
 |
 |
| Module-wise count rates for Quadrant D Data is divided into 100 sec bins |
 |
 |
| Parameter | Plot |
|---|---|
| CZT HV Monitor | 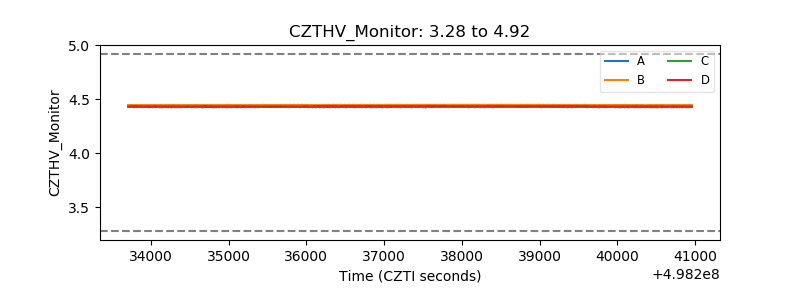 |
| D_VDD | 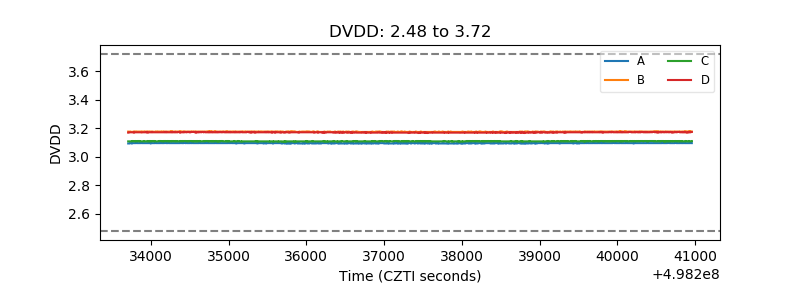 |
| Temperature 1 | 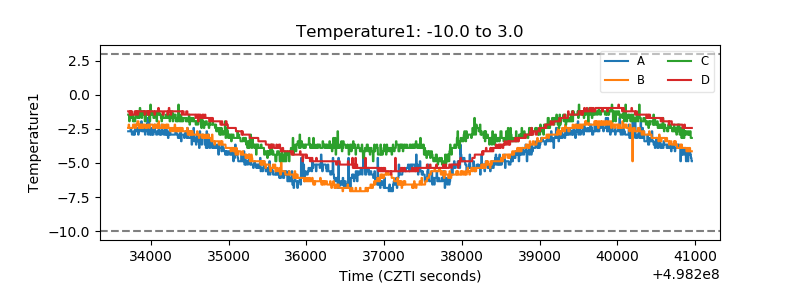 |
| Veto HV Monitor |  |
| Veto LLD | 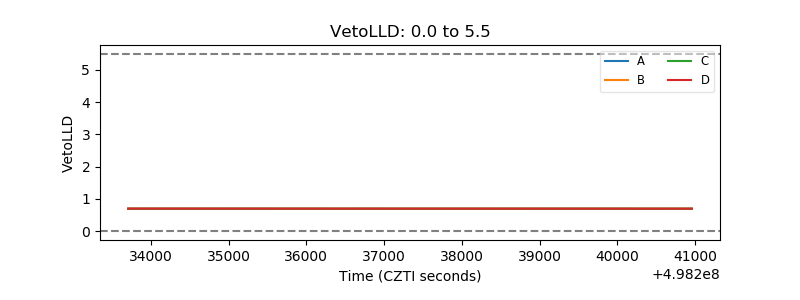 |
| Alpha Counter | 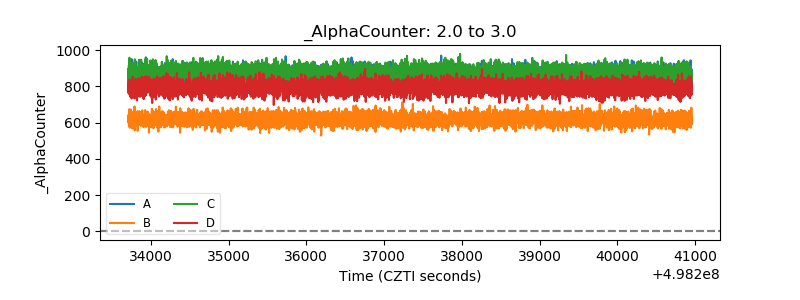 |
| _CPM_Rate | 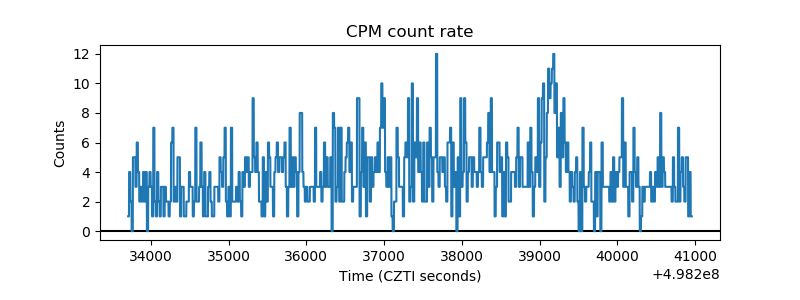 |
| CZT Counter | 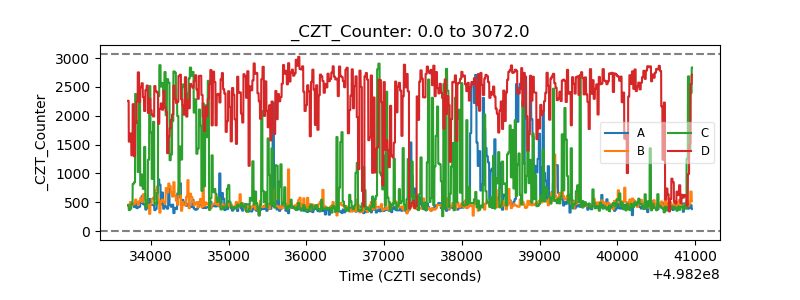 |
| +2.5 Volts monitor |  |
| +5 Volts monitor |  |
| _ROLL_ROT | 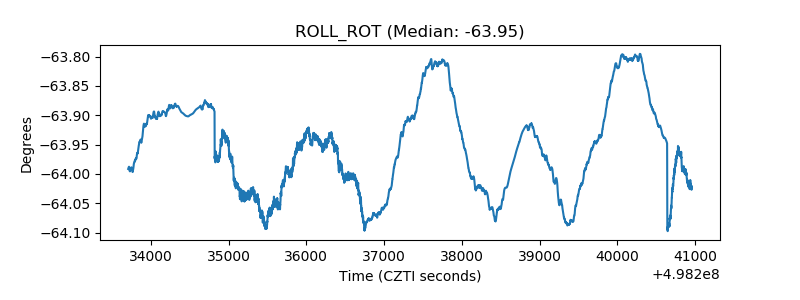 |
| _Roll_DEC | 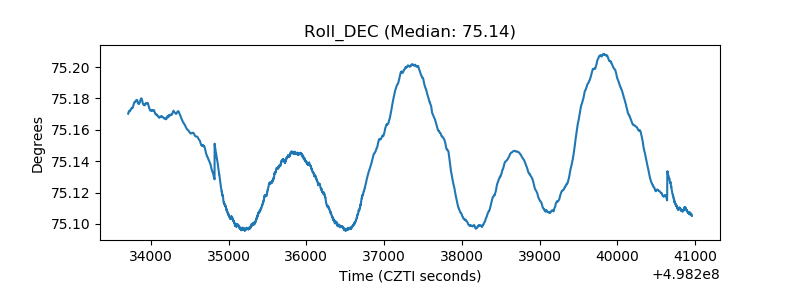 |
| _Roll_RA | 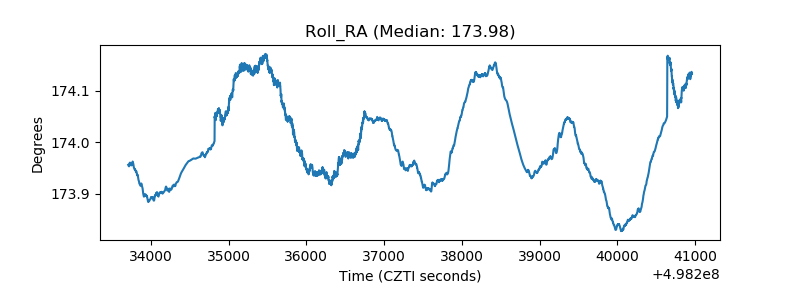 |
| Veto Counter | 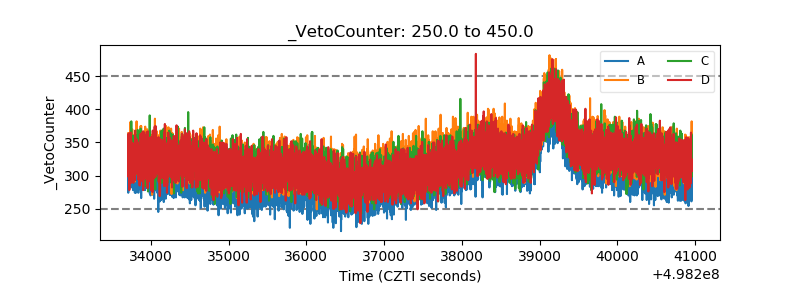 |