| Param | Original file | Final file |
|---|---|---|
| Filename | modeM0/AS1A14_126T15_9000006516_54365cztM0_level2.fits | modeM0/AS1A14_126T15_9000006516_54365cztM0_level2_quad_clean.evt |
| Size (bytes) | 2,250,360,000 | 185,359,680 |
| Size | 2.1 GB | 176.8 MB |
| Events in quadrant A | 8,568,399 | 1,578,189 |
| Events in quadrant B | 9,732,229 | 1,682,594 |
| Events in quadrant C | 24,756,508 | 903,005 |
| Events in quadrant D | 38,915,173 | 261,389 |
| Mode SS | |||
|---|---|---|---|
| Quadrant | BADHDUFLAG | Total packets | Discarded packets |
| A | 0 | 346 | 0 |
| B | 0 | 346 | 0 |
| C | 0 | 346 | 0 |
| D | 0 | 346 | 0 |
| Mode M0 | |||
|---|---|---|---|
| Quadrant | BADHDUFLAG | Total packets | Discarded packets |
| A | 0 | 38190 | 2 |
| B | 0 | 40823 | 2 |
| C | 0 | 85643 | 2 |
| D | 0 | 127385 | 2 |
| Mode M9 | |||
|---|---|---|---|
| Quadrant | BADHDUFLAG | Total packets | Discarded packets |
| A | 0 | 5 | 0 |
| B | 0 | 5 | 0 |
| C | 0 | 5 | 0 |
| D | 0 | 5 | 0 |
| Quadrant | Total seconds | Saturated seconds | Saturation percentage |
|---|---|---|---|
| A | 17203 | 316 | 1.836889% |
| B | 17204 | 377 | 2.191351% |
| C | 17204 | 6901 | 40.112764% |
| D | 17204 | 14450 | 83.992095% |
Noise dominated data is calculated using 1-second bins in cleaned event files. If a bin has >2000 counts, and if more than 50% of those come from <1% of pixels, then it is considered to be noise-dominated and hence unusable.
| Quadrant | # 1 sec bins | Bins with >0 counts | Bins with >2000 counts | High rate bins dominated by noise | Noise dominated (total time) | Noise dominated (detector-on time) | Marked lightcurve |
|---|---|---|---|---|---|---|---|
| A | 17713 | 17206 | 256 | 256 | 1.45% | 1.49% | 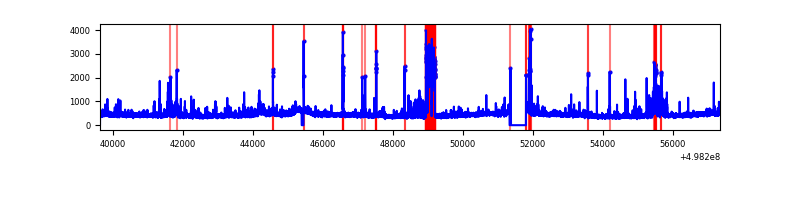 |
| B | 17714 | 17207 | 149 | 149 | 0.84% | 0.87% | 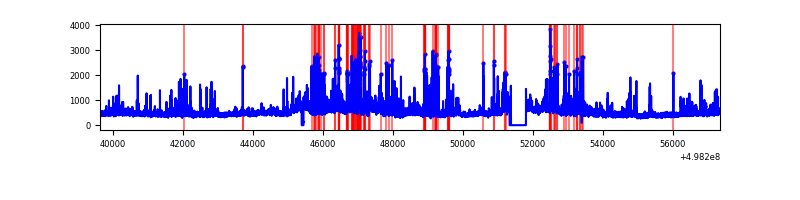 |
| C | 17714 | 17207 | 6603 | 6603 | 37.28% | 38.37% | 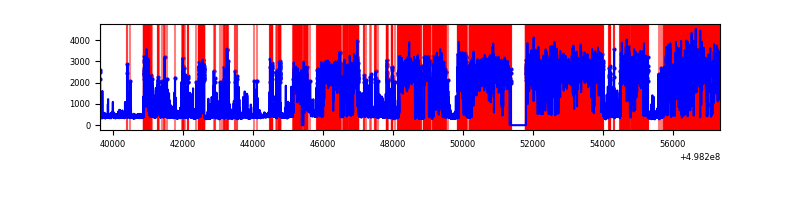 |
| D | 17713 | 17206 | 12131 | 12131 | 68.49% | 70.50% | 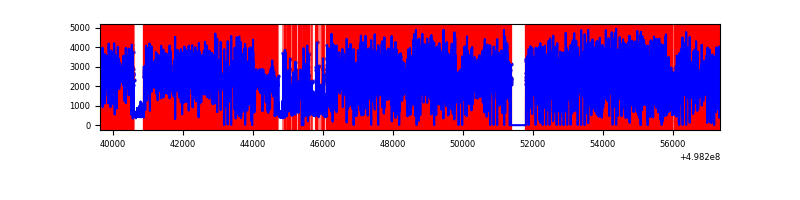 |
Top three noisy pixels from each quadrant. If the there are fewer than three noisy pixels in the level2.evt file, extra rows are filled as -1
| Pixel properties | Quadrant properties | ||||||
|---|---|---|---|---|---|---|---|
| Quadrant | DetID | PixID | Counts | Sigma | Mean | Median | Sigma |
| A | 4 | 249 | 637164 | 1434.4 | 1795 | 1746 | 443.0 |
| A | 5 | 243 | 378446 | 850.37 | 1795 | 1746 | 443.0 |
| A | 15 | 174 | 121743 | 270.88 | 1795 | 1746 | 443.0 |
| B | 7 | 0 | 798963 | 2120.14 | 1772 | 1706 | 376.0 |
| B | 0 | 213 | 638365 | 1693.06 | 1772 | 1706 | 376.0 |
| B | 10 | 247 | 202635 | 534.33 | 1772 | 1706 | 376.0 |
| C | 1 | 241 | 15967120 | 42823.59 | 1364 | 1349 | 372.8 |
| C | 2 | 255 | 970182 | 2598.62 | 1364 | 1349 | 372.8 |
| C | 1 | 29 | 823083 | 2204.07 | 1364 | 1349 | 372.8 |
| D | 8 | 176 | 34984526 | 177319.69 | 689 | 658 | 197.3 |
| D | 3 | 12 | 412365 | 2086.78 | 689 | 658 | 197.3 |
| D | 15 | 108 | 324455 | 1641.2 | 689 | 658 | 197.3 |
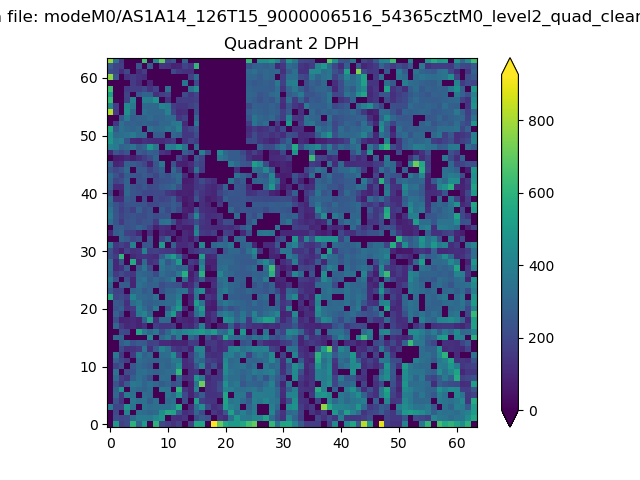
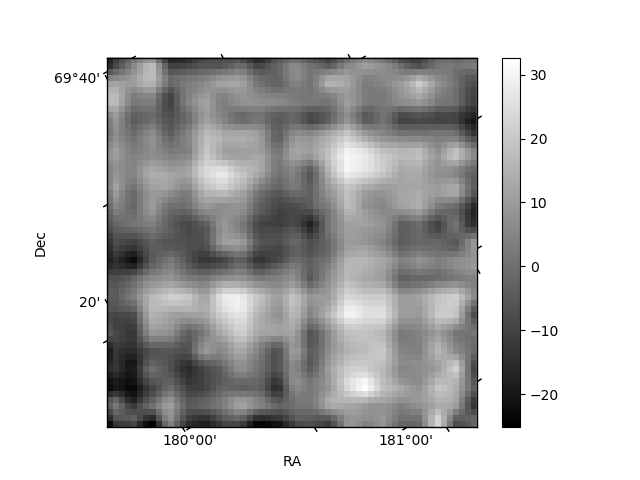
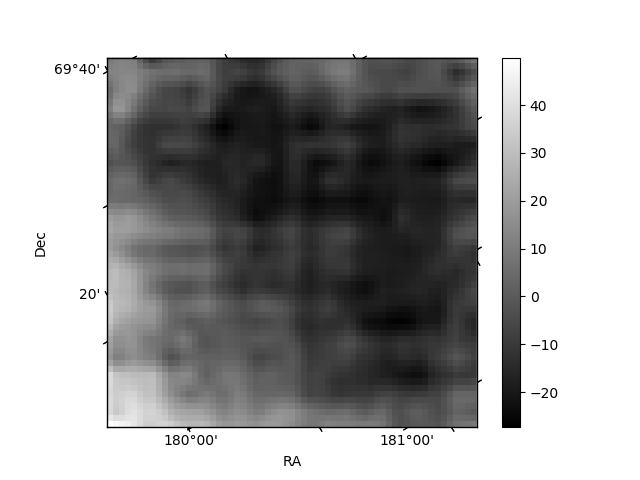
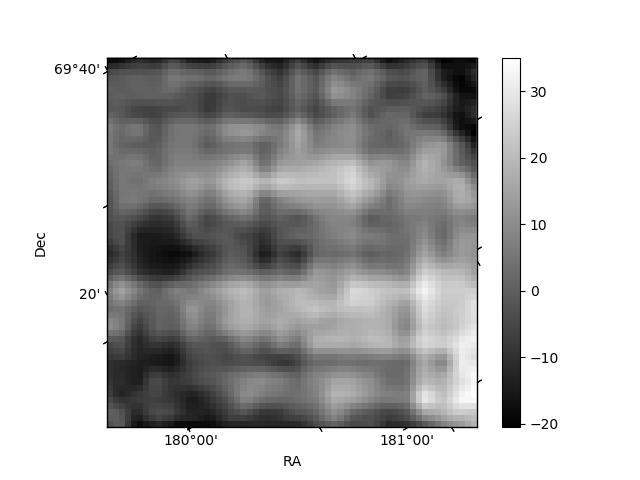
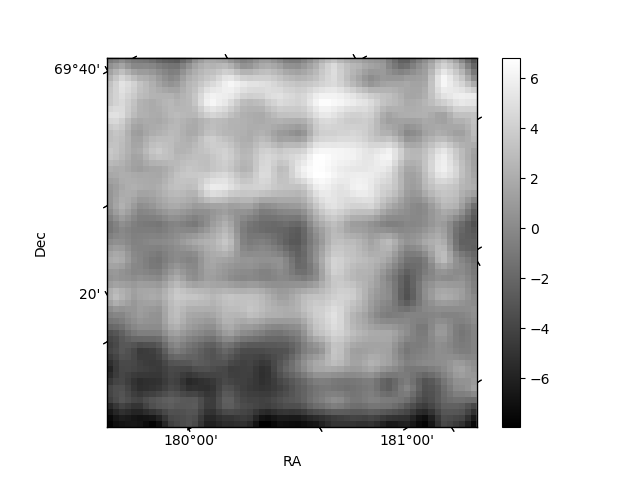
Histogram calculated using DETX and DETY for each event in the final _common_clean file
| Quadrant A | 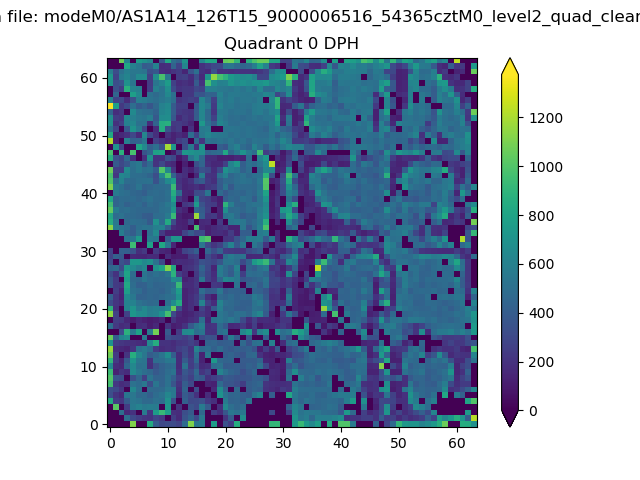 |
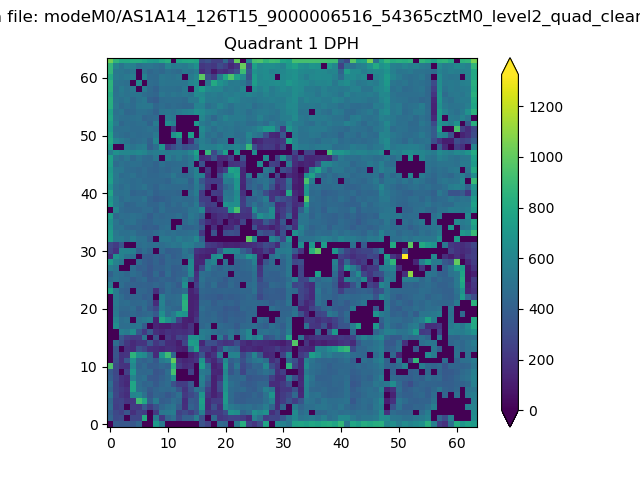 |
Quadrant B |
|---|---|---|---|
| Quadrant D | 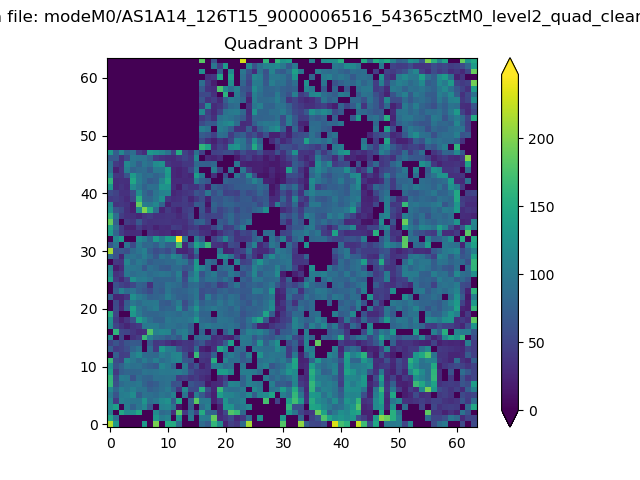 |
 |
Quadrant C |
| Plot type | Count rate plots | Images |
|---|---|---|
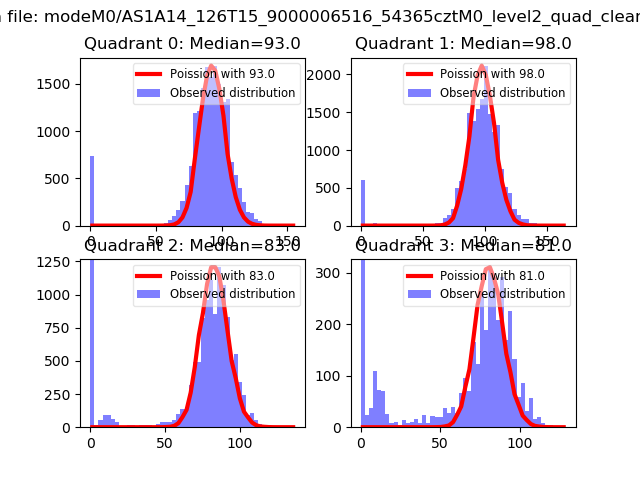
| Comparison with Poisson distribution Blue bars denote a histogram of data divided into 1 sec bins. Red curve is a Poisson curve with rate = median count rate of data. |
 |
 |
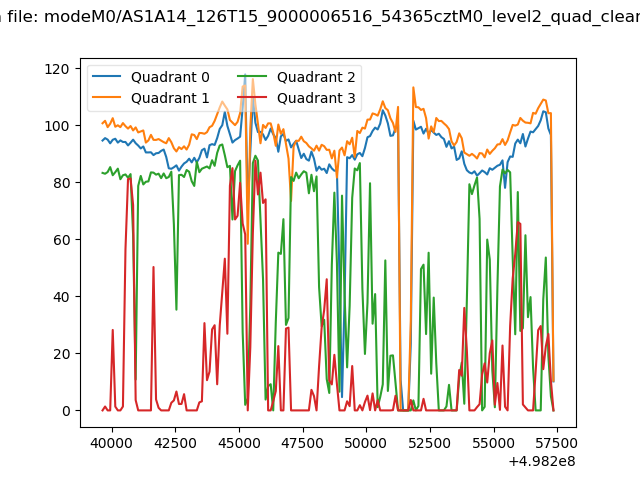
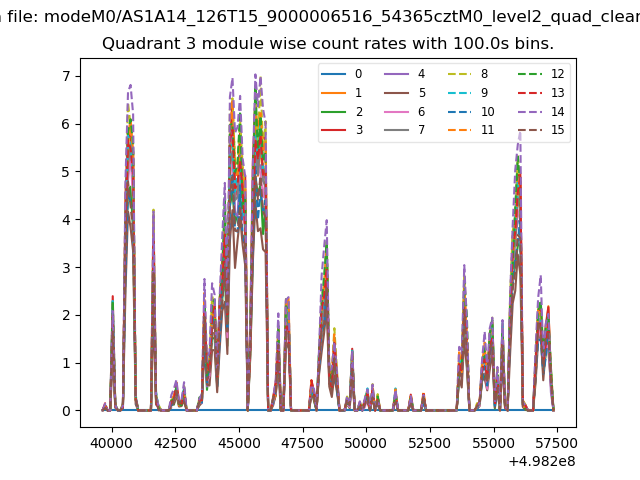
| Quadrant-wise count rates Data is divided into 100 sec bins |
 |
|
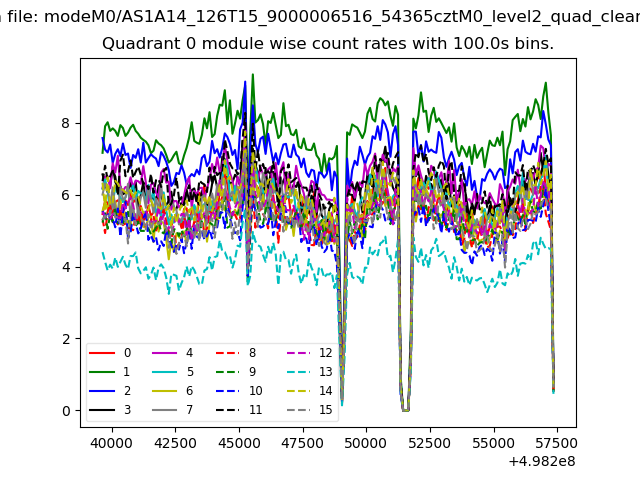
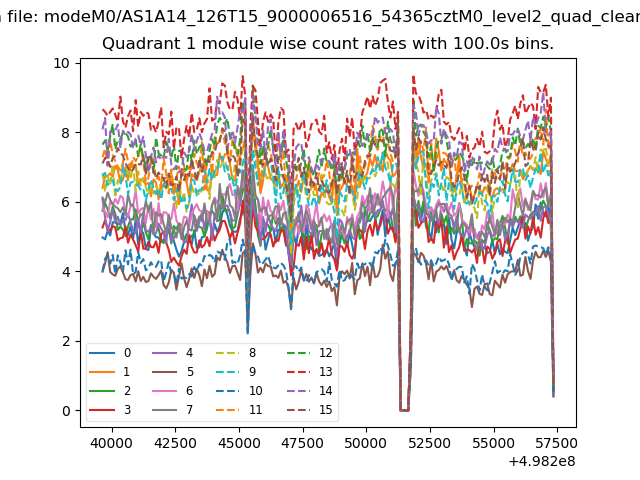
| Module-wise count rates for Quadrant A Data is divided into 100 sec bins |
 |
 |
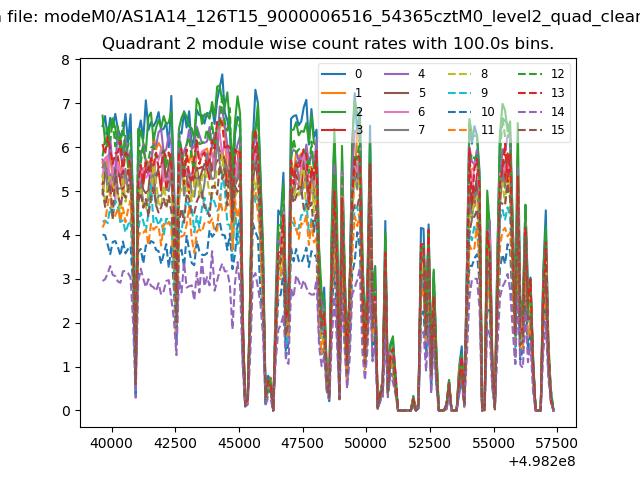
| Module-wise count rates for Quadrant B Data is divided into 100 sec bins |
 |
 |
| Module-wise count rates for Quadrant C Data is divided into 100 sec bins |
 |
 |
| Module-wise count rates for Quadrant D Data is divided into 100 sec bins |
 |
 |
| Parameter | Plot |
|---|---|
| CZT HV Monitor | 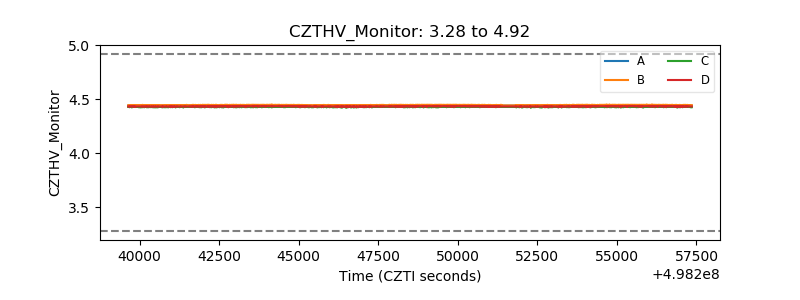 |
| D_VDD | 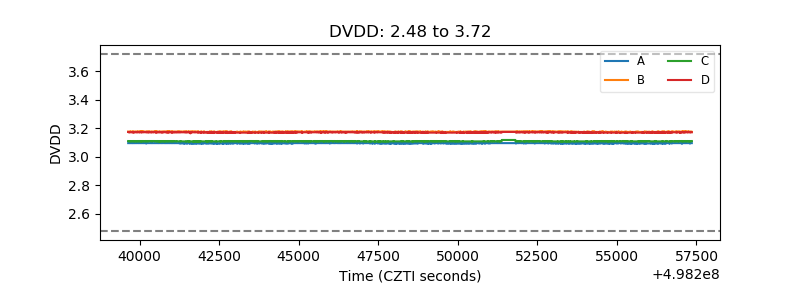 |
| Temperature 1 | 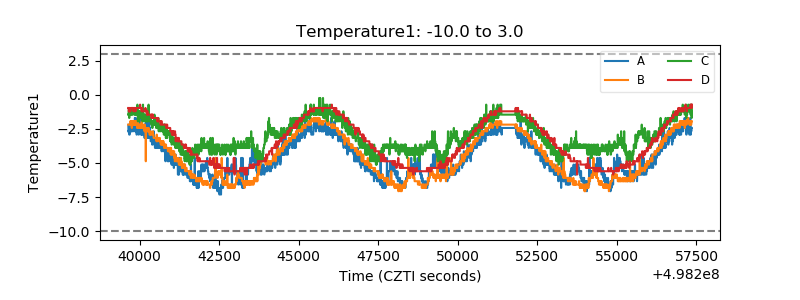 |
| Veto HV Monitor |  |
| Veto LLD | 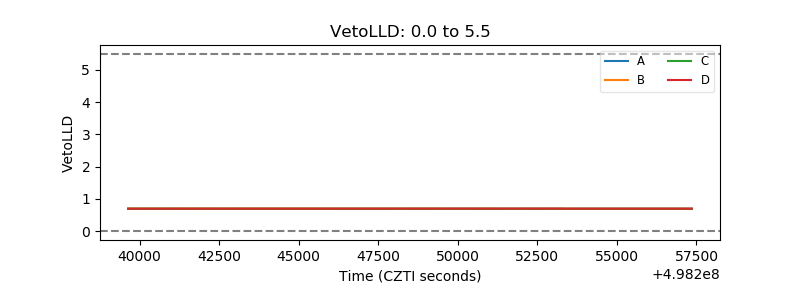 |
| Alpha Counter | 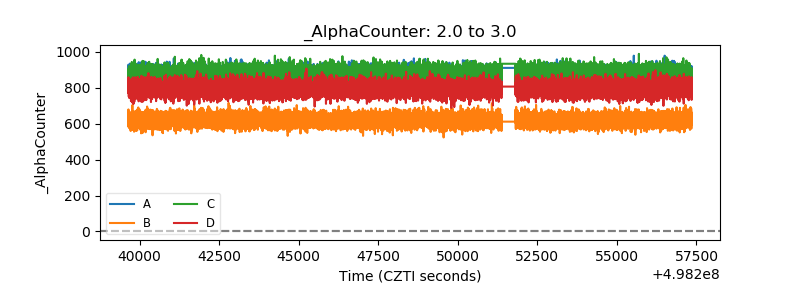 |
| _CPM_Rate | 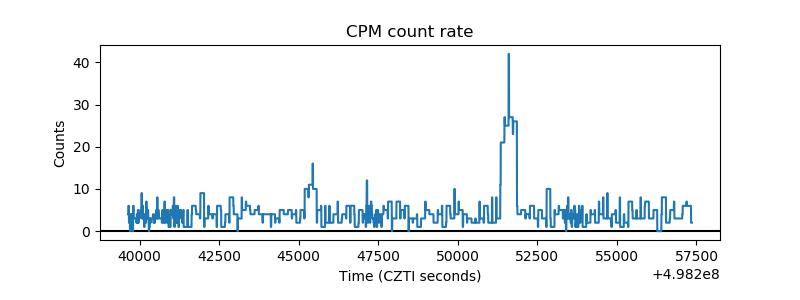 |
| CZT Counter | 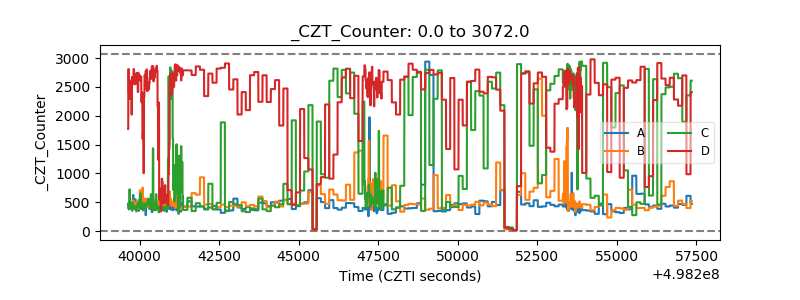 |
| +2.5 Volts monitor |  |
| +5 Volts monitor | 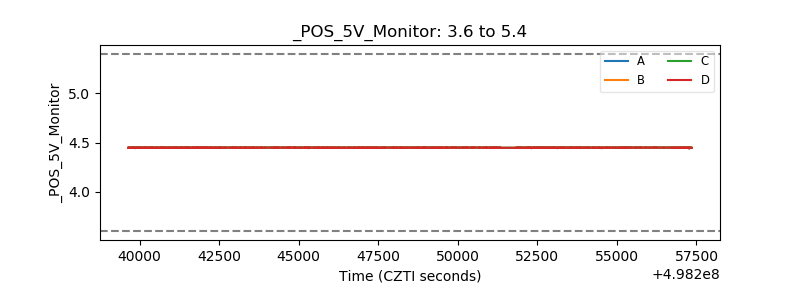 |
| _ROLL_ROT | 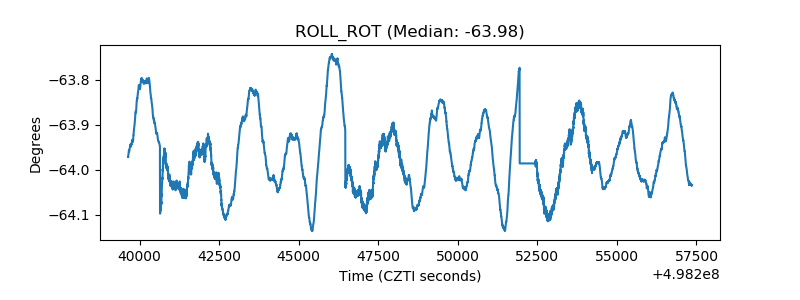 |
| _Roll_DEC | 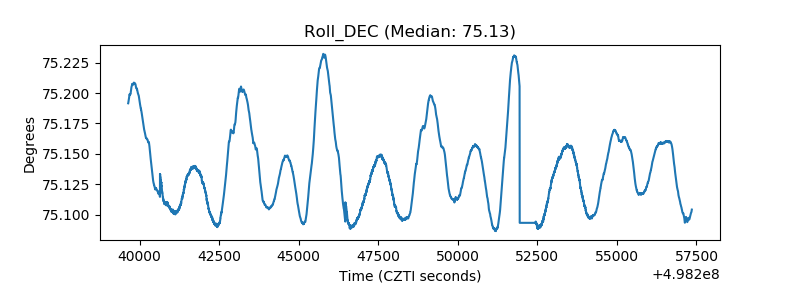 |
| _Roll_RA | 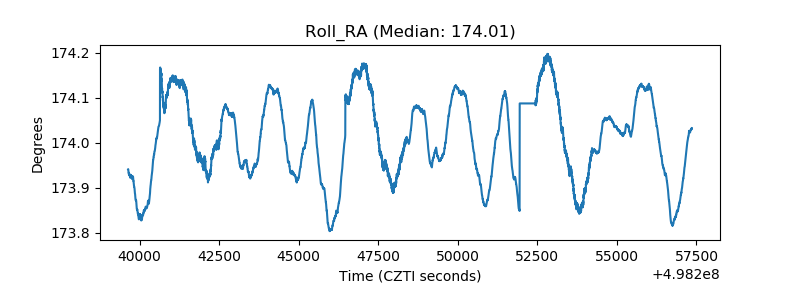 |
| Veto Counter | 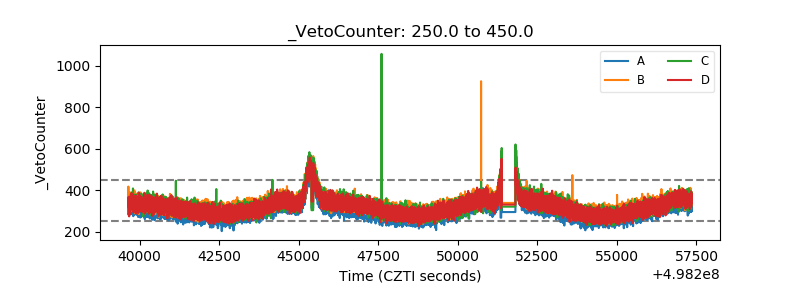 |