| Param | Original file | Final file |
|---|---|---|
| Filename | modeM0/AS1A14_126T15_9000006516_54368cztM0_level2.fits | modeM0/AS1A14_126T15_9000006516_54368cztM0_level2_quad_clean.evt |
| Size (bytes) | 747,299,520 | 81,633,600 |
| Size | 712.7 MB | 77.9 MB |
| Events in quadrant A | 3,251,727 | 614,918 |
| Events in quadrant B | 3,210,643 | 668,365 |
| Events in quadrant C | 6,436,647 | 518,525 |
| Events in quadrant D | 14,246,873 | 205,793 |
| Mode SS | |||
|---|---|---|---|
| Quadrant | BADHDUFLAG | Total packets | Discarded packets |
| A | 0 | 134 | 0 |
| B | 0 | 134 | 0 |
| C | 0 | 134 | 0 |
| D | 0 | 134 | 0 |
| Mode M0 | |||
|---|---|---|---|
| Quadrant | BADHDUFLAG | Total packets | Discarded packets |
| A | 0 | 14848 | 1 |
| B | 0 | 14351 | 2 |
| C | 0 | 23922 | 1 |
| D | 0 | 46848 | 1 |
| Mode M9 | |||
|---|---|---|---|
| Quadrant | BADHDUFLAG | Total packets | Discarded packets |
| A | 0 | 11 | 0 |
| B | 0 | 11 | 0 |
| C | 0 | 11 | 0 |
| D | 0 | 11 | 0 |
| Quadrant | Total seconds | Saturated seconds | Saturation percentage |
|---|---|---|---|
| A | 6657 | 177 | 2.658855% |
| B | 6657 | 61 | 0.916329% |
| C | 6657 | 1082 | 16.253568% |
| D | 6657 | 4489 | 67.432778% |
Noise dominated data is calculated using 1-second bins in cleaned event files. If a bin has >2000 counts, and if more than 50% of those come from <1% of pixels, then it is considered to be noise-dominated and hence unusable.
| Quadrant | # 1 sec bins | Bins with >0 counts | Bins with >2000 counts | High rate bins dominated by noise | Noise dominated (total time) | Noise dominated (detector-on time) | Marked lightcurve |
|---|---|---|---|---|---|---|---|
| A | 7662 | 6658 | 80 | 80 | 1.04% | 1.20% | 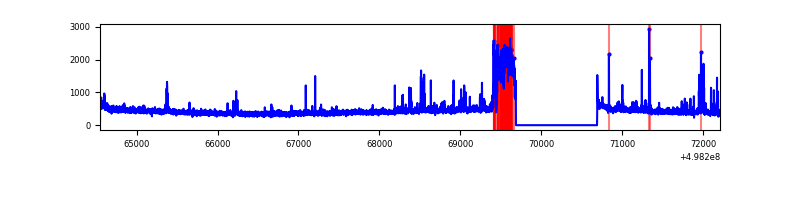 |
| B | 7662 | 6658 | 11 | 11 | 0.14% | 0.17% | 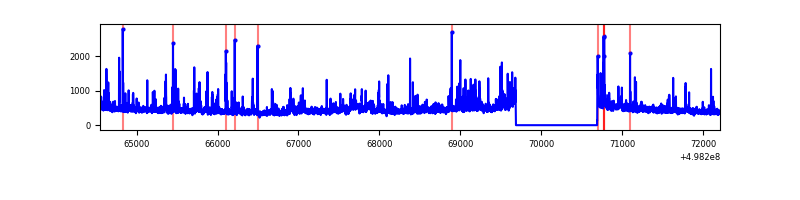 |
| C | 7662 | 6658 | 970 | 970 | 12.66% | 14.57% | 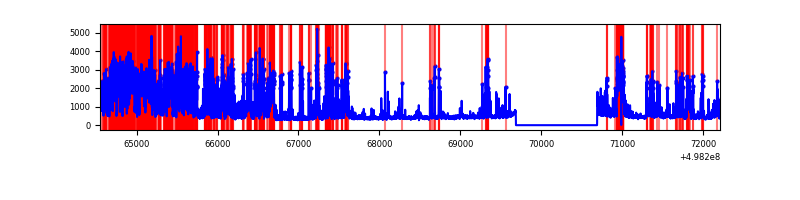 |
| D | 7662 | 6658 | 4234 | 4234 | 55.26% | 63.59% | 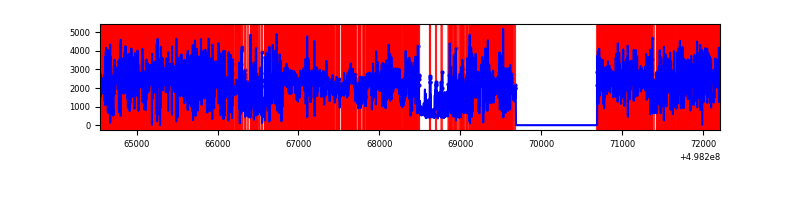 |
Top three noisy pixels from each quadrant. If the there are fewer than three noisy pixels in the level2.evt file, extra rows are filled as -1
| Pixel properties | Quadrant properties | ||||||
|---|---|---|---|---|---|---|---|
| Quadrant | DetID | PixID | Counts | Sigma | Mean | Median | Sigma |
| A | 15 | 174 | 365629 | 2152.28 | 688 | 671 | 169.6 |
| A | 8 | 246 | 36507 | 211.34 | 688 | 671 | 169.6 |
| A | 12 | 17 | 36159 | 209.28 | 688 | 671 | 169.6 |
| B | 0 | 171 | 86282 | 582.71 | 687 | 663 | 146.9 |
| B | 5 | 172 | 79258 | 534.91 | 687 | 663 | 146.9 |
| B | 0 | 63 | 78991 | 533.09 | 687 | 663 | 146.9 |
| C | 2 | 255 | 1376977 | 8017.18 | 625 | 620 | 171.7 |
| C | 1 | 241 | 1164534 | 6779.72 | 625 | 620 | 171.7 |
| C | 1 | 29 | 771177 | 4488.44 | 625 | 620 | 171.7 |
| D | 8 | 176 | 12096067 | 99194.28 | 425 | 405 | 121.9 |
| D | 3 | 12 | 238079 | 1949.12 | 425 | 405 | 121.9 |
| D | 12 | 3 | 106173 | 867.38 | 425 | 405 | 121.9 |
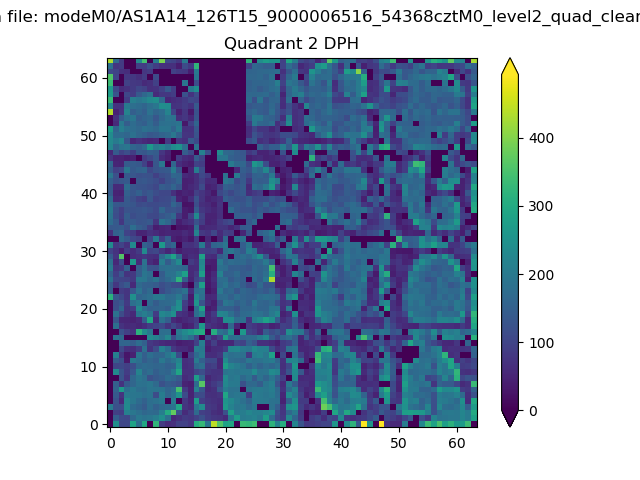
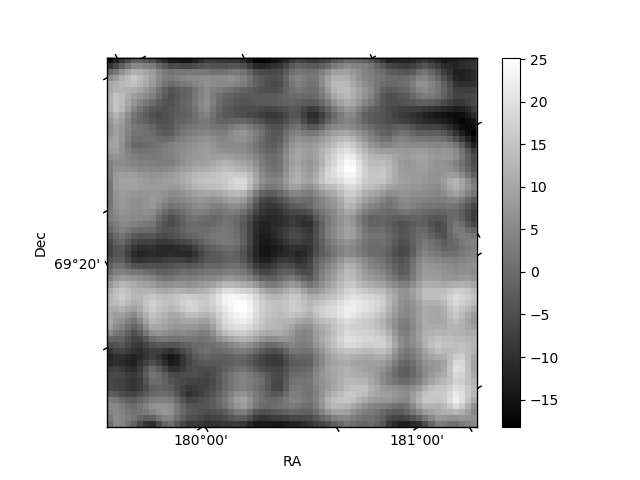
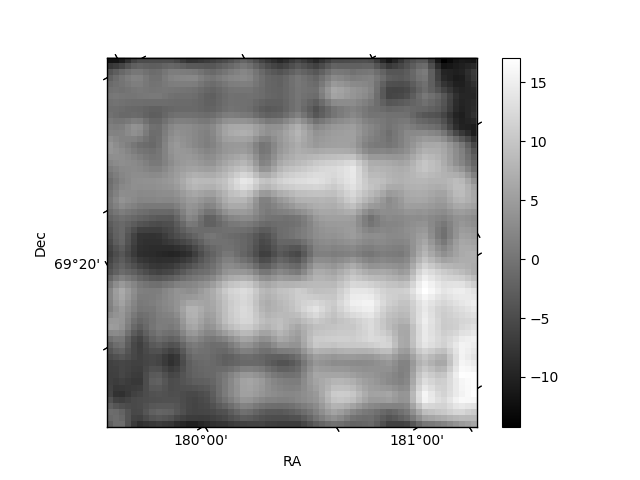
Histogram calculated using DETX and DETY for each event in the final _common_clean file
| Quadrant A | 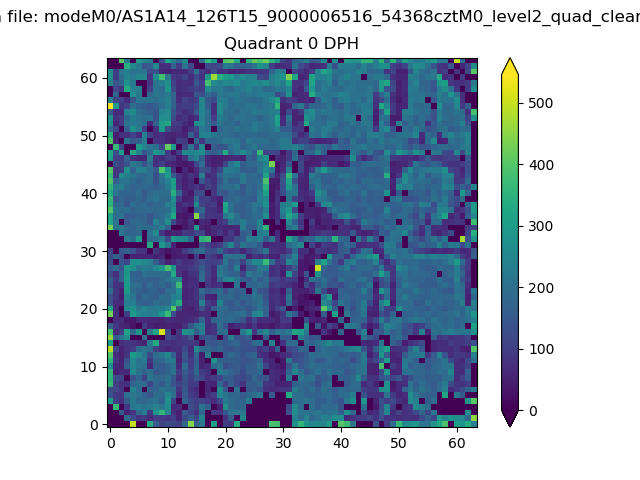 |
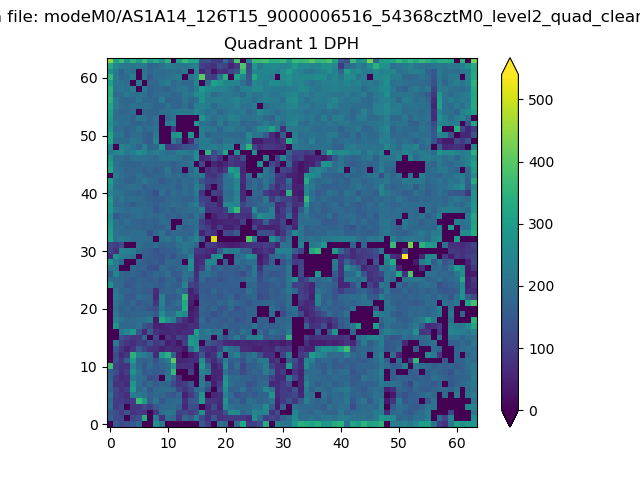 |
Quadrant B |
|---|---|---|---|
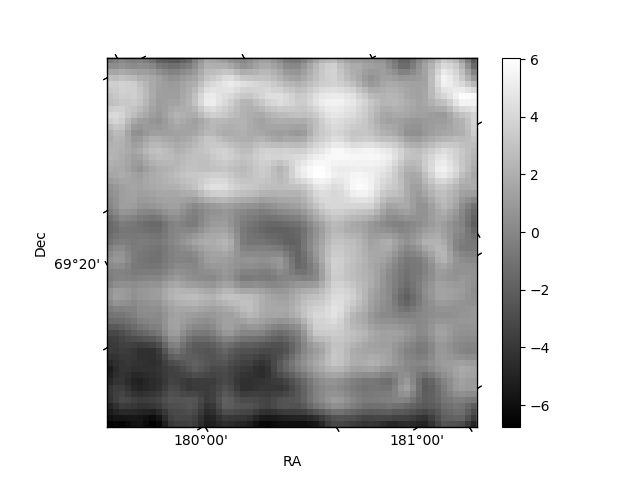
| Quadrant D | 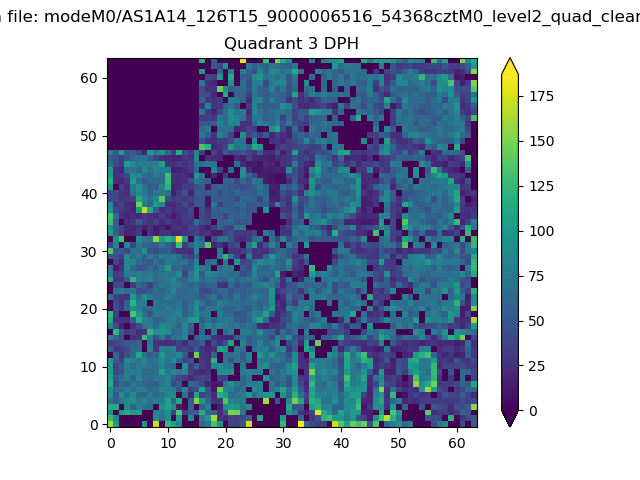 |
 |
Quadrant C |
| Plot type | Count rate plots | Images |
|---|---|---|
| Comparison with Poisson distribution Blue bars denote a histogram of data divided into 1 sec bins. Red curve is a Poisson curve with rate = median count rate of data. |
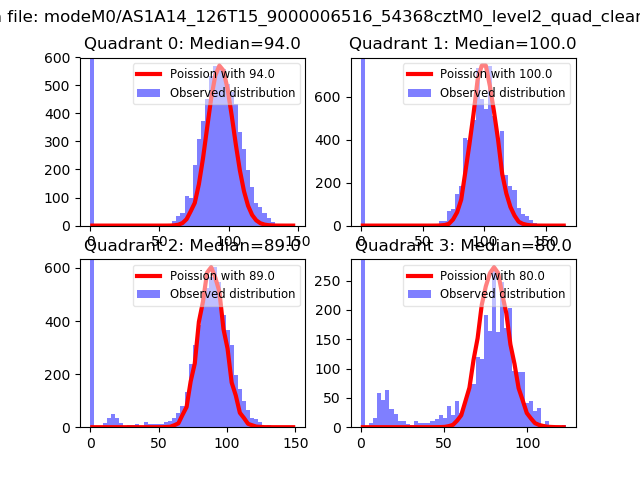 |
 |
| Quadrant-wise count rates Data is divided into 100 sec bins |
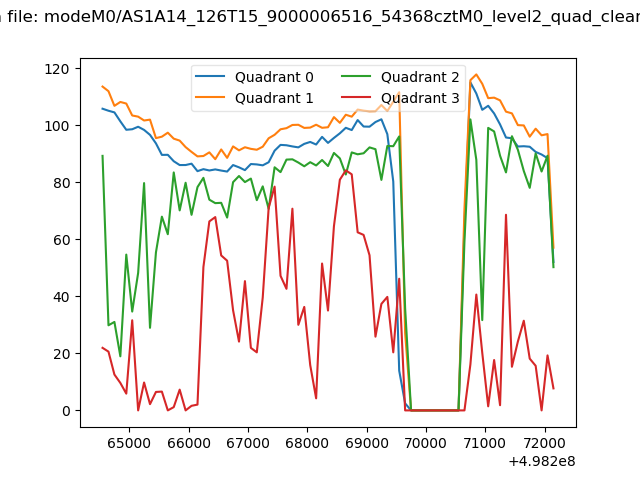 |
|
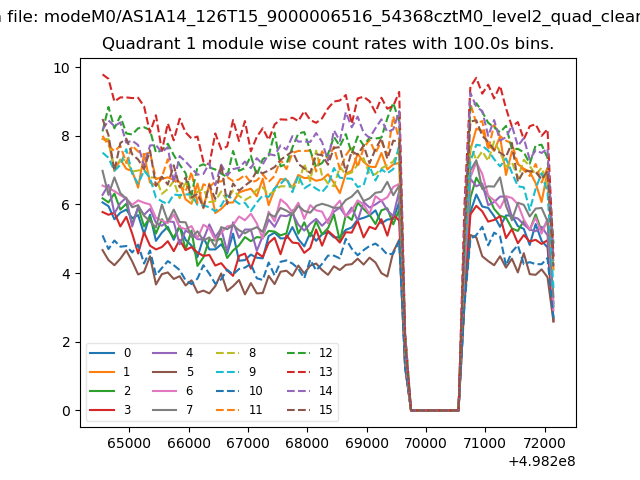
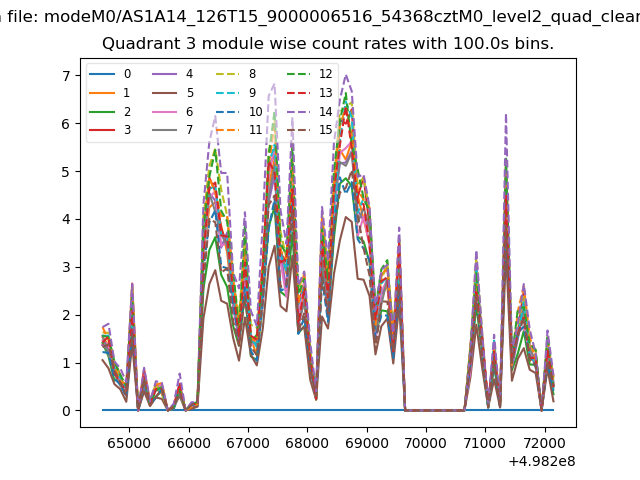
| Module-wise count rates for Quadrant A Data is divided into 100 sec bins |
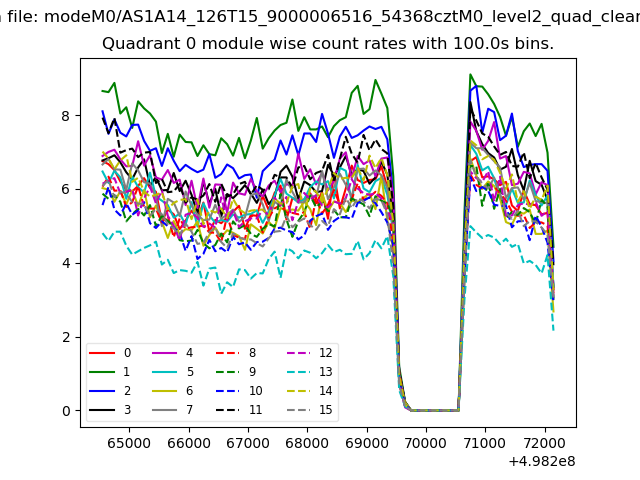 |
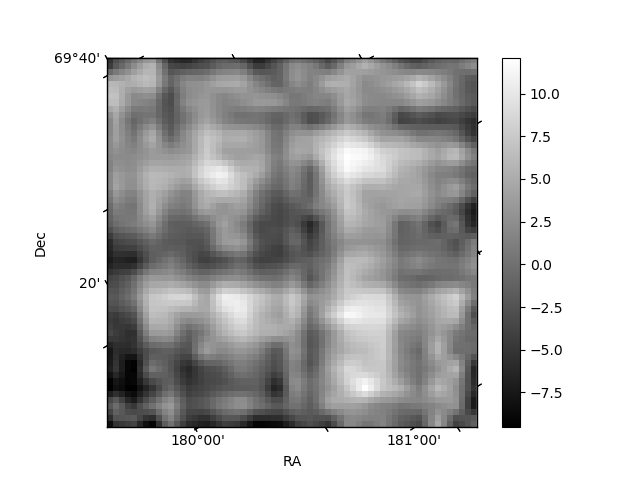 |
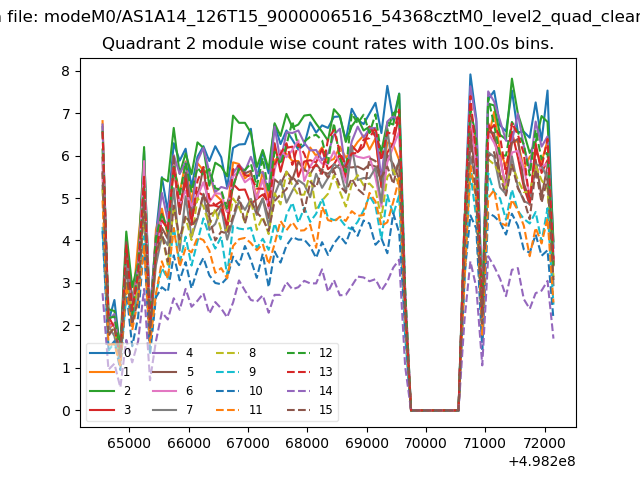
| Module-wise count rates for Quadrant B Data is divided into 100 sec bins |
 |
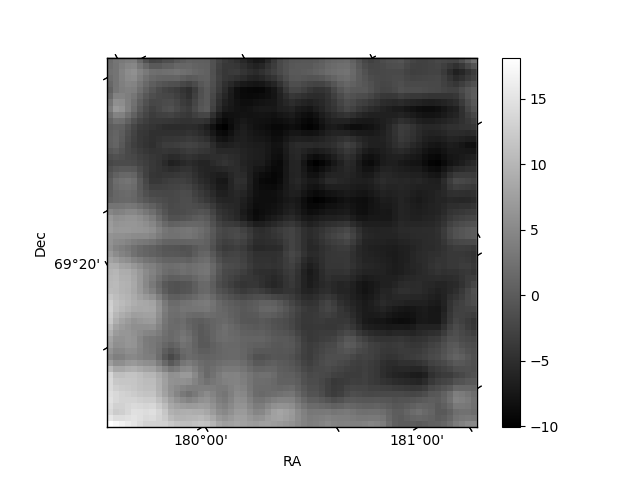 |
| Module-wise count rates for Quadrant C Data is divided into 100 sec bins |
 |
 |
| Module-wise count rates for Quadrant D Data is divided into 100 sec bins |
 |
 |
| Parameter | Plot |
|---|---|
| CZT HV Monitor | 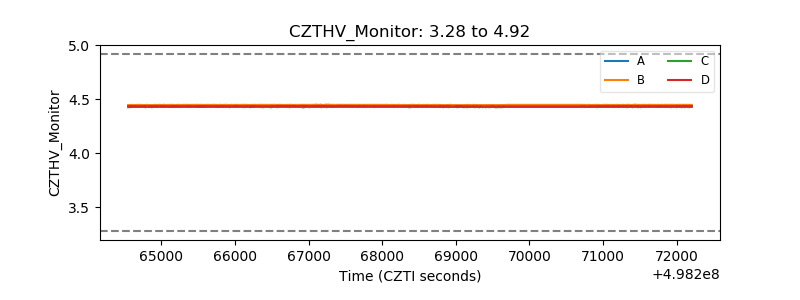 |
| D_VDD | 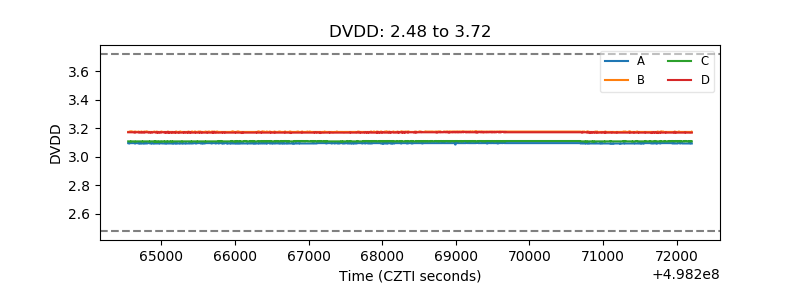 |
| Temperature 1 | 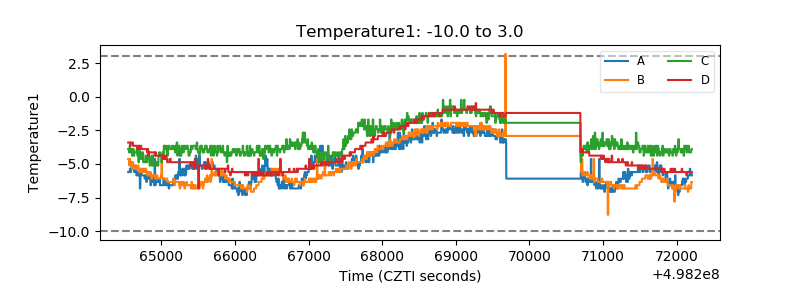 |
| Veto HV Monitor |  |
| Veto LLD | 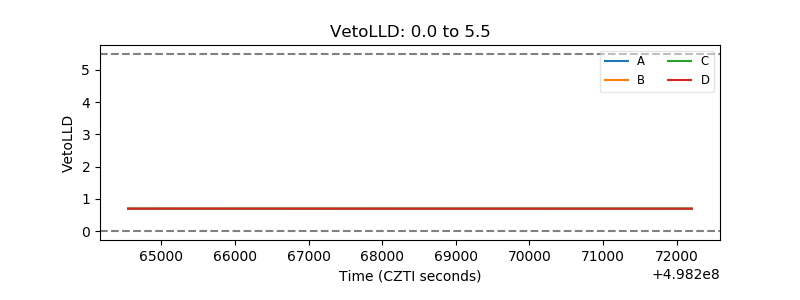 |
| Alpha Counter | 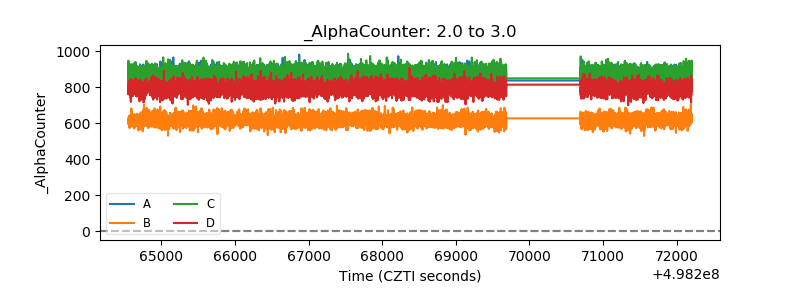 |
| _CPM_Rate | 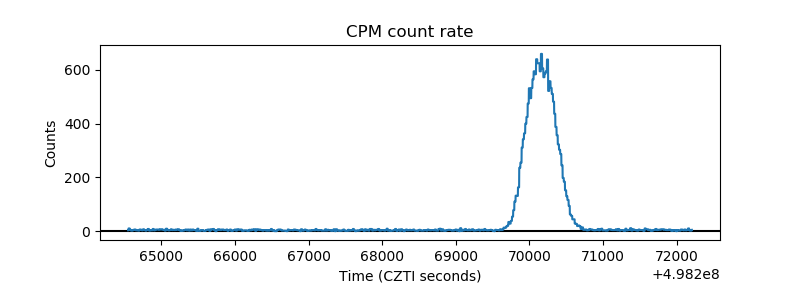 |
| CZT Counter | 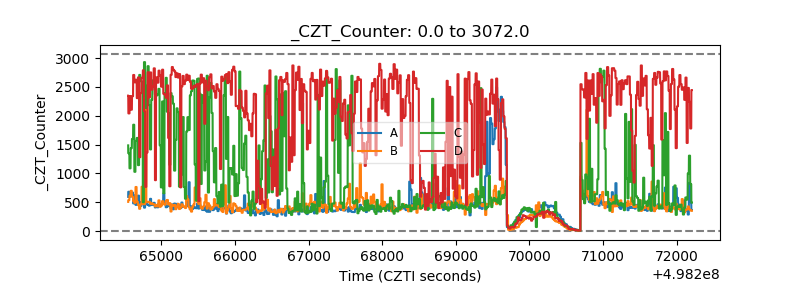 |
| +2.5 Volts monitor |  |
| +5 Volts monitor | 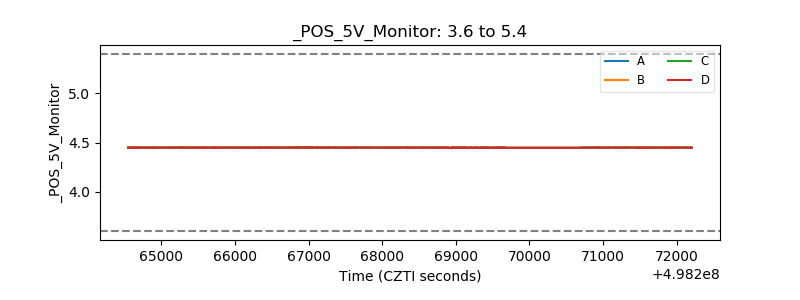 |
| _ROLL_ROT | 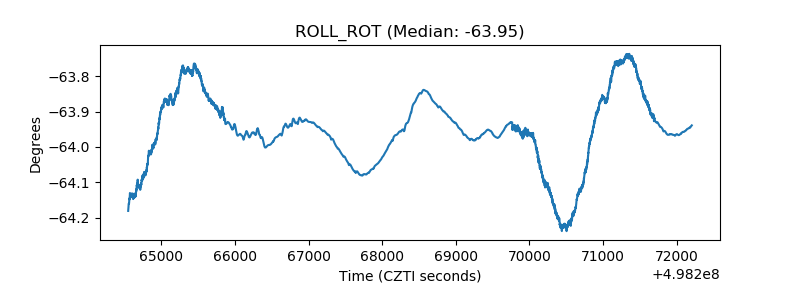 |
| _Roll_DEC | 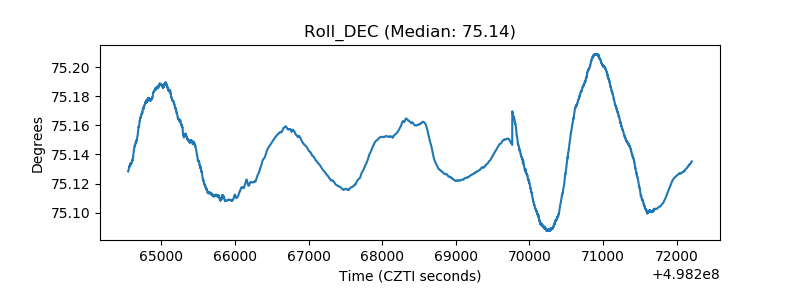 |
| _Roll_RA | 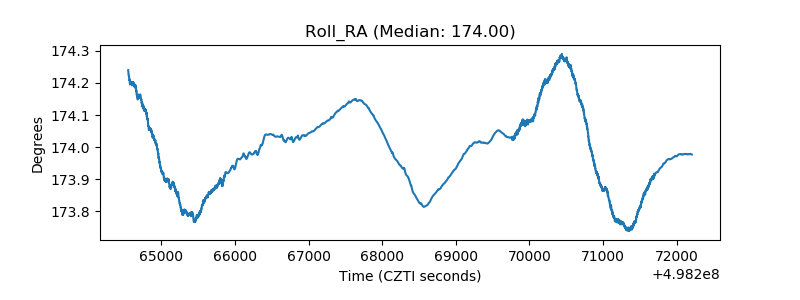 |
| Veto Counter | 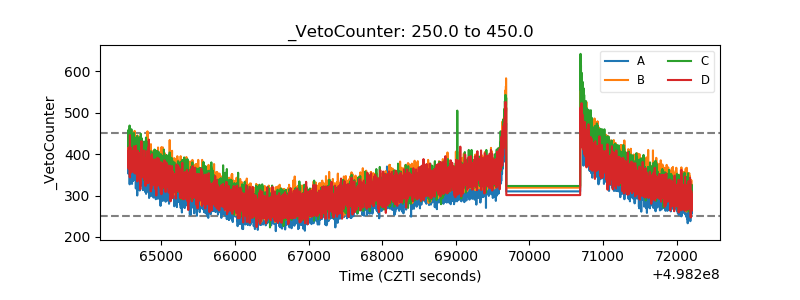 |