| Param | Original file | Final file |
|---|---|---|
| Filename | modeM0/AS1A14_126T15_9000006516_54369cztM0_level2.fits | modeM0/AS1A14_126T15_9000006516_54369cztM0_level2_quad_clean.evt |
| Size (bytes) | 675,216,000 | 80,392,320 |
| Size | 643.9 MB | 76.7 MB |
| Events in quadrant A | 3,826,063 | 580,852 |
| Events in quadrant B | 3,442,730 | 631,671 |
| Events in quadrant C | 7,353,878 | 435,607 |
| Events in quadrant D | 9,885,873 | 349,226 |
| Mode SS | |||
|---|---|---|---|
| Quadrant | BADHDUFLAG | Total packets | Discarded packets |
| A | 0 | 126 | 0 |
| B | 0 | 126 | 0 |
| C | 0 | 126 | 0 |
| D | 0 | 126 | 0 |
| Mode M0 | |||
|---|---|---|---|
| Quadrant | BADHDUFLAG | Total packets | Discarded packets |
| A | 0 | 16019 | 1 |
| B | 0 | 14967 | 1 |
| C | 0 | 26333 | 1 |
| D | 0 | 33731 | 1 |
| Mode M9 | |||
|---|---|---|---|
| Quadrant | BADHDUFLAG | Total packets | Discarded packets |
| A | 0 | 11 | 0 |
| B | 0 | 11 | 0 |
| C | 0 | 11 | 0 |
| D | 0 | 11 | 0 |
| Quadrant | Total seconds | Saturated seconds | Saturation percentage |
|---|---|---|---|
| A | 6260 | 339 | 5.415335% |
| B | 6260 | 207 | 3.306709% |
| C | 6261 | 1644 | 26.257786% |
| D | 6261 | 2414 | 38.556141% |
Noise dominated data is calculated using 1-second bins in cleaned event files. If a bin has >2000 counts, and if more than 50% of those come from <1% of pixels, then it is considered to be noise-dominated and hence unusable.
| Quadrant | # 1 sec bins | Bins with >0 counts | Bins with >2000 counts | High rate bins dominated by noise | Noise dominated (total time) | Noise dominated (detector-on time) | Marked lightcurve |
|---|---|---|---|---|---|---|---|
| A | 7360 | 6261 | 266 | 266 | 3.61% | 4.25% | 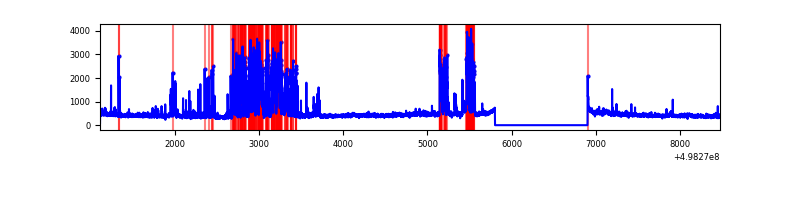 |
| B | 7360 | 6261 | 114 | 114 | 1.55% | 1.82% | 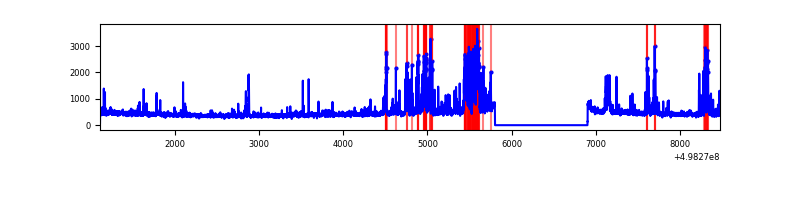 |
| C | 7361 | 6262 | 1580 | 1580 | 21.46% | 25.23% | 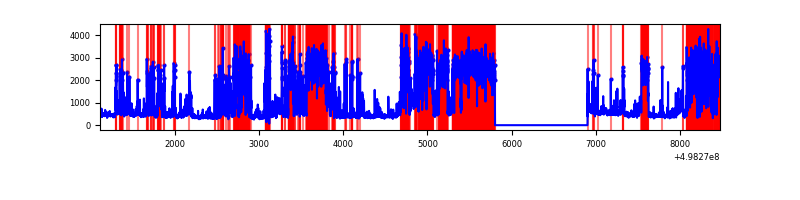 |
| D | 7361 | 6262 | 2303 | 2303 | 31.29% | 36.78% | 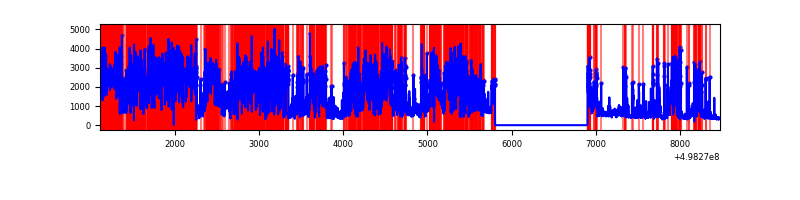 |
Top three noisy pixels from each quadrant. If the there are fewer than three noisy pixels in the level2.evt file, extra rows are filled as -1
| Pixel properties | Quadrant properties | ||||||
|---|---|---|---|---|---|---|---|
| Quadrant | DetID | PixID | Counts | Sigma | Mean | Median | Sigma |
| A | 12 | 17 | 847949 | 5326.03 | 639 | 622 | 159.1 |
| A | 15 | 174 | 287326 | 1802.13 | 639 | 622 | 159.1 |
| A | 12 | 194 | 105160 | 657.09 | 639 | 622 | 159.1 |
| B | 10 | 14 | 648424 | 4697.06 | 641 | 619 | 137.9 |
| B | 5 | 185 | 50427 | 361.14 | 641 | 619 | 137.9 |
| B | 2 | 249 | 45375 | 324.51 | 641 | 619 | 137.9 |
| C | 1 | 241 | 3844861 | 25487.03 | 542 | 537 | 150.8 |
| C | 1 | 29 | 674695 | 4469.52 | 542 | 537 | 150.8 |
| C | 12 | 2 | 220716 | 1459.74 | 542 | 537 | 150.8 |
| D | 8 | 176 | 7582786 | 51297.77 | 515 | 490 | 147.8 |
| D | 2 | 252 | 67347 | 452.32 | 515 | 490 | 147.8 |
| D | 12 | 3 | 66450 | 446.25 | 515 | 490 | 147.8 |
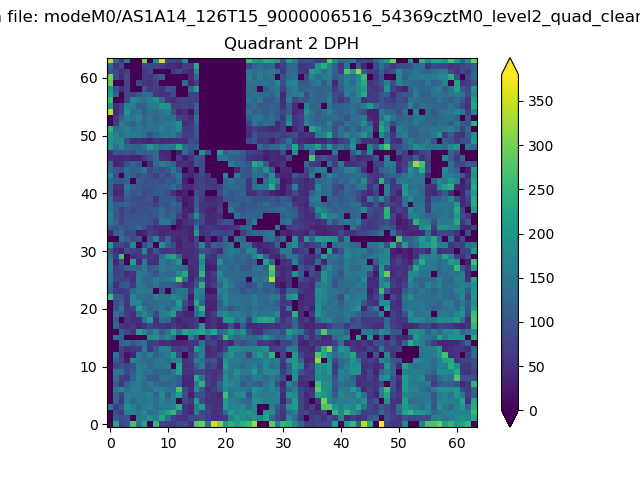
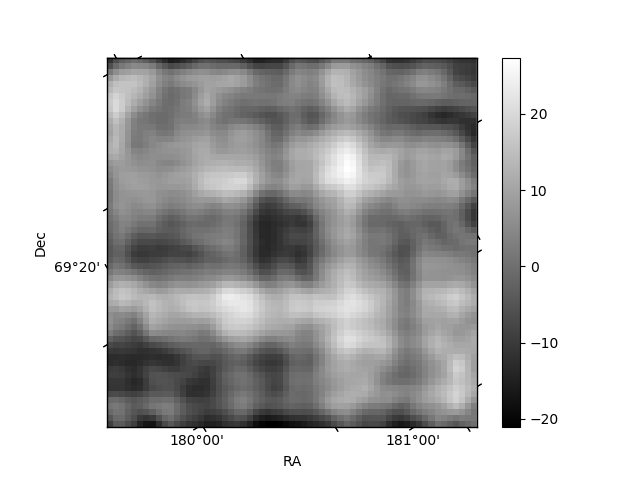
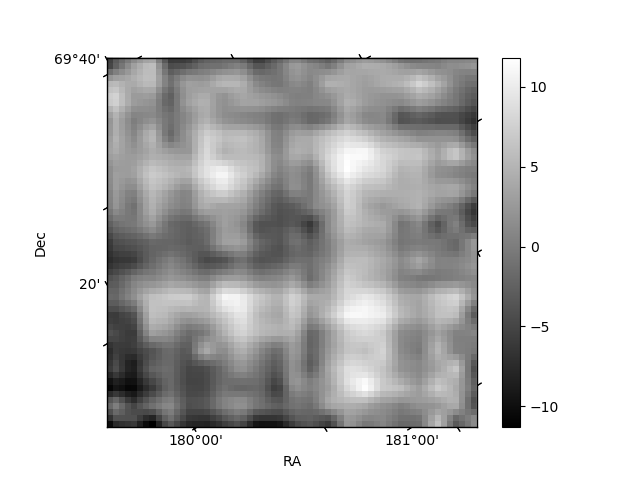
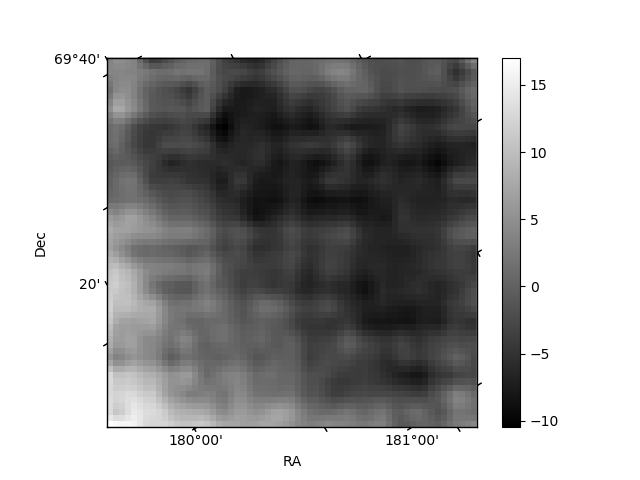
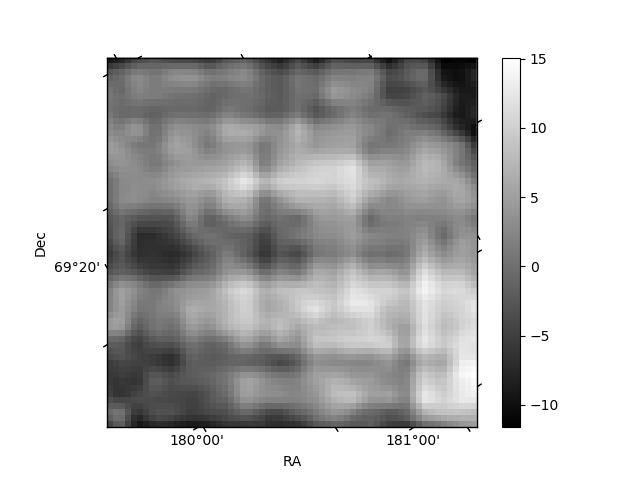
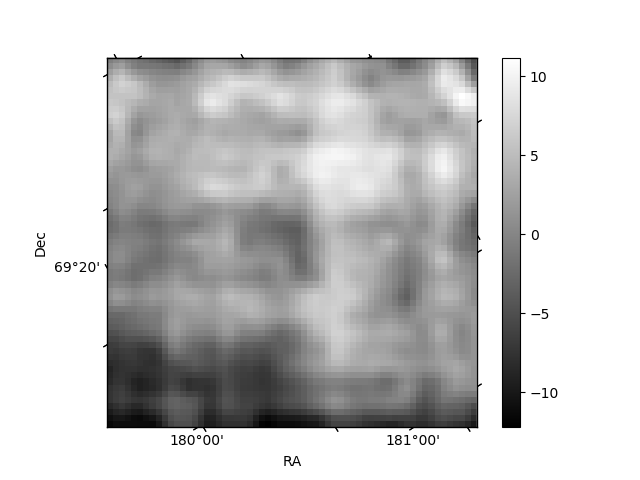
Histogram calculated using DETX and DETY for each event in the final _common_clean file
| Quadrant A | 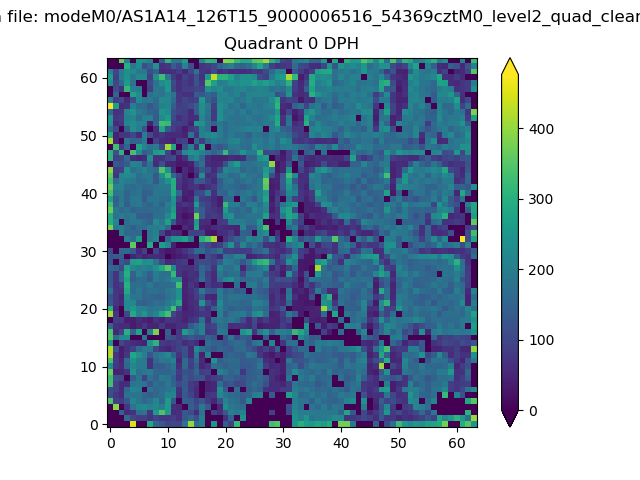 |
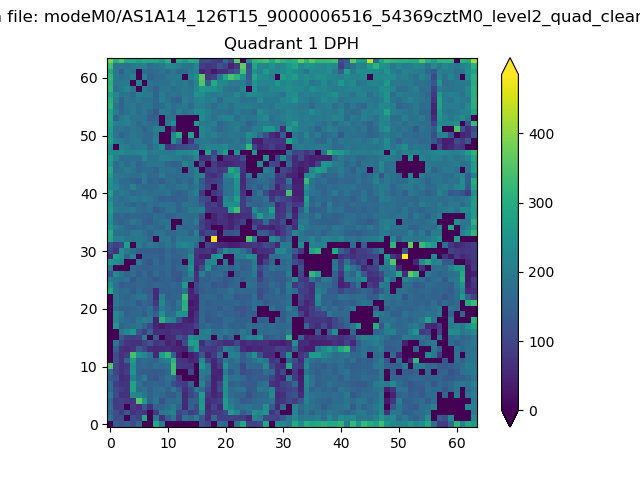 |
Quadrant B |
|---|---|---|---|
| Quadrant D | 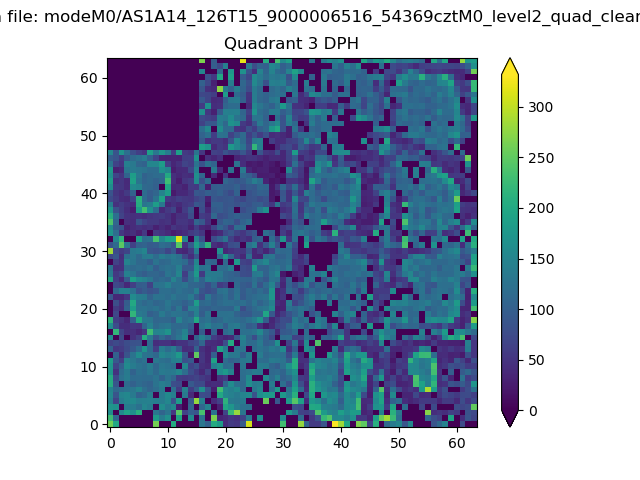 |
 |
Quadrant C |
| Plot type | Count rate plots | Images |
|---|---|---|
| Comparison with Poisson distribution Blue bars denote a histogram of data divided into 1 sec bins. Red curve is a Poisson curve with rate = median count rate of data. |
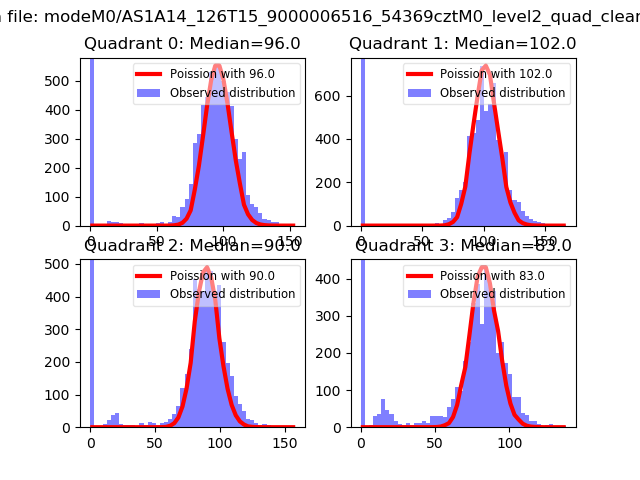 |
 |
| Quadrant-wise count rates Data is divided into 100 sec bins |
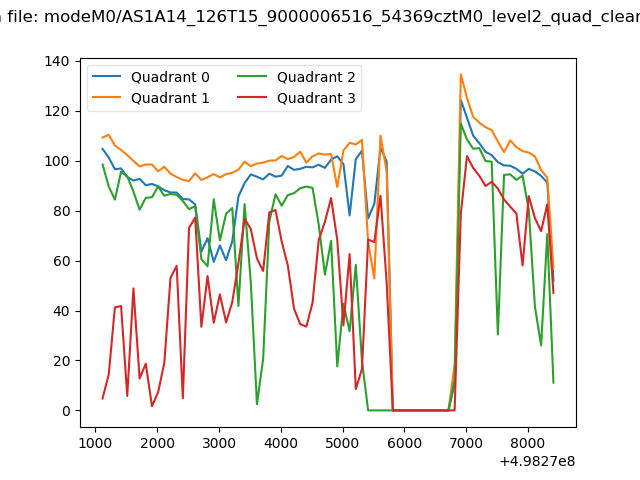 |
|
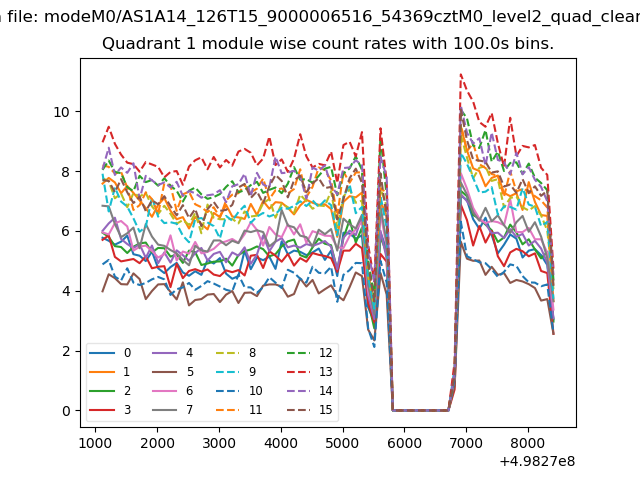
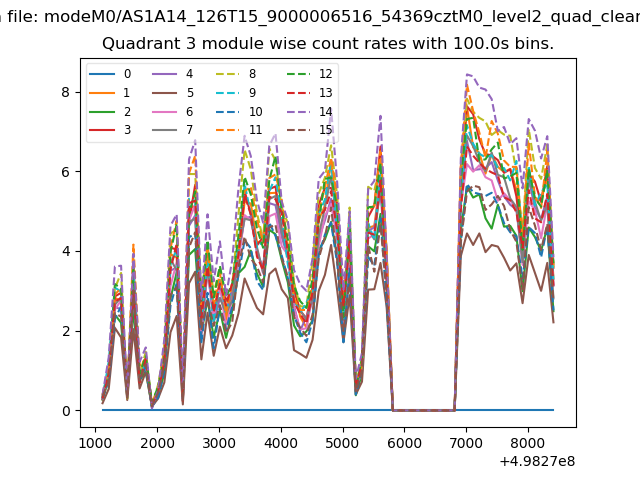
| Module-wise count rates for Quadrant A Data is divided into 100 sec bins |
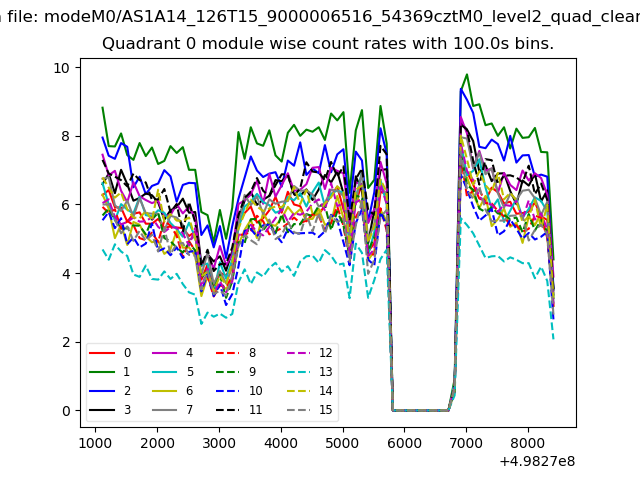 |
 |
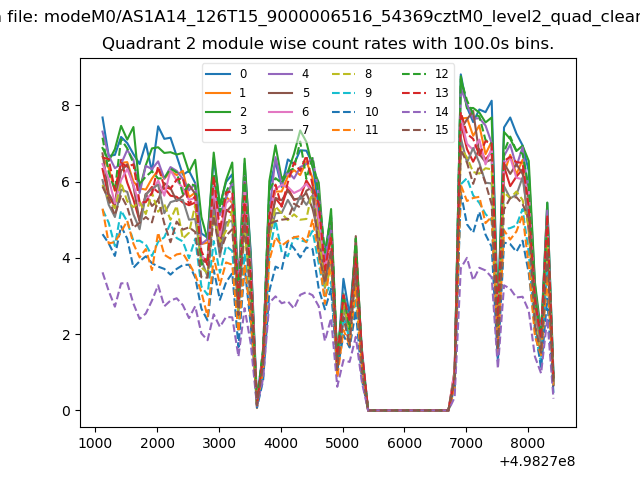
| Module-wise count rates for Quadrant B Data is divided into 100 sec bins |
 |
 |
| Module-wise count rates for Quadrant C Data is divided into 100 sec bins |
 |
 |
| Module-wise count rates for Quadrant D Data is divided into 100 sec bins |
 |
 |
| Parameter | Plot |
|---|---|
| CZT HV Monitor | 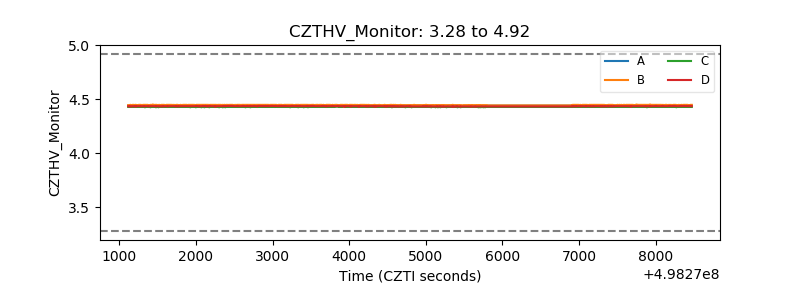 |
| D_VDD | 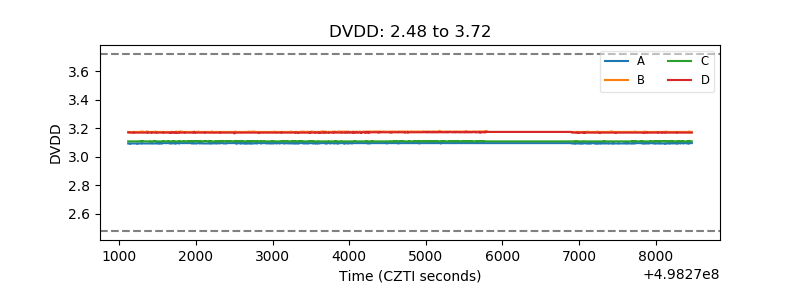 |
| Temperature 1 | 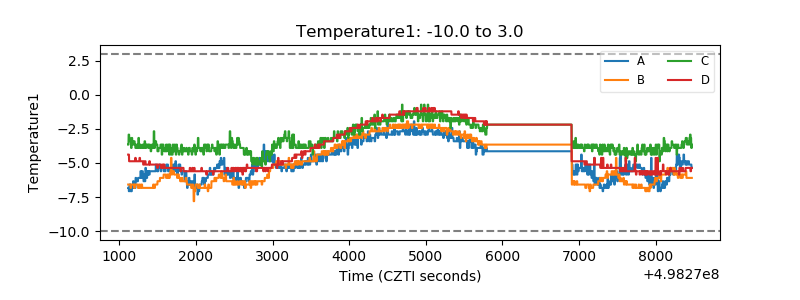 |
| Veto HV Monitor | 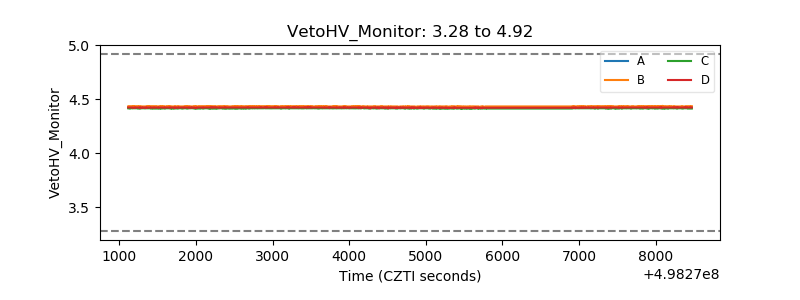 |
| Veto LLD | 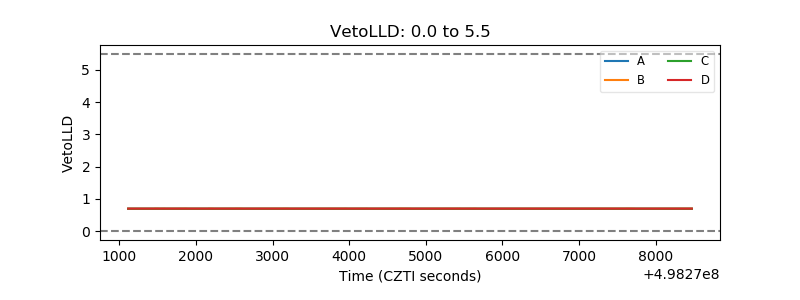 |
| Alpha Counter | 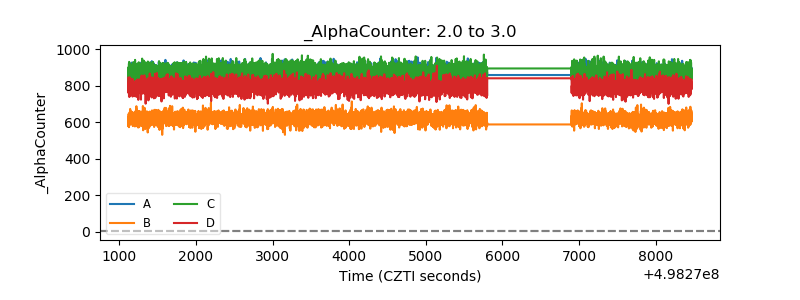 |
| _CPM_Rate | 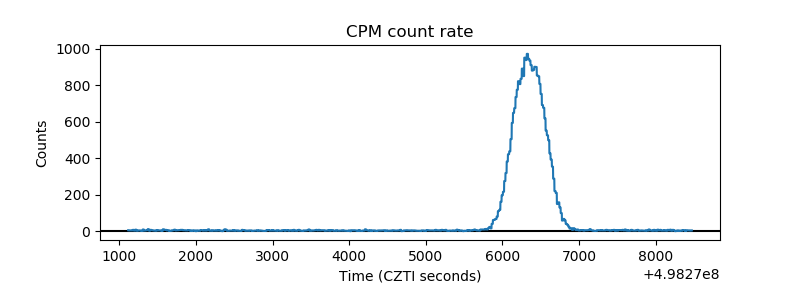 |
| CZT Counter | 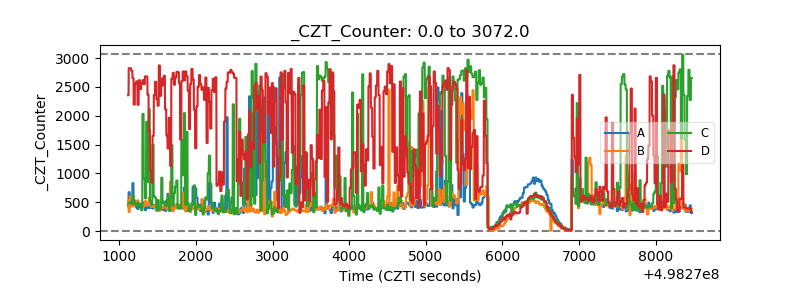 |
| +2.5 Volts monitor |  |
| +5 Volts monitor |  |
| _ROLL_ROT | 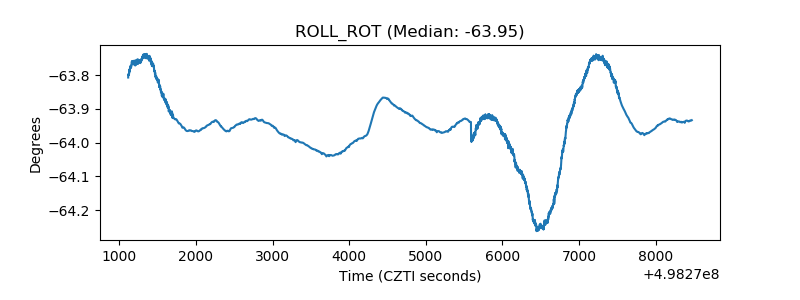 |
| _Roll_DEC | 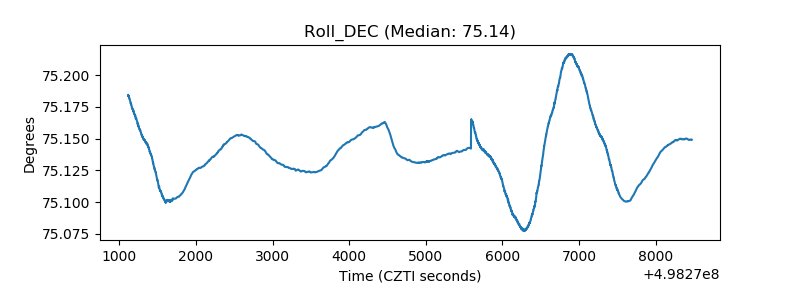 |
| _Roll_RA | 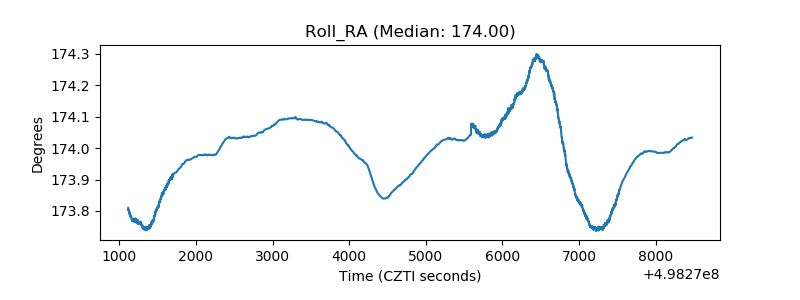 |
| Veto Counter | 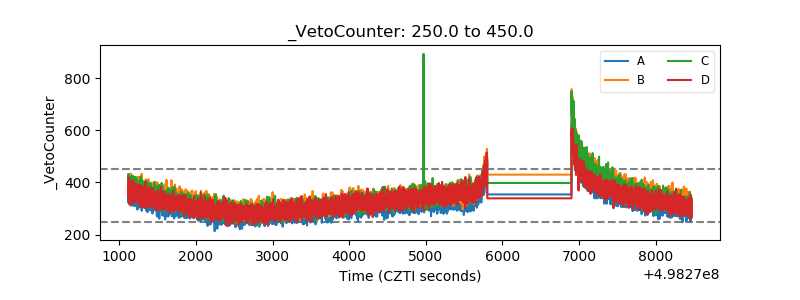 |