| Param | Original file | Final file |
|---|---|---|
| Filename | modeM0/AS1A14_126T15_9000006516_54370cztM0_level2.fits | modeM0/AS1A14_126T15_9000006516_54370cztM0_level2_quad_clean.evt |
| Size (bytes) | 581,299,200 | 76,824,000 |
| Size | 554.4 MB | 73.3 MB |
| Events in quadrant A | 2,617,980 | 563,599 |
| Events in quadrant B | 3,715,036 | 568,221 |
| Events in quadrant C | 6,438,722 | 429,256 |
| Events in quadrant D | 8,300,282 | 363,943 |
| Mode SS | |||
|---|---|---|---|
| Quadrant | BADHDUFLAG | Total packets | Discarded packets |
| A | 0 | 116 | 0 |
| B | 0 | 116 | 0 |
| C | 0 | 116 | 0 |
| D | 0 | 116 | 0 |
| Mode M0 | |||
|---|---|---|---|
| Quadrant | BADHDUFLAG | Total packets | Discarded packets |
| A | 0 | 12165 | 2 |
| B | 0 | 15150 | 1 |
| C | 0 | 23177 | 1 |
| D | 0 | 28738 | 1 |
| Mode M9 | |||
|---|---|---|---|
| Quadrant | BADHDUFLAG | Total packets | Discarded packets |
| A | 0 | 12 | 0 |
| B | 0 | 12 | 0 |
| C | 0 | 12 | 0 |
| D | 0 | 12 | 0 |
| Quadrant | Total seconds | Saturated seconds | Saturation percentage |
|---|---|---|---|
| A | 5739 | 29 | 0.505315% |
| B | 5740 | 419 | 7.299652% |
| C | 5740 | 1295 | 22.560976% |
| D | 5740 | 1736 | 30.243902% |
Noise dominated data is calculated using 1-second bins in cleaned event files. If a bin has >2000 counts, and if more than 50% of those come from <1% of pixels, then it is considered to be noise-dominated and hence unusable.
| Quadrant | # 1 sec bins | Bins with >0 counts | Bins with >2000 counts | High rate bins dominated by noise | Noise dominated (total time) | Noise dominated (detector-on time) | Marked lightcurve |
|---|---|---|---|---|---|---|---|
| A | 6909 | 5740 | 12 | 12 | 0.17% | 0.21% | 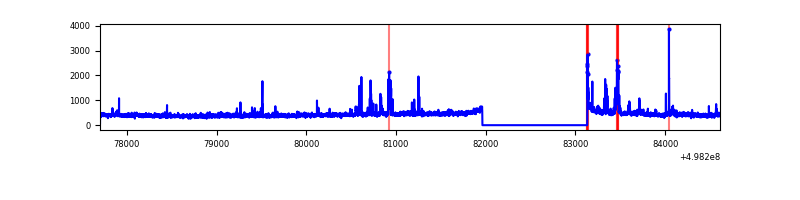 |
| B | 6910 | 5741 | 259 | 259 | 3.75% | 4.51% | 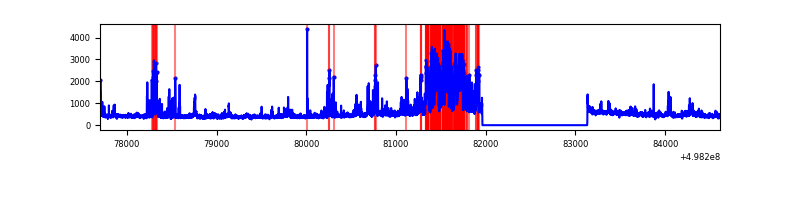 |
| C | 6910 | 5741 | 1169 | 1169 | 16.92% | 20.36% | 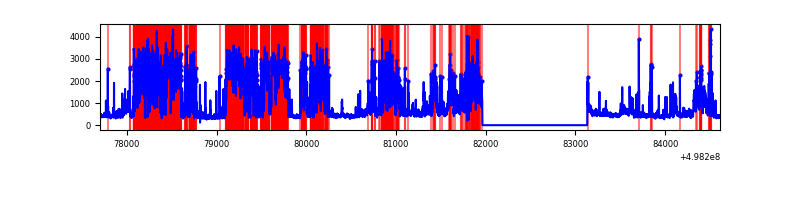 |
| D | 6910 | 5741 | 1671 | 1671 | 24.18% | 29.11% | 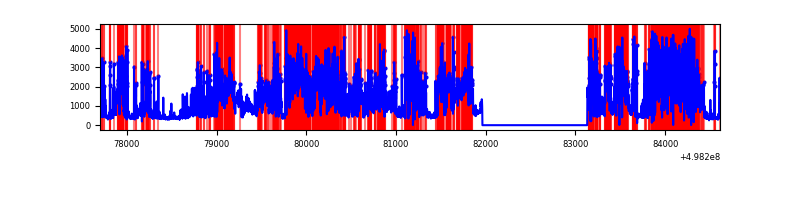 |
Top three noisy pixels from each quadrant. If the there are fewer than three noisy pixels in the level2.evt file, extra rows are filled as -1
| Pixel properties | Quadrant properties | ||||||
|---|---|---|---|---|---|---|---|
| Quadrant | DetID | PixID | Counts | Sigma | Mean | Median | Sigma |
| A | 12 | 115 | 103891 | 694.62 | 601 | 585 | 148.7 |
| A | 0 | 8 | 47356 | 314.48 | 601 | 585 | 148.7 |
| A | 3 | 14 | 47165 | 313.2 | 601 | 585 | 148.7 |
| B | 10 | 14 | 1026933 | 8396.88 | 577 | 559 | 122.2 |
| B | 7 | 0 | 167179 | 1363.14 | 577 | 559 | 122.2 |
| B | 10 | 247 | 82042 | 666.62 | 577 | 559 | 122.2 |
| C | 1 | 241 | 2444392 | 16877.42 | 523 | 519 | 144.8 |
| C | 1 | 29 | 1316391 | 9087.43 | 523 | 519 | 144.8 |
| C | 14 | 254 | 179499 | 1236.04 | 523 | 519 | 144.8 |
| D | 8 | 176 | 5961012 | 42144.41 | 489 | 465 | 141.4 |
| D | 3 | 144 | 209364 | 1477.03 | 489 | 465 | 141.4 |
| D | 10 | 181 | 62119 | 435.93 | 489 | 465 | 141.4 |
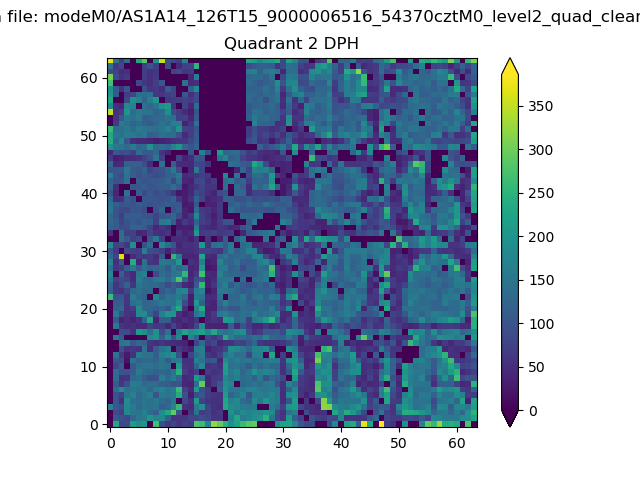
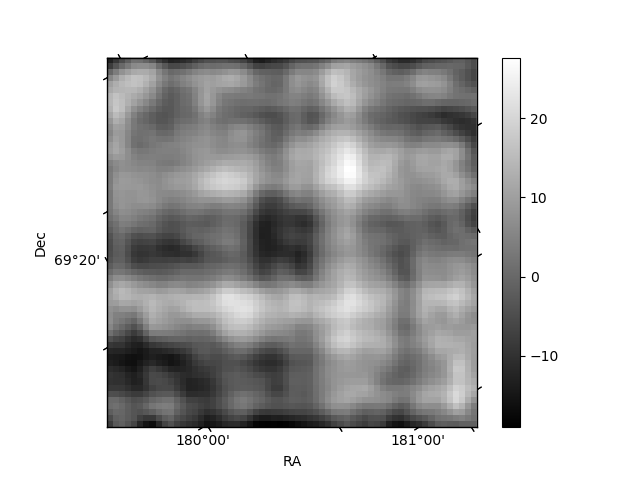
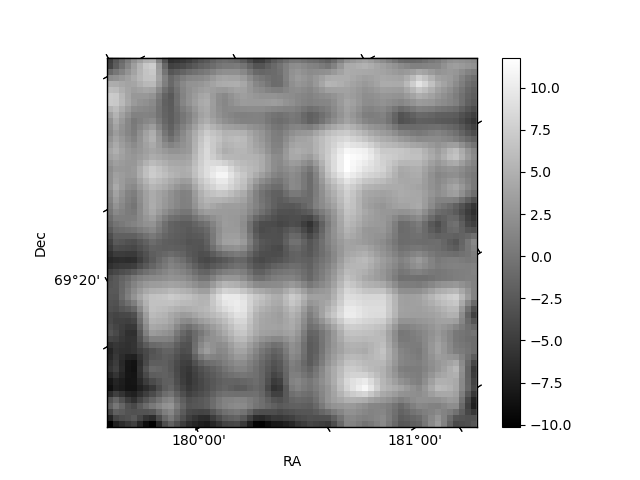
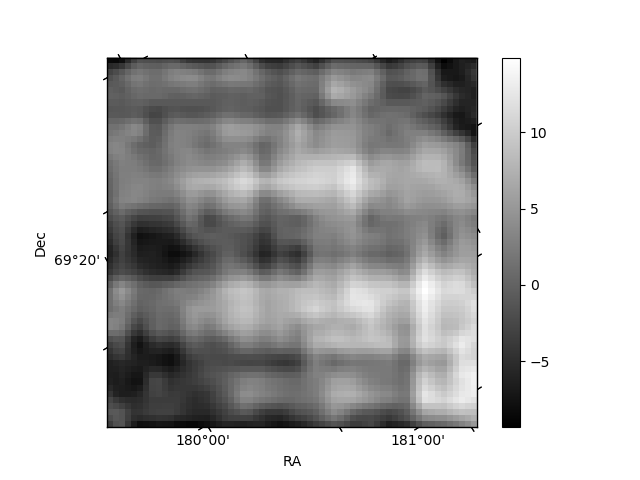
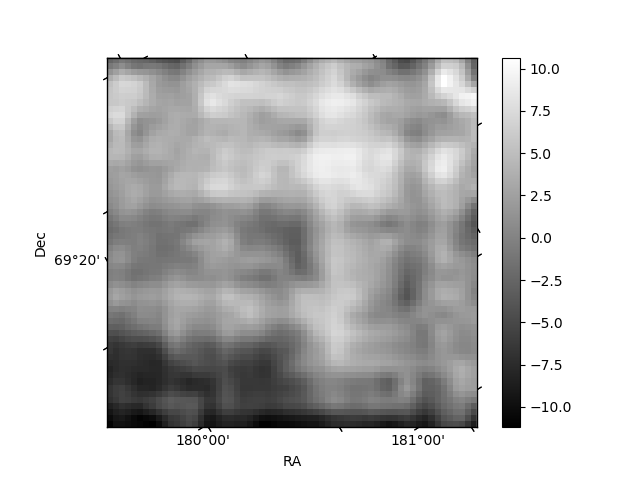
Histogram calculated using DETX and DETY for each event in the final _common_clean file
| Quadrant A | 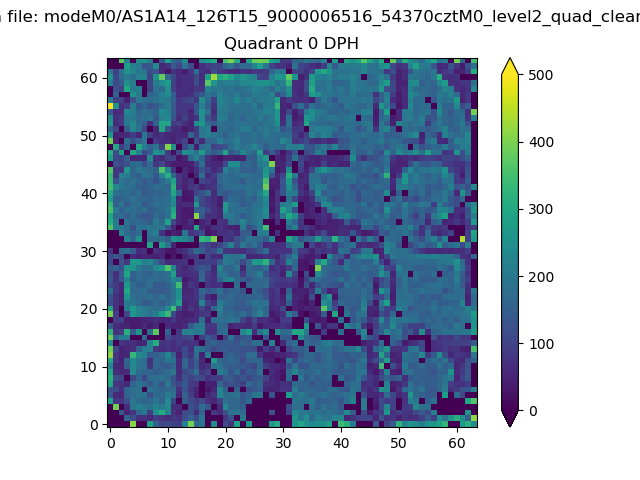 |
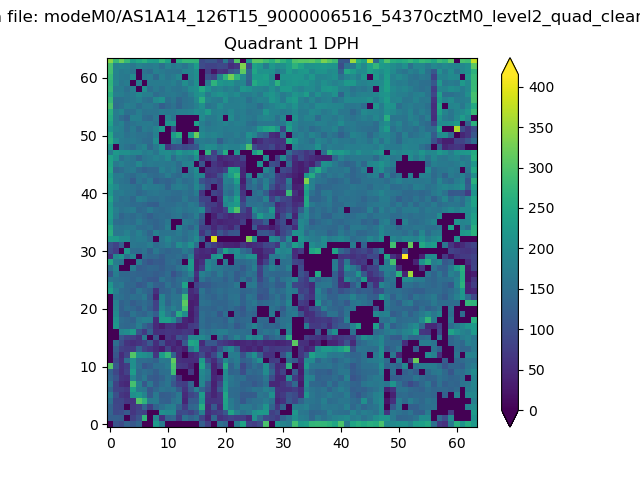 |
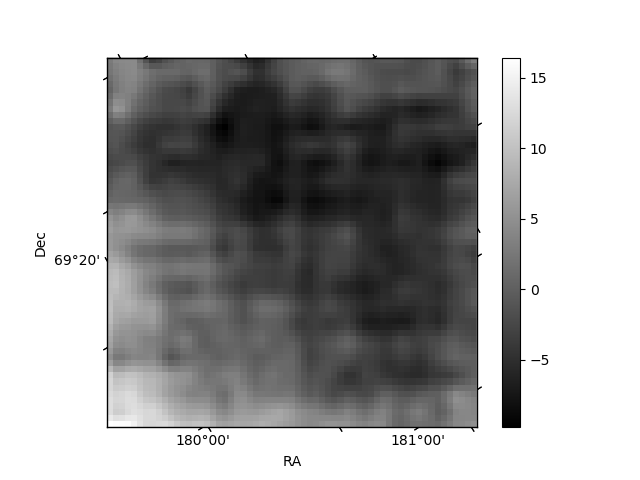
Quadrant B |
|---|---|---|---|
| Quadrant D | 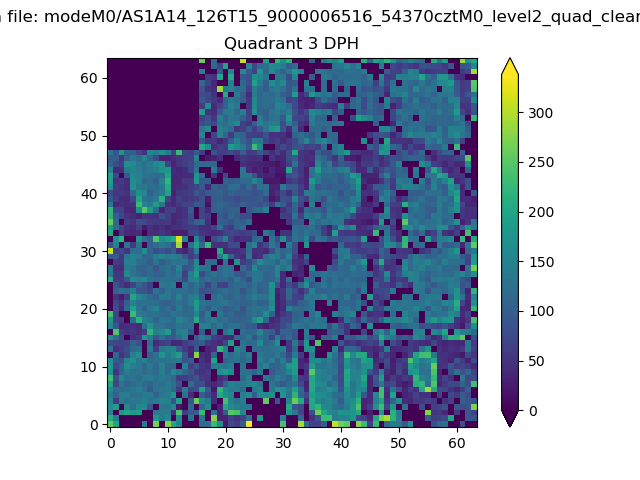 |
 |
Quadrant C |
| Plot type | Count rate plots | Images |
|---|---|---|
| Comparison with Poisson distribution Blue bars denote a histogram of data divided into 1 sec bins. Red curve is a Poisson curve with rate = median count rate of data. |
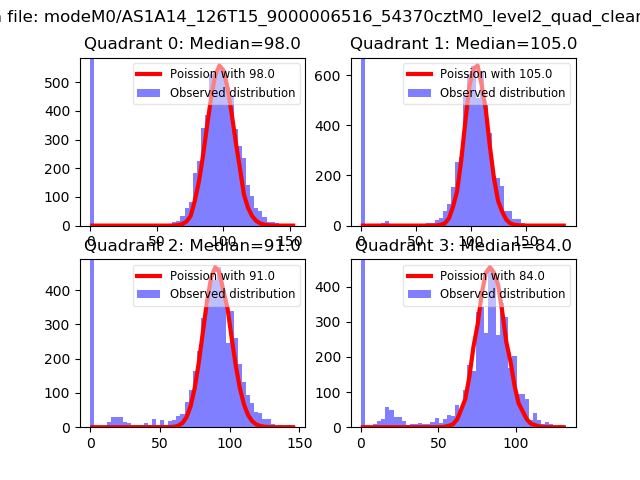 |
 |
| Quadrant-wise count rates Data is divided into 100 sec bins |
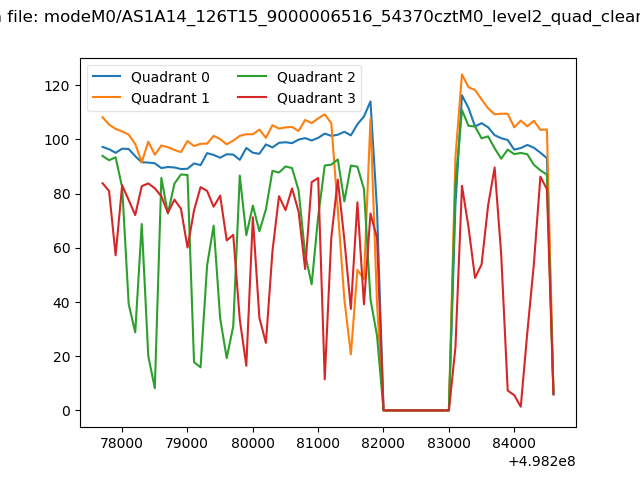 |
|
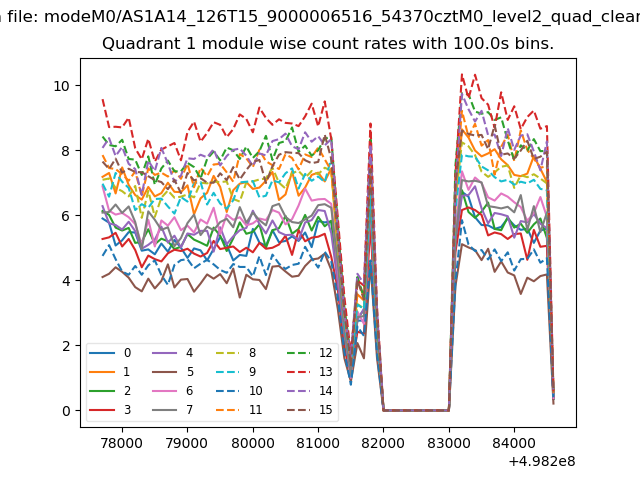
| Module-wise count rates for Quadrant A Data is divided into 100 sec bins |
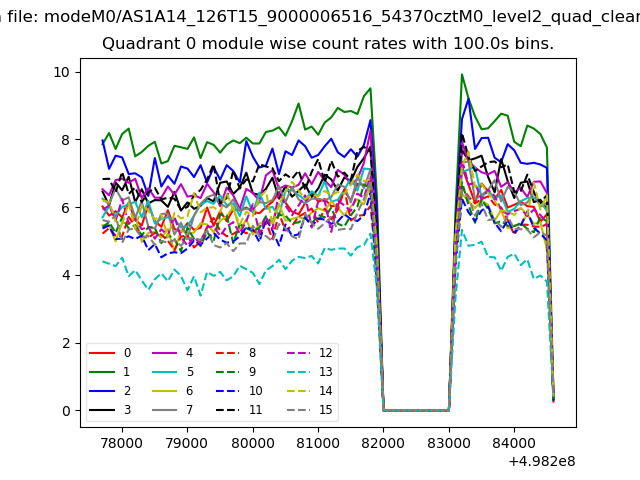 |
 |
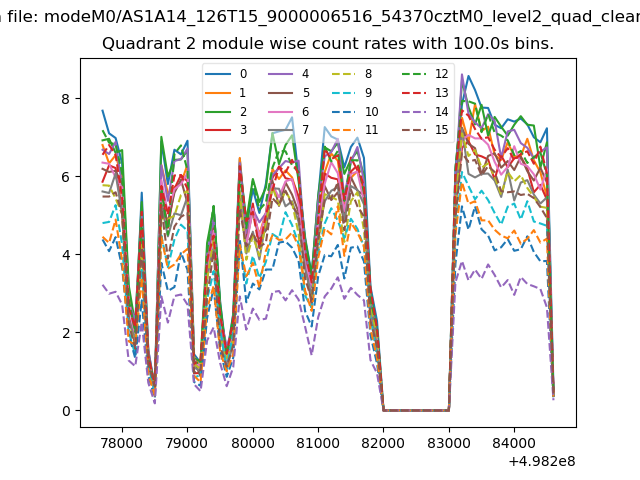
| Module-wise count rates for Quadrant B Data is divided into 100 sec bins |
 |
 |
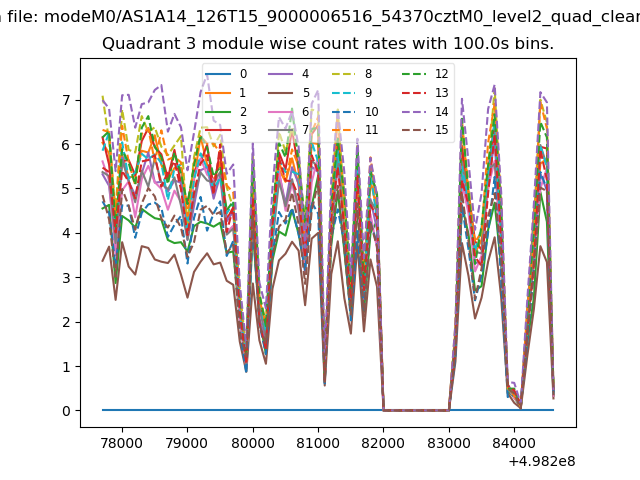
| Module-wise count rates for Quadrant C Data is divided into 100 sec bins |
 |
 |
| Module-wise count rates for Quadrant D Data is divided into 100 sec bins |
 |
 |
| Parameter | Plot |
|---|---|
| CZT HV Monitor | 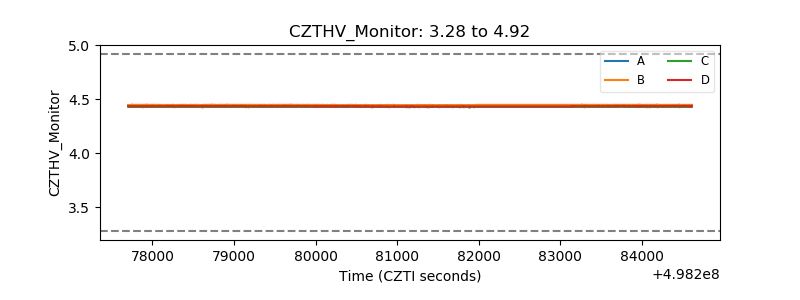 |
| D_VDD | 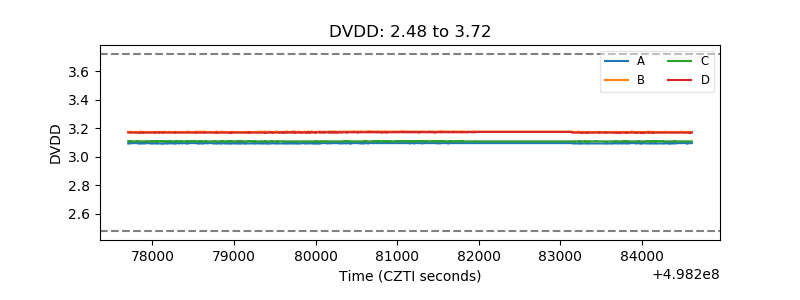 |
| Temperature 1 | 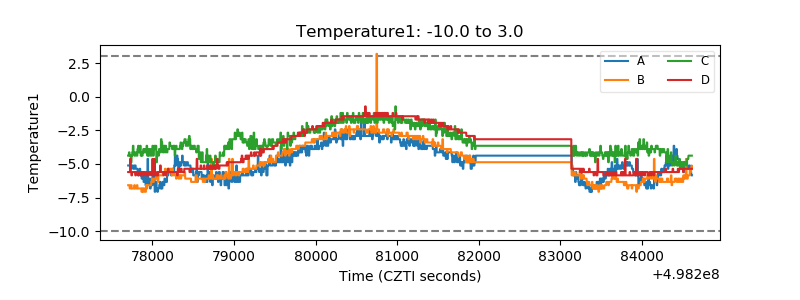 |
| Veto HV Monitor | 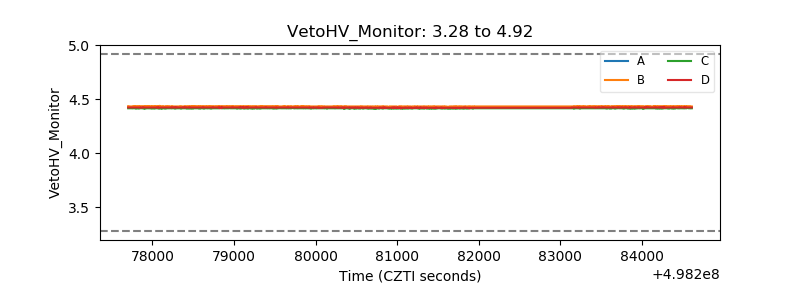 |
| Veto LLD | 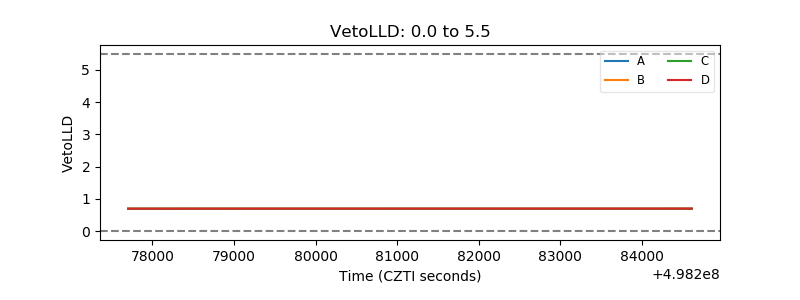 |
| Alpha Counter | 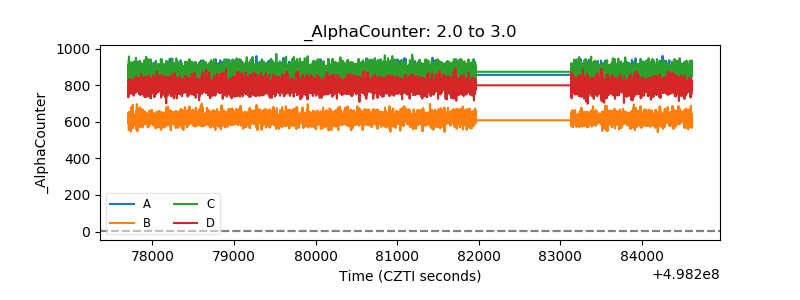 |
| _CPM_Rate | 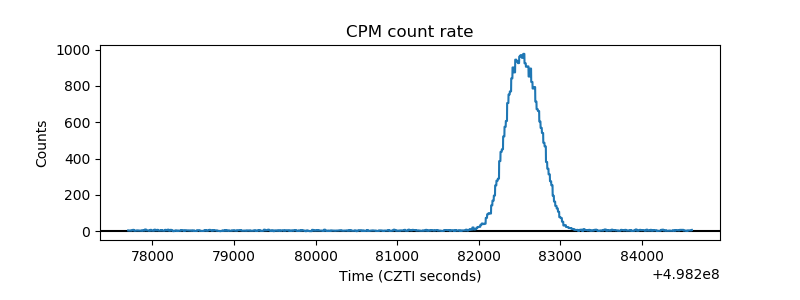 |
| CZT Counter | 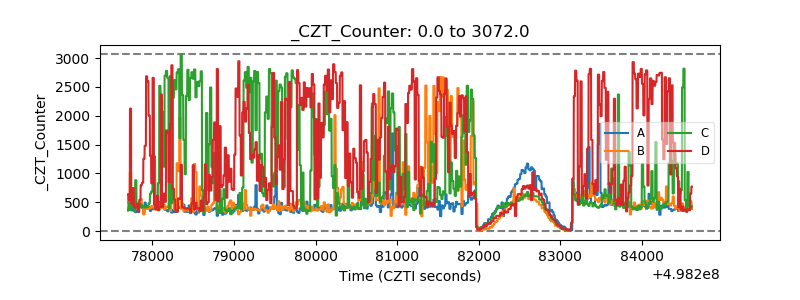 |
| +2.5 Volts monitor |  |
| +5 Volts monitor | 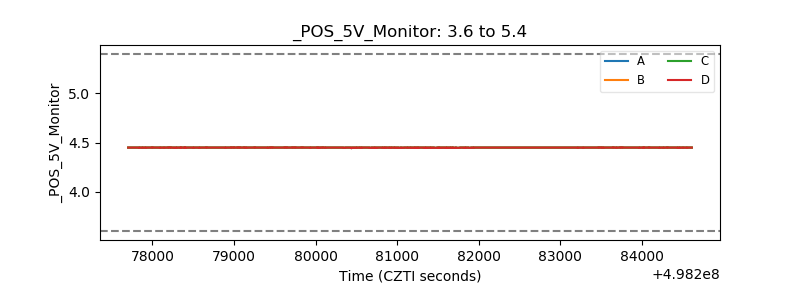 |
| _ROLL_ROT | 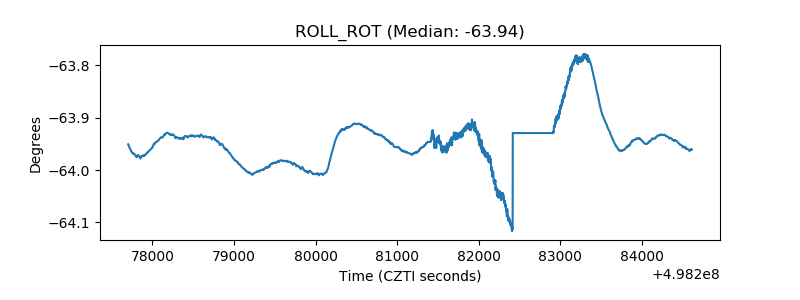 |
| _Roll_DEC | 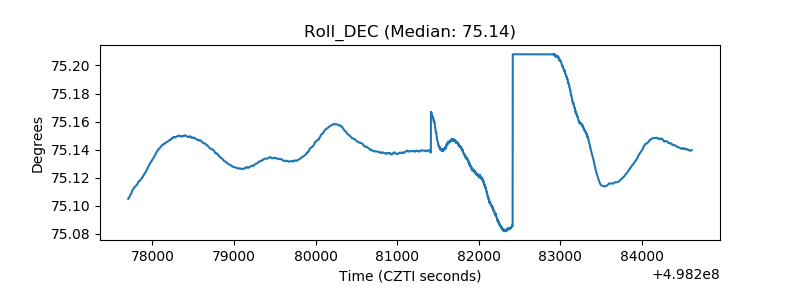 |
| _Roll_RA | 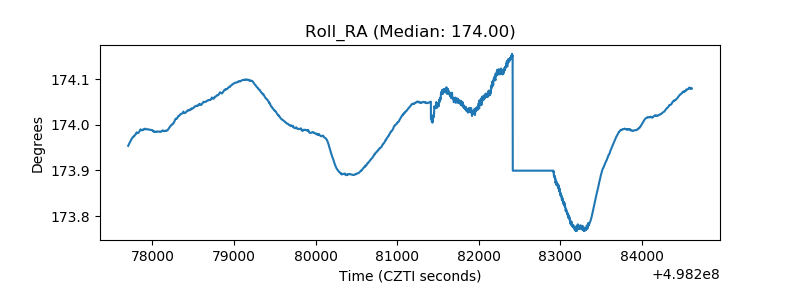 |
| Veto Counter | 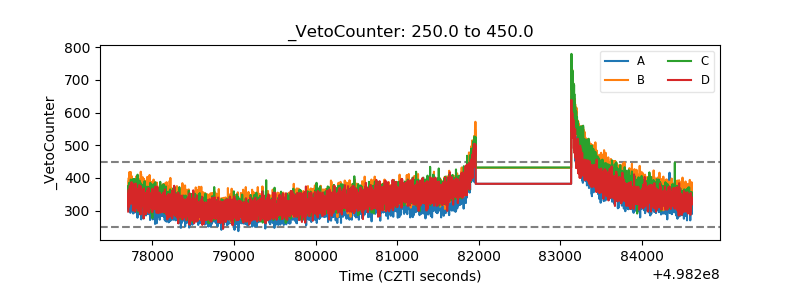 |