| Param | Original file | Final file |
|---|---|---|
| Filename | modeM0/AS1A14_126T19_9000006518cztM0_level2.fits | modeM0/AS1A14_126T19_9000006518cztM0_level2_quad_clean.evt |
| Size (bytes) | 968,042,880 | 511,424,640 |
| Size | 923.2 MB | 487.7 MB |
| Events in quadrant A | 7,361,803 | 2,550,842 |
| Events in quadrant B | 6,511,167 | 2,488,076 |
| Events in quadrant C | 6,478,452 | 2,160,503 |
| Events in quadrant D | 942,984 | 278,642 |
| Mode SS | |||
|---|---|---|---|
| Quadrant | BADHDUFLAG | Total packets | Discarded packets |
| A | 0 | 2960 | 0 |
| B | 0 | 2962 | 0 |
| C | 0 | 2954 | 0 |
| D | 0 | 2959 | 0 |
| Mode M0 | |||
|---|---|---|---|
| Quadrant | BADHDUFLAG | Total packets | Discarded packets |
| A | 0 | 309105 | 0 |
| B | 0 | 416942 | 0 |
| C | 0 | 499789 | 0 |
| D | 0 | 61803 | 0 |
| Mode M9 | |||
|---|---|---|---|
| Quadrant | BADHDUFLAG | Total packets | Discarded packets |
| A | 0 | 711 | 0 |
| B | 0 | 712 | 0 |
| C | 0 | 148 | 0 |
| D | 0 | 148 | 0 |
| Quadrant | Total seconds | Saturated seconds | Saturation percentage |
|---|---|---|---|
| A | 145598 | 1968 | 1.351667% |
| B | 145473 | 14670 | 10.084346% |
| C | 145500 | 23586 | 16.210309% |
| D | 22397 | 1224 | 5.465018% |
Noise dominated data is calculated using 1-second bins in cleaned event files. If a bin has >2000 counts, and if more than 50% of those come from <1% of pixels, then it is considered to be noise-dominated and hence unusable.
| Quadrant | # 1 sec bins | Bins with >0 counts | Bins with >2000 counts | High rate bins dominated by noise | Noise dominated (total time) | Noise dominated (detector-on time) | Marked lightcurve |
|---|---|---|---|---|---|---|---|
| A | 157777 | 139874 | 0 | 0 | 0.00% | 0.00% | 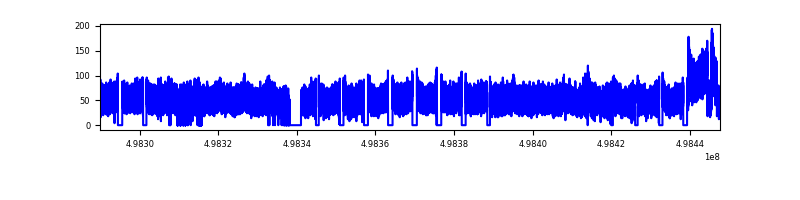 |
| B | 157777 | 139708 | 0 | 0 | 0.00% | 0.00% | 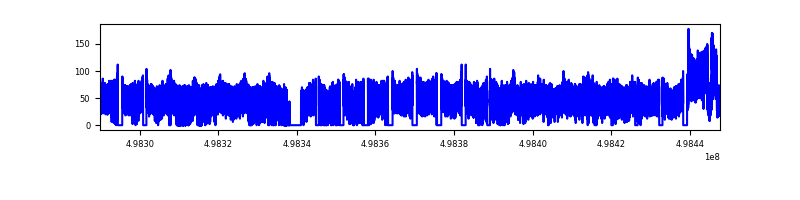 |
| C | 157777 | 139727 | 0 | 0 | 0.00% | 0.00% | 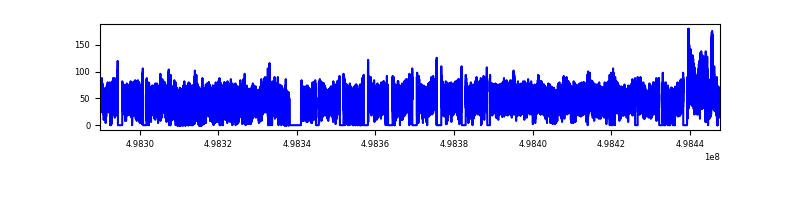 |
| D | 25368 | 22741 | 0 | 0 | 0.00% | 0.00% | 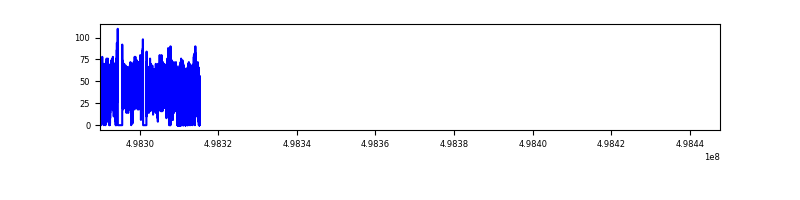 |
Top three noisy pixels from each quadrant. If the there are fewer than three noisy pixels in the level2.evt file, extra rows are filled as -1
| Pixel properties | Quadrant properties | ||||||
|---|---|---|---|---|---|---|---|
| Quadrant | DetID | PixID | Counts | Sigma | Mean | Median | Sigma |
| A | 14 | 188 | 8219 | 9.86 | 1932 | 1779 | 653.2 |
| A | 9 | 255 | 7362 | 8.55 | 1932 | 1779 | 653.2 |
| A | 14 | 204 | 6729 | 7.58 | 1932 | 1779 | 653.2 |
| B | 2 | 9 | 7530 | 14.7 | 1721 | 1625 | 401.7 |
| B | 2 | 8 | 6736 | 12.72 | 1721 | 1625 | 401.7 |
| B | 3 | 25 | 5424 | 9.46 | 1721 | 1625 | 401.7 |
| C | 15 | 175 | 5559 | 6.64 | 1729 | 1571 | 600.9 |
| C | 15 | 127 | 5163 | 5.98 | 1729 | 1571 | 600.9 |
| C | 2 | 31 | 5124 | 5.91 | 1729 | 1571 | 600.9 |
| D | 6 | 218 | 1118 | 9.57 | 268 | 236 | 92.1 |
| D | 15 | 11 | 929 | 7.52 | 268 | 236 | 92.1 |
| D | 3 | 30 | 891 | 7.11 | 268 | 236 | 92.1 |
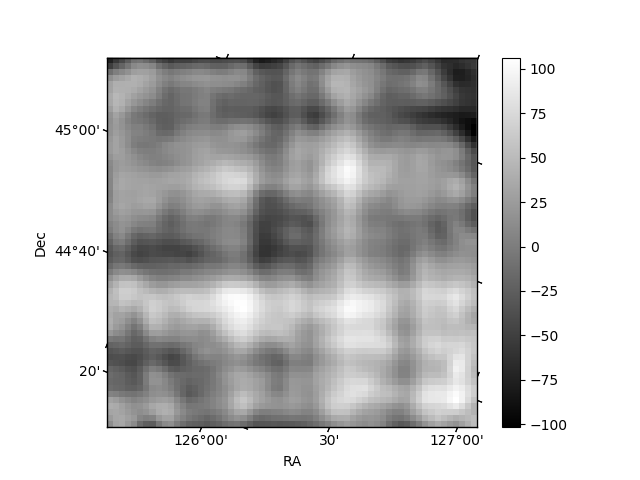
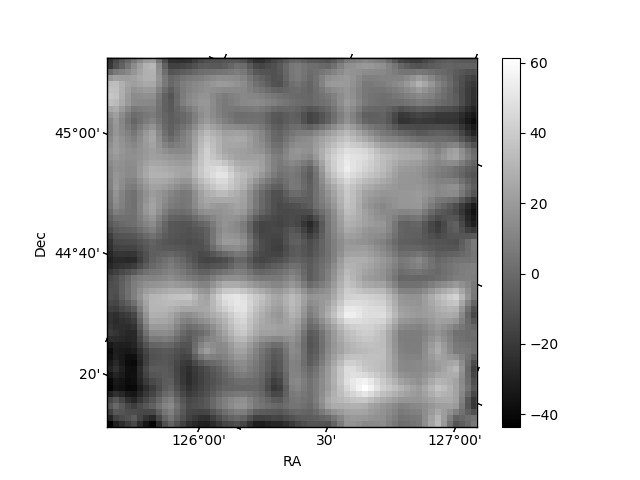
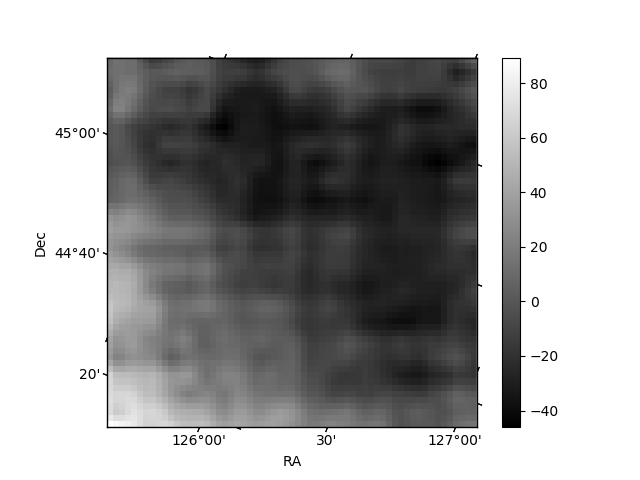
Histogram calculated using DETX and DETY for each event in the final _common_clean file
| Quadrant A | 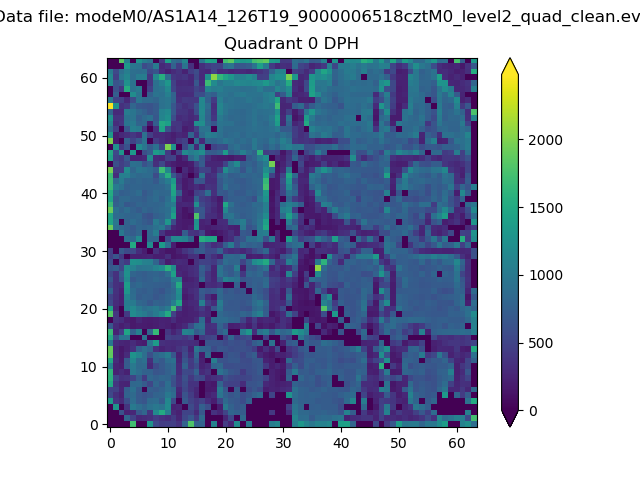 |
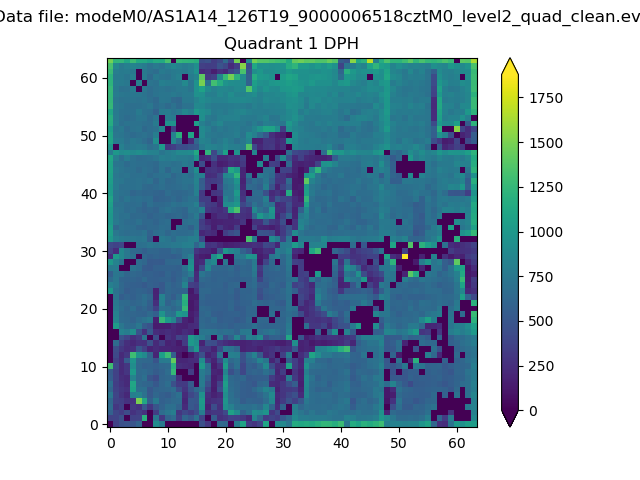 |
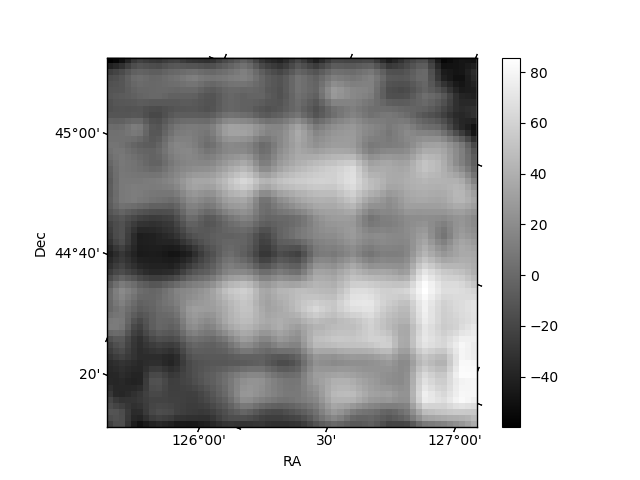
Quadrant B |
|---|---|---|---|
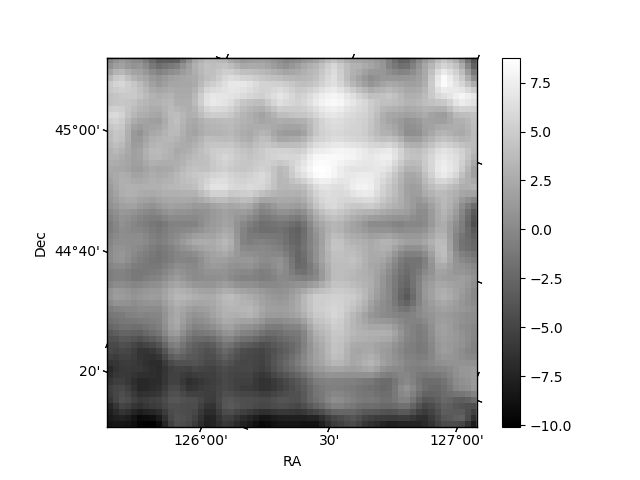
| Quadrant D |  |
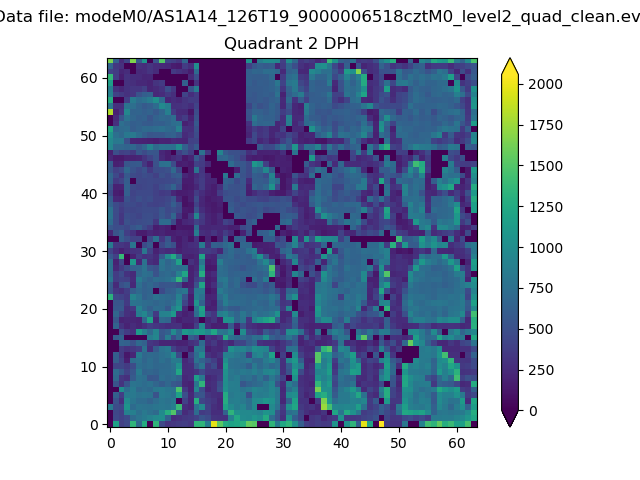 |
Quadrant C |
| Plot type | Count rate plots | Images |
|---|---|---|
| Comparison with Poisson distribution Blue bars denote a histogram of data divided into 1 sec bins. Red curve is a Poisson curve with rate = median count rate of data. |
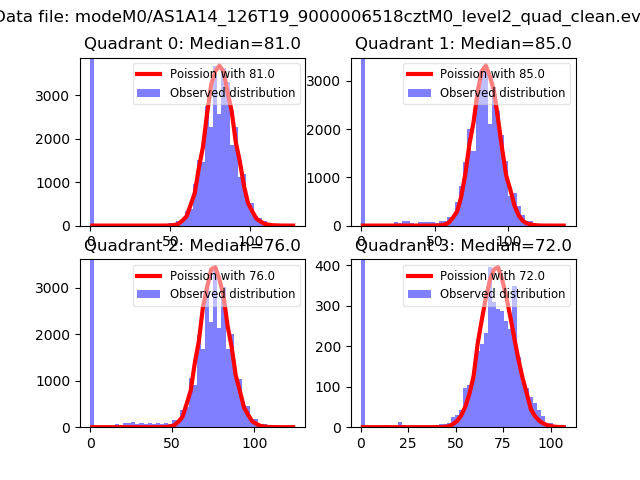 |
 |
| Quadrant-wise count rates Data is divided into 100 sec bins |
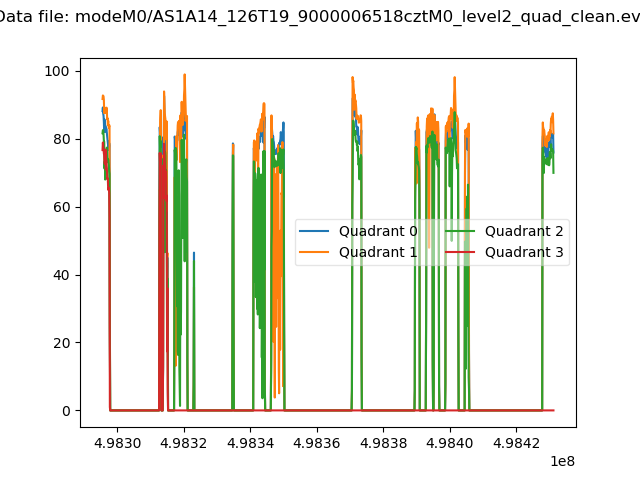 |
|
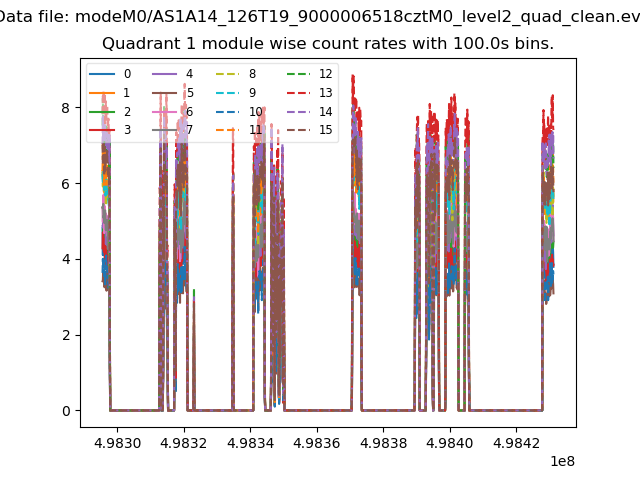
| Module-wise count rates for Quadrant A Data is divided into 100 sec bins |
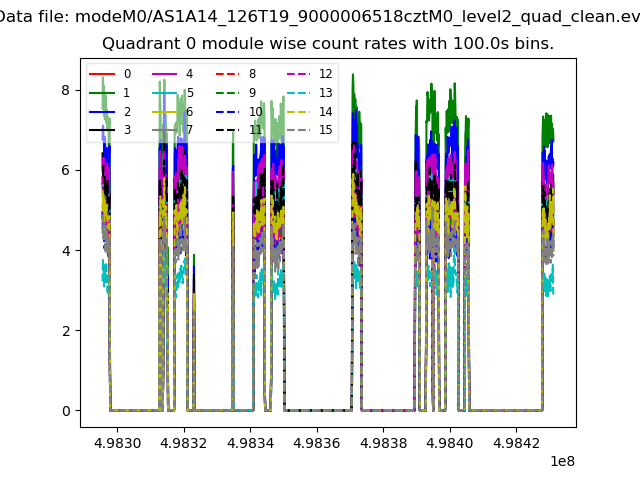 |
 |
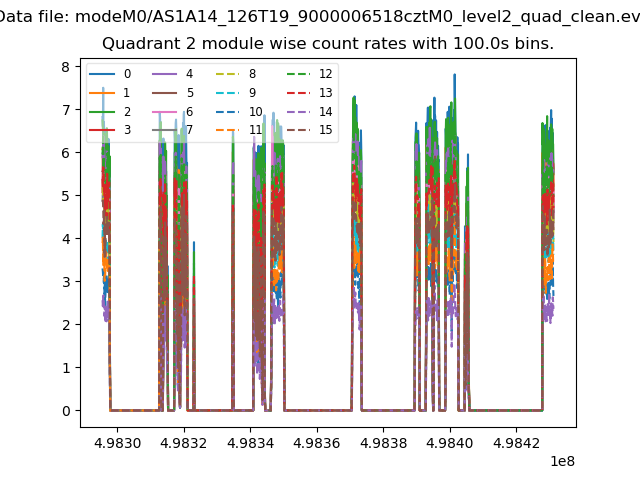
| Module-wise count rates for Quadrant B Data is divided into 100 sec bins |
 |
 |
| Module-wise count rates for Quadrant C Data is divided into 100 sec bins |
 |
 |
| Module-wise count rates for Quadrant D Data is divided into 100 sec bins |
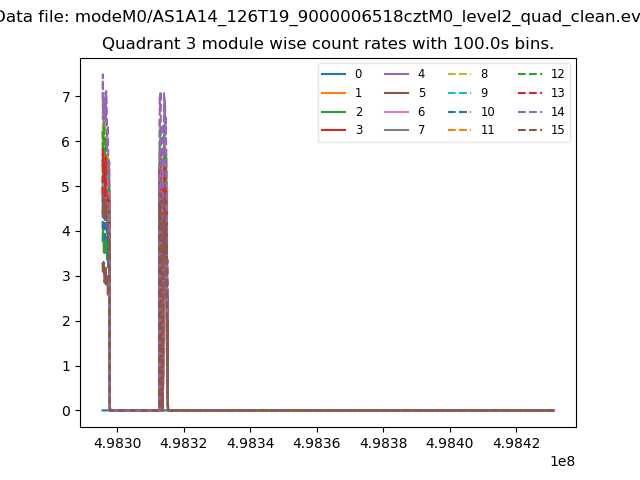 |
 |
| Parameter | Plot |
|---|---|
| CZT HV Monitor | 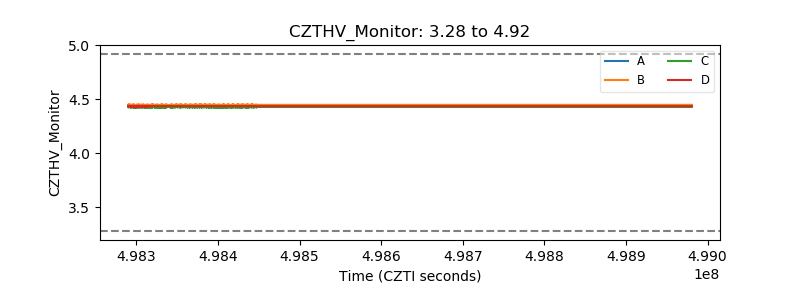 |
| D_VDD | 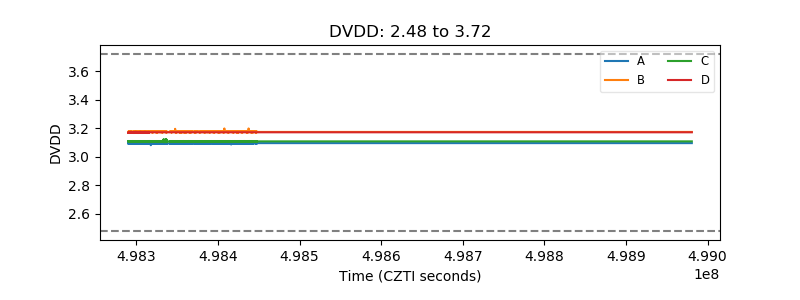 |
| Temperature 1 | 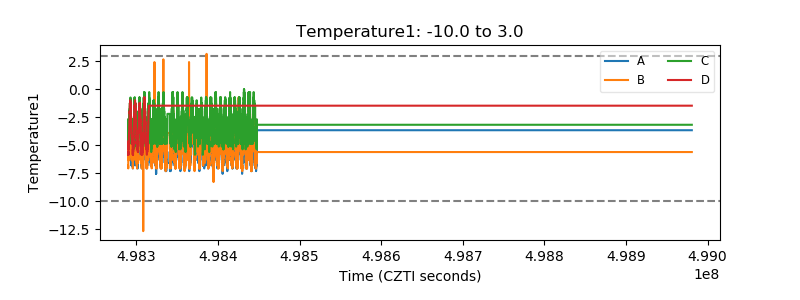 |
| Veto HV Monitor | 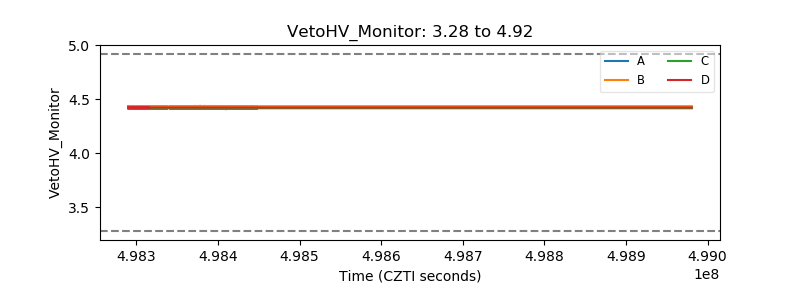 |
| Veto LLD | 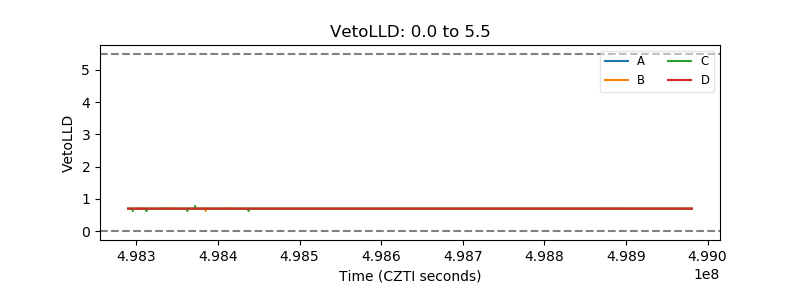 |
| Alpha Counter | 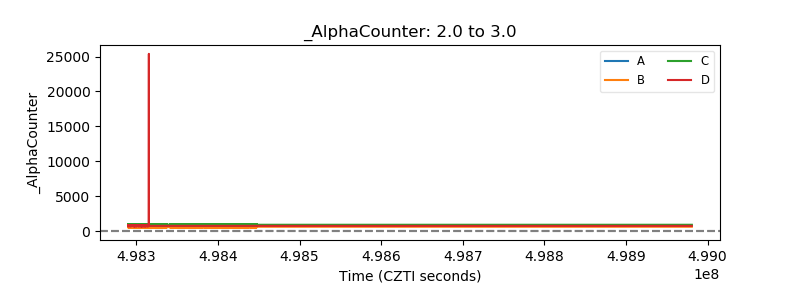 |
| _CPM_Rate | 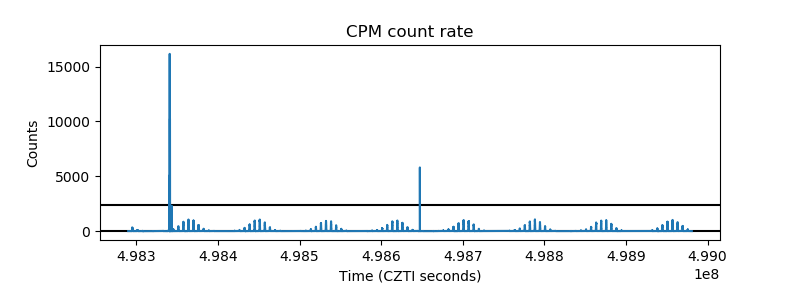 |
| CZT Counter | 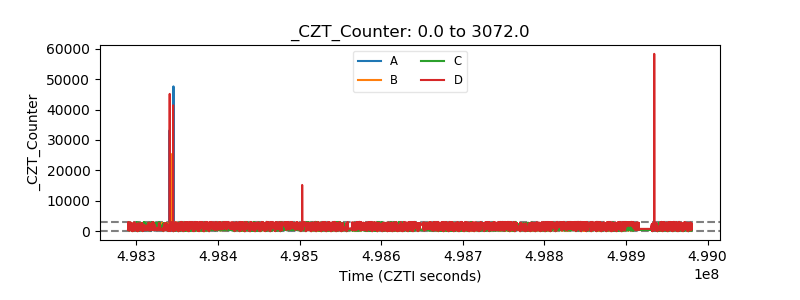 |
| +2.5 Volts monitor |  |
| +5 Volts monitor | 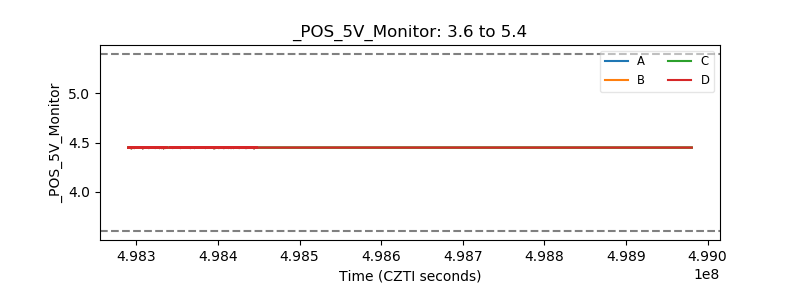 |
| _ROLL_ROT | 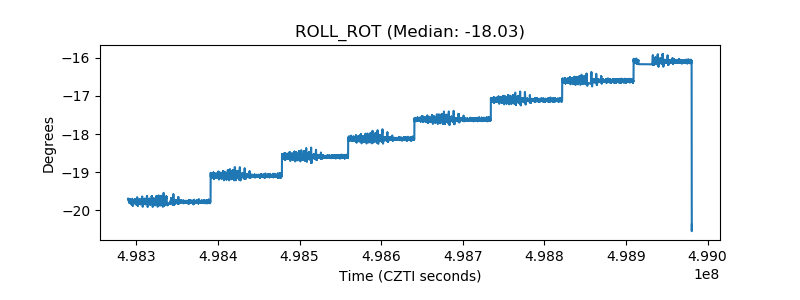 |
| _Roll_DEC | 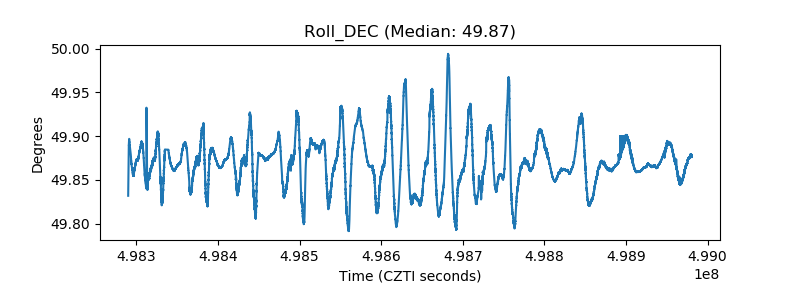 |
| _Roll_RA | 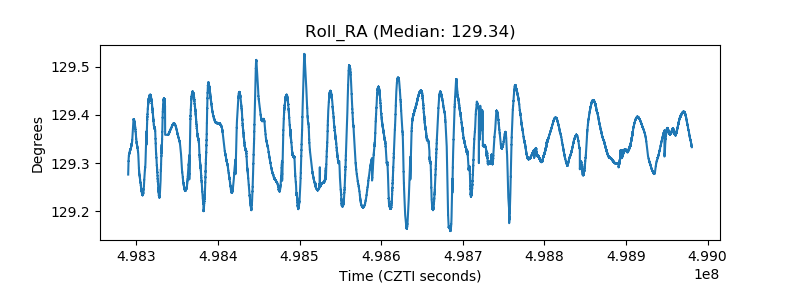 |
| Veto Counter | 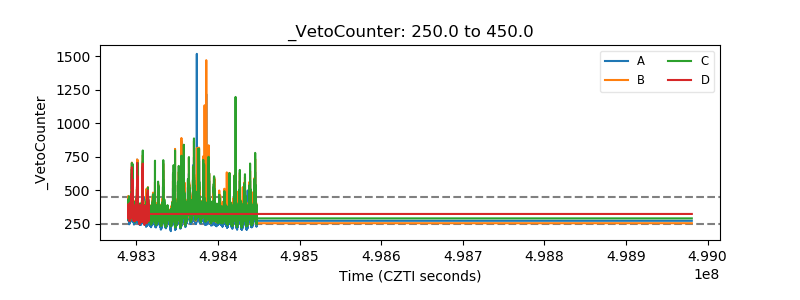 |