| Param | Original file | Final file |
|---|---|---|
| Filename | modeM0/AS1A14_126T19_9000006518_54372cztM0_level2.fits | modeM0/AS1A14_126T19_9000006518_54372cztM0_level2_quad_clean.evt |
| Size (bytes) | 457,335,360 | 86,644,800 |
| Size | 436.1 MB | 82.6 MB |
| Events in quadrant A | 2,768,195 | 590,591 |
| Events in quadrant B | 3,955,875 | 600,419 |
| Events in quadrant C | 4,731,007 | 537,777 |
| Events in quadrant D | 5,002,599 | 471,731 |
| Mode SS | |||
|---|---|---|---|
| Quadrant | BADHDUFLAG | Total packets | Discarded packets |
| A | 0 | 122 | 0 |
| B | 0 | 122 | 0 |
| C | 0 | 122 | 0 |
| D | 0 | 122 | 0 |
| Mode M0 | |||
|---|---|---|---|
| Quadrant | BADHDUFLAG | Total packets | Discarded packets |
| A | 0 | 12867 | 1 |
| B | 0 | 16209 | 1 |
| C | 0 | 18324 | 1 |
| D | 0 | 19245 | 1 |
| Mode M9 | |||
|---|---|---|---|
| Quadrant | BADHDUFLAG | Total packets | Discarded packets |
| A | 0 | 11 | 0 |
| B | 0 | 11 | 0 |
| C | 0 | 11 | 0 |
| D | 0 | 11 | 0 |
| Quadrant | Total seconds | Saturated seconds | Saturation percentage |
|---|---|---|---|
| A | 6060 | 69 | 1.138614% |
| B | 6060 | 466 | 7.689769% |
| C | 6060 | 391 | 6.452145% |
| D | 6061 | 721 | 11.895727% |
Noise dominated data is calculated using 1-second bins in cleaned event files. If a bin has >2000 counts, and if more than 50% of those come from <1% of pixels, then it is considered to be noise-dominated and hence unusable.
| Quadrant | # 1 sec bins | Bins with >0 counts | Bins with >2000 counts | High rate bins dominated by noise | Noise dominated (total time) | Noise dominated (detector-on time) | Marked lightcurve |
|---|---|---|---|---|---|---|---|
| A | 7180 | 6061 | 29 | 29 | 0.40% | 0.48% | 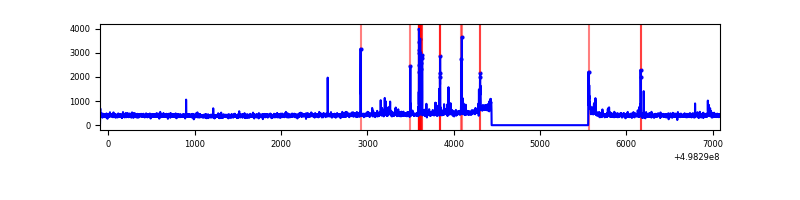 |
| B | 7180 | 6061 | 262 | 262 | 3.65% | 4.32% | 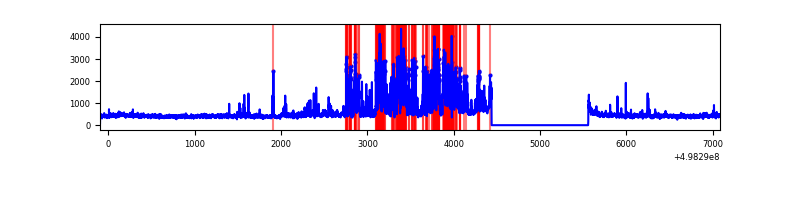 |
| C | 7180 | 6061 | 392 | 392 | 5.46% | 6.47% | 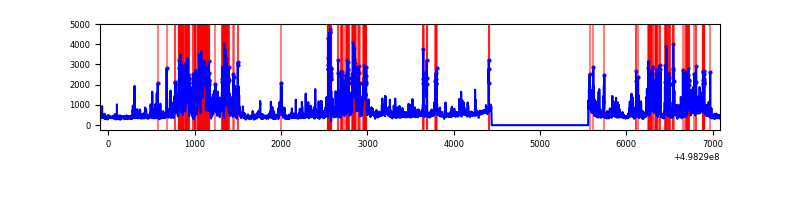 |
| D | 7181 | 6062 | 611 | 611 | 8.51% | 10.08% | 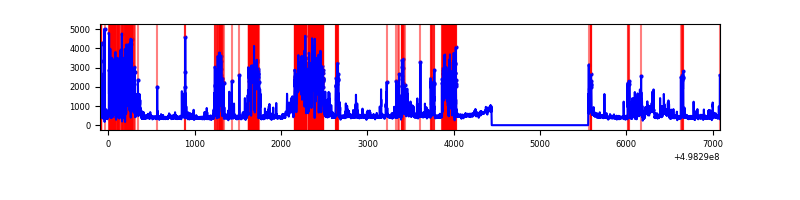 |
Top three noisy pixels from each quadrant. If the there are fewer than three noisy pixels in the level2.evt file, extra rows are filled as -1
| Pixel properties | Quadrant properties | ||||||
|---|---|---|---|---|---|---|---|
| Quadrant | DetID | PixID | Counts | Sigma | Mean | Median | Sigma |
| A | 0 | 8 | 141058 | 873.09 | 652 | 637 | 160.8 |
| A | 15 | 174 | 29180 | 177.47 | 652 | 637 | 160.8 |
| A | 13 | 254 | 18550 | 111.38 | 652 | 637 | 160.8 |
| B | 10 | 14 | 1142672 | 8523.44 | 625 | 603 | 134.0 |
| B | 5 | 185 | 149701 | 1112.74 | 625 | 603 | 134.0 |
| B | 7 | 0 | 42547 | 313.03 | 625 | 603 | 134.0 |
| C | 1 | 29 | 1711527 | 10158.49 | 611 | 605 | 168.4 |
| C | 12 | 2 | 248385 | 1471.18 | 611 | 605 | 168.4 |
| C | 13 | 3 | 102007 | 602.07 | 611 | 605 | 168.4 |
| D | 8 | 176 | 1247961 | 7415.89 | 592 | 567 | 168.2 |
| D | 2 | 120 | 479959 | 2850.04 | 592 | 567 | 168.2 |
| D | 4 | 238 | 446240 | 2649.57 | 592 | 567 | 168.2 |
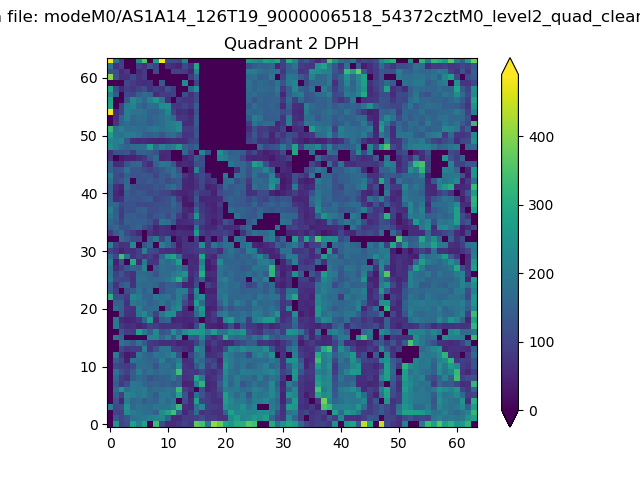
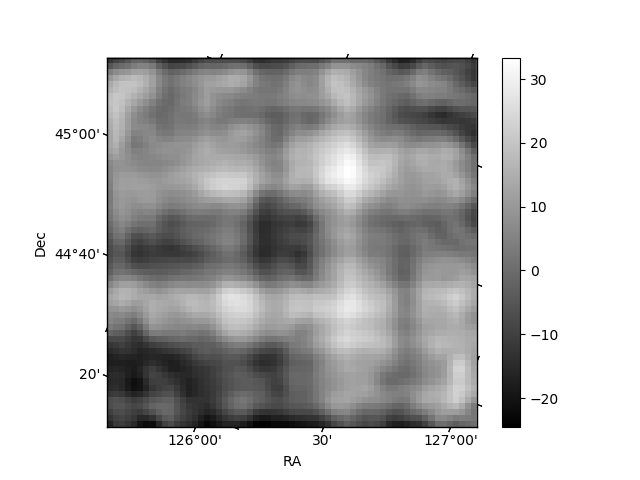
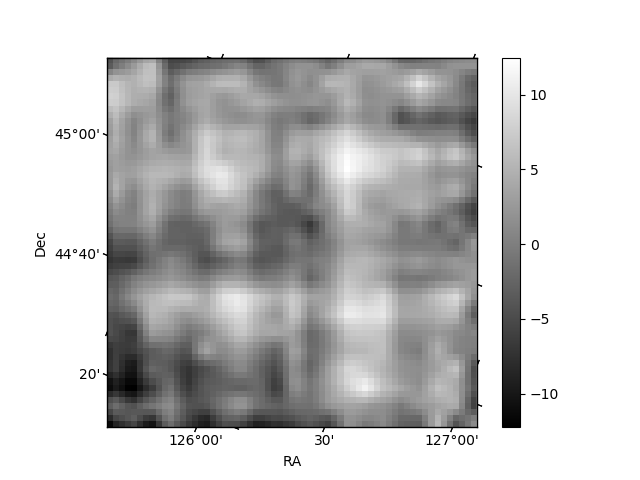
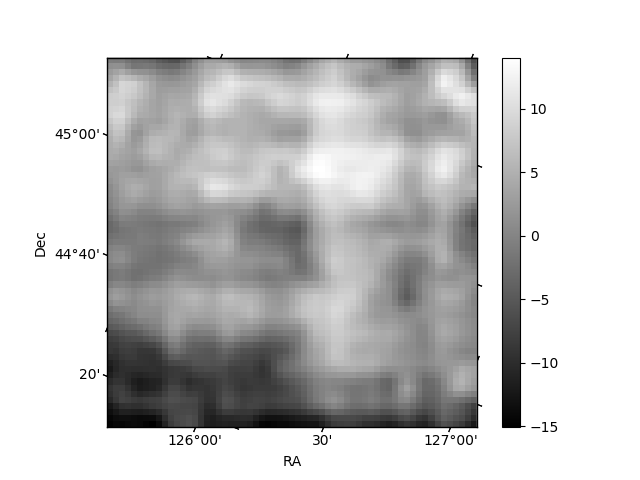
Histogram calculated using DETX and DETY for each event in the final _common_clean file
| Quadrant A | 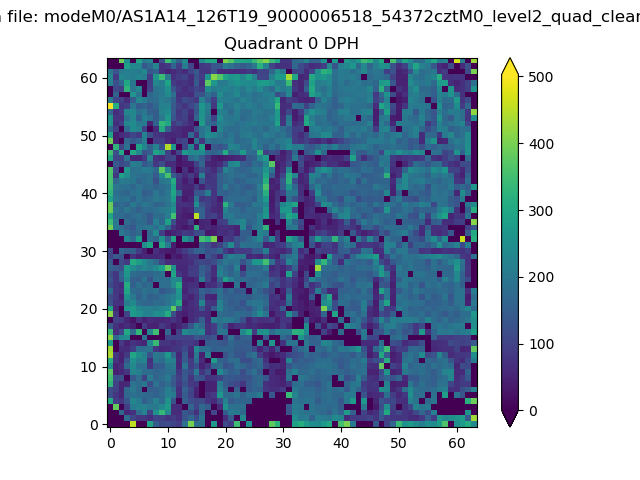 |
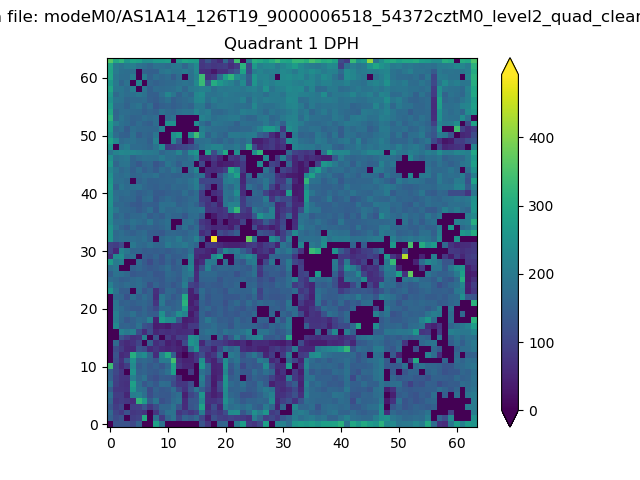 |
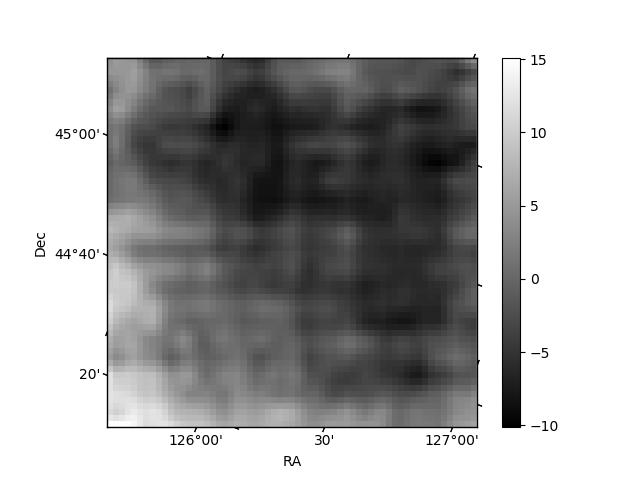
Quadrant B |
|---|---|---|---|
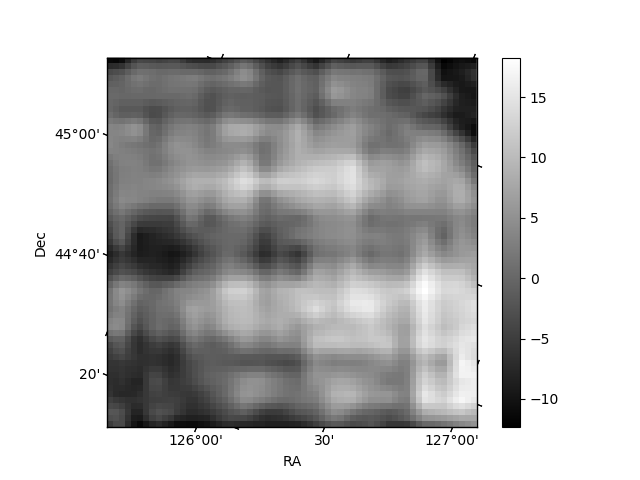
| Quadrant D | 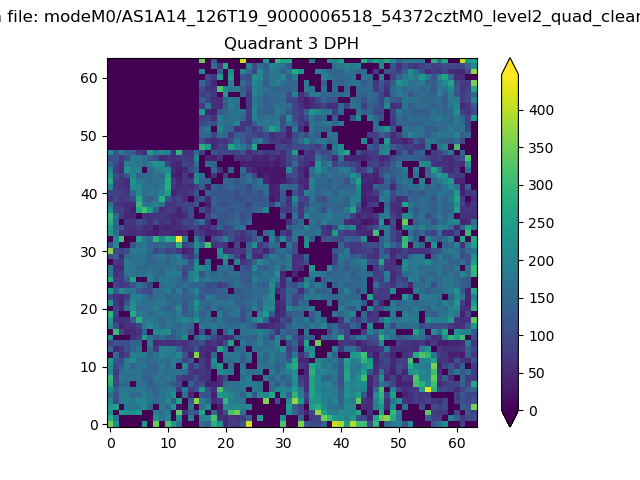 |
 |
Quadrant C |
| Plot type | Count rate plots | Images |
|---|---|---|
| Comparison with Poisson distribution Blue bars denote a histogram of data divided into 1 sec bins. Red curve is a Poisson curve with rate = median count rate of data. |
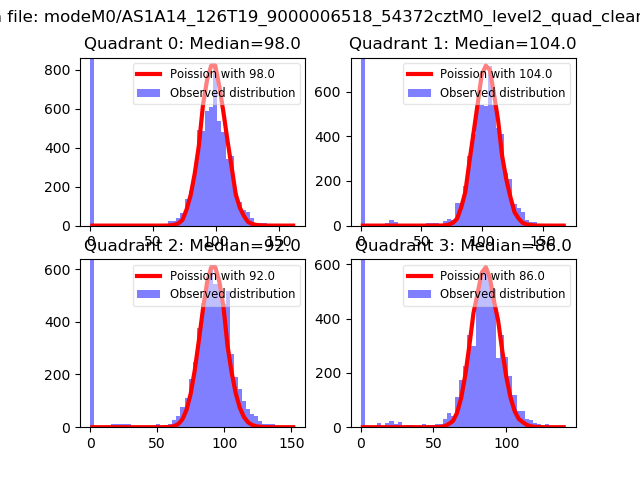 |
 |
| Quadrant-wise count rates Data is divided into 100 sec bins |
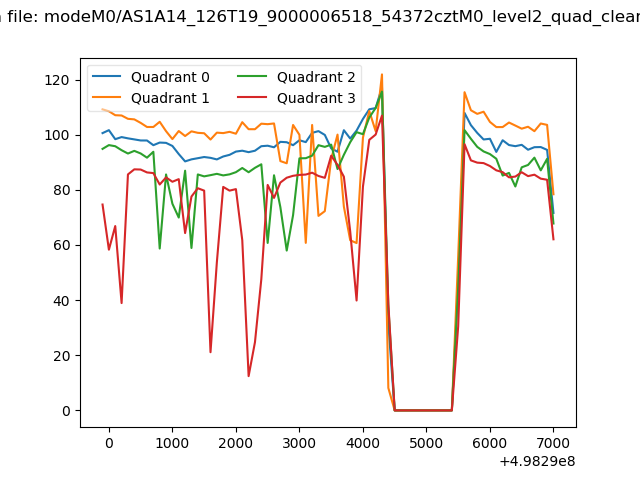 |
|
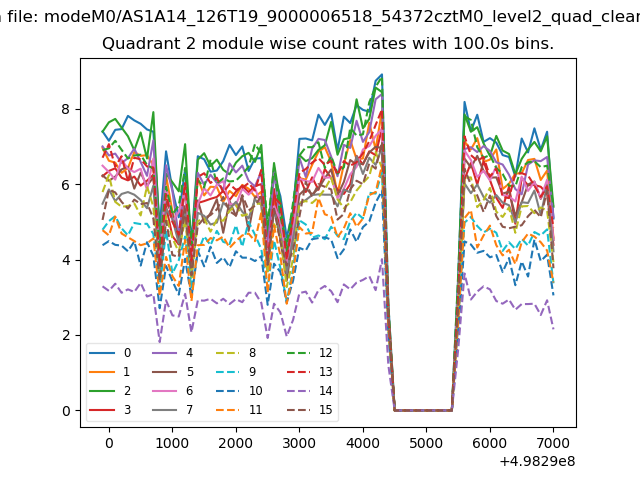
| Module-wise count rates for Quadrant A Data is divided into 100 sec bins |
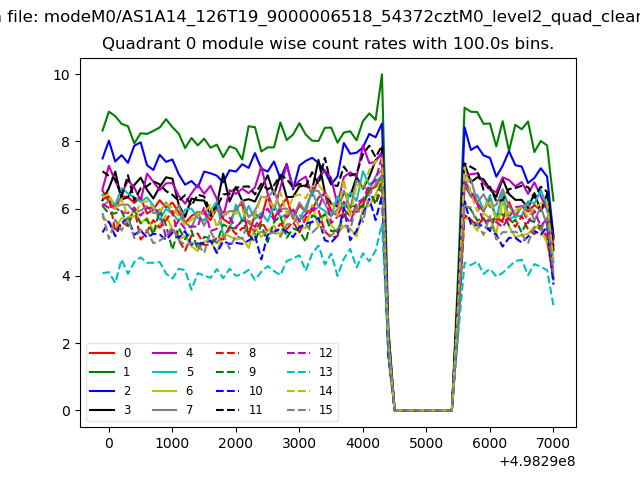 |
 |
| Module-wise count rates for Quadrant B Data is divided into 100 sec bins |
 |
 |
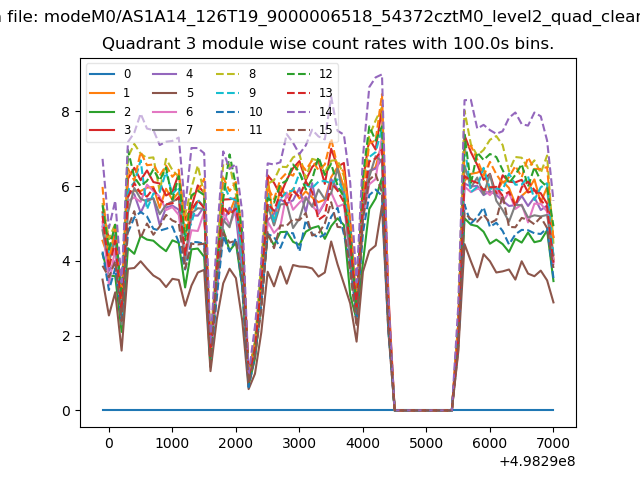
| Module-wise count rates for Quadrant C Data is divided into 100 sec bins |
 |
 |
| Module-wise count rates for Quadrant D Data is divided into 100 sec bins |
 |
 |
| Parameter | Plot |
|---|---|
| CZT HV Monitor | 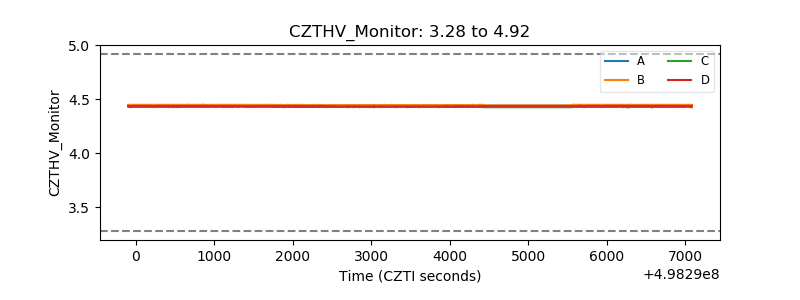 |
| D_VDD | 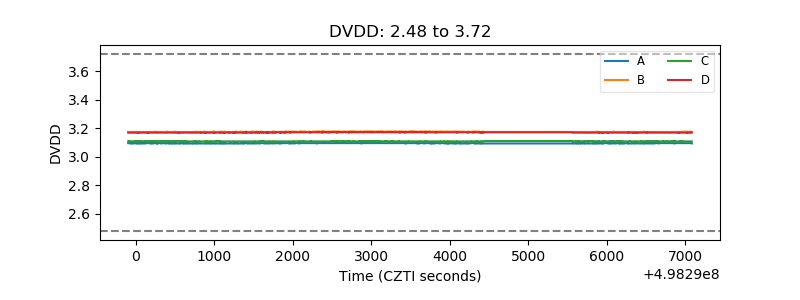 |
| Temperature 1 | 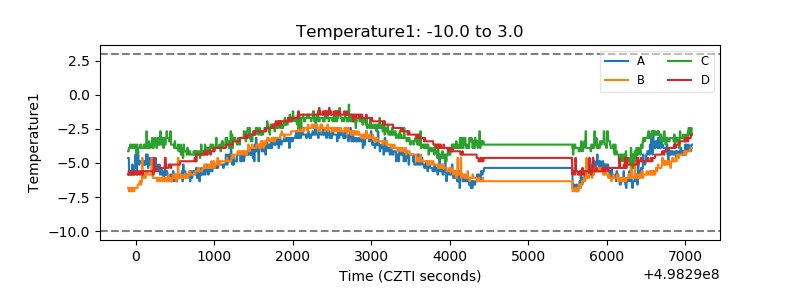 |
| Veto HV Monitor | 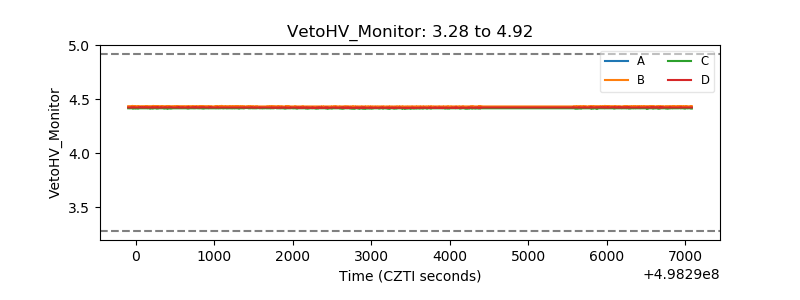 |
| Veto LLD | 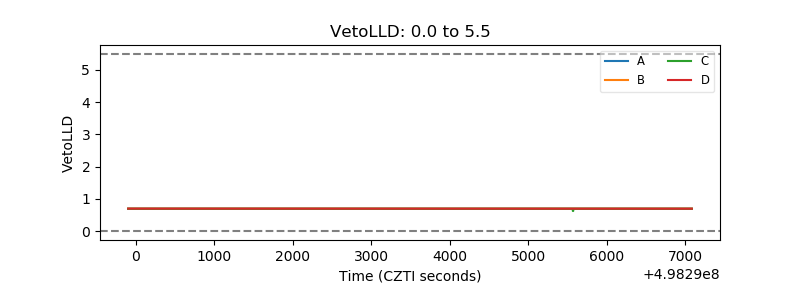 |
| Alpha Counter | 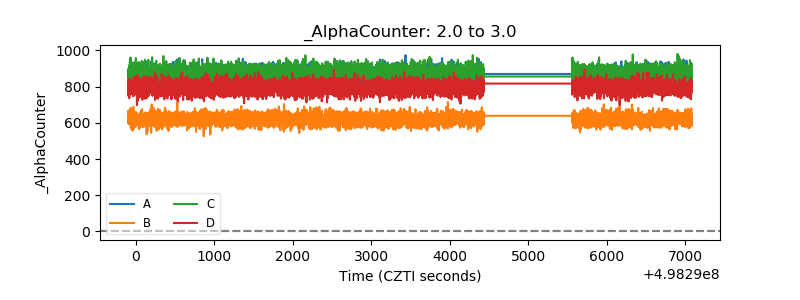 |
| _CPM_Rate | 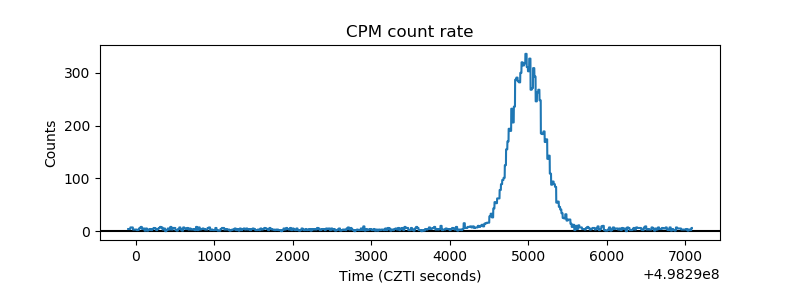 |
| CZT Counter | 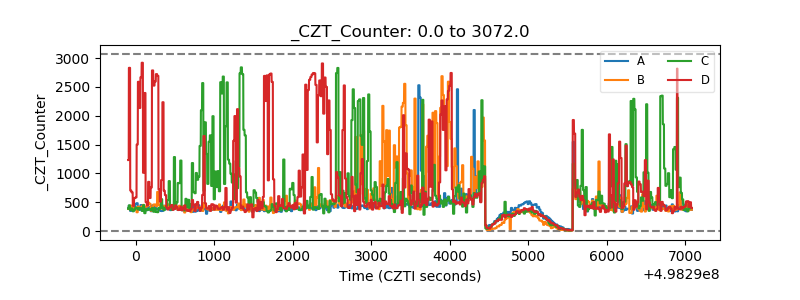 |
| +2.5 Volts monitor |  |
| +5 Volts monitor |  |
| _ROLL_ROT | 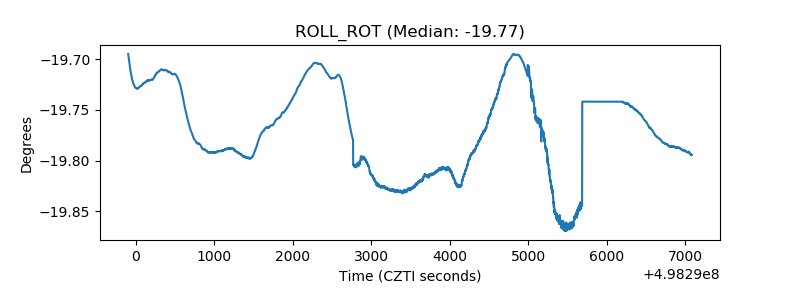 |
| _Roll_DEC | 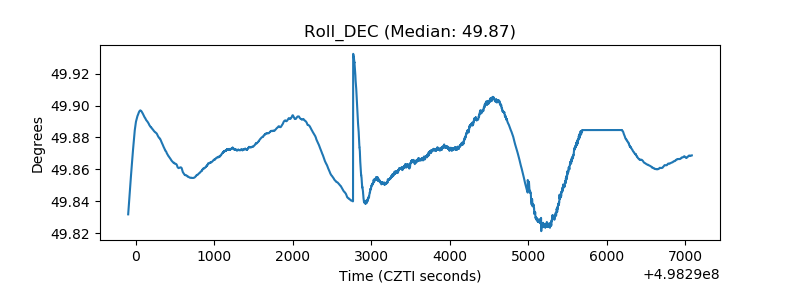 |
| _Roll_RA | 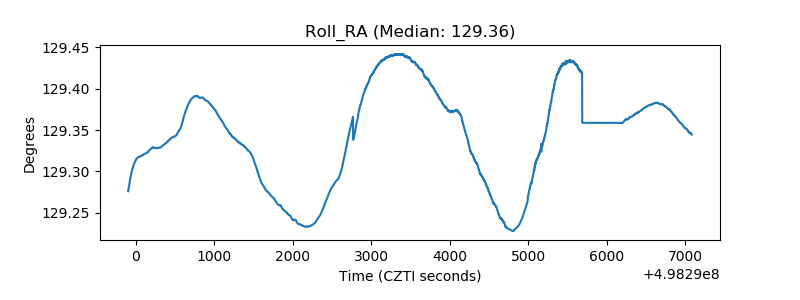 |
| Veto Counter | 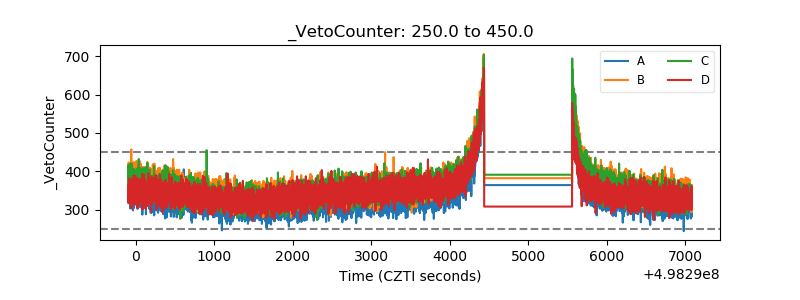 |