| Param | Original file | Final file |
|---|---|---|
| Filename | modeM0/AS1A14_126T19_9000006518_54375cztM0_level2.fits | modeM0/AS1A14_126T19_9000006518_54375cztM0_level2_quad_clean.evt |
| Size (bytes) | 531,414,720 | 87,082,560 |
| Size | 506.8 MB | 83.0 MB |
| Events in quadrant A | 3,212,976 | 599,703 |
| Events in quadrant B | 5,806,474 | 564,497 |
| Events in quadrant C | 6,179,350 | 483,696 |
| Events in quadrant D | 3,967,058 | 533,101 |
| Mode SS | |||
|---|---|---|---|
| Quadrant | BADHDUFLAG | Total packets | Discarded packets |
| A | 0 | 154 | 18 |
| B | 0 | 153 | 15 |
| C | 0 | 154 | 18 |
| D | 0 | 153 | 9 |
| Mode M0 | |||
|---|---|---|---|
| Quadrant | BADHDUFLAG | Total packets | Discarded packets |
| A | 0 | 16998 | 2760 |
| B | 0 | 27916 | 6356 |
| C | 0 | 29210 | 6200 |
| D | 0 | 19794 | 3485 |
| Quadrant | Total seconds | Saturated seconds | Saturation percentage |
|---|---|---|---|
| A | 6524 | 41 | 0.628449% |
| B | 6449 | 826 | 12.808187% |
| C | 6498 | 1052 | 16.189597% |
| D | 6522 | 65 | 0.996627% |
Noise dominated data is calculated using 1-second bins in cleaned event files. If a bin has >2000 counts, and if more than 50% of those come from <1% of pixels, then it is considered to be noise-dominated and hence unusable.
| Quadrant | # 1 sec bins | Bins with >0 counts | Bins with >2000 counts | High rate bins dominated by noise | Noise dominated (total time) | Noise dominated (detector-on time) | Marked lightcurve |
|---|---|---|---|---|---|---|---|
| A | 7733 | 6926 | 10 | 10 | 0.13% | 0.14% |  |
| B | 7736 | 6935 | 487 | 487 | 6.30% | 7.02% |  |
| C | 7736 | 7021 | 835 | 835 | 10.79% | 11.89% |  |
| D | 7241 | 6935 | 53 | 53 | 0.73% | 0.76% |  |
Top three noisy pixels from each quadrant. If the there are fewer than three noisy pixels in the level2.evt file, extra rows are filled as -1
| Pixel properties | Quadrant properties | ||||||
|---|---|---|---|---|---|---|---|
| Quadrant | DetID | PixID | Counts | Sigma | Mean | Median | Sigma |
| A | 0 | 8 | 154072 | 887.36 | 703 | 685 | 172.9 |
| A | 12 | 115 | 92028 | 528.43 | 703 | 685 | 172.9 |
| A | 4 | 78 | 64339 | 368.24 | 703 | 685 | 172.9 |
| B | 10 | 14 | 2197682 | 15544.74 | 657 | 633 | 141.3 |
| B | 7 | 0 | 704265 | 4978.4 | 657 | 633 | 141.3 |
| B | 5 | 172 | 152380 | 1073.65 | 657 | 633 | 141.3 |
| C | 1 | 241 | 2488933 | 14391.46 | 633 | 625 | 172.9 |
| C | 13 | 3 | 490860 | 2835.34 | 633 | 625 | 172.9 |
| C | 15 | 189 | 141695 | 815.9 | 633 | 625 | 172.9 |
| D | 8 | 176 | 407856 | 2156.16 | 670 | 639 | 188.9 |
| D | 3 | 12 | 263461 | 1391.61 | 670 | 639 | 188.9 |
| D | 7 | 70 | 217809 | 1149.89 | 670 | 639 | 188.9 |
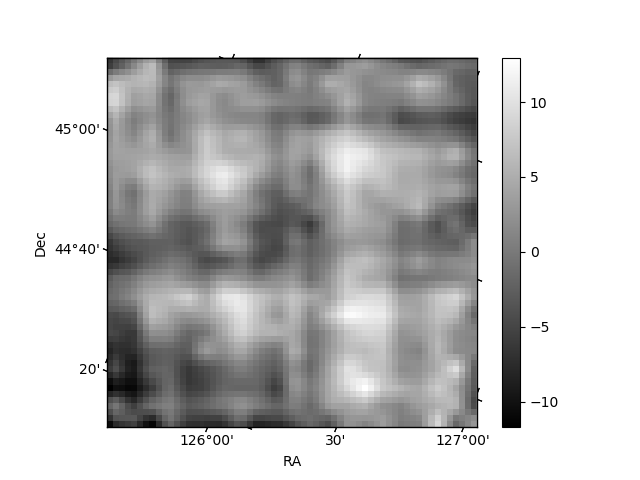
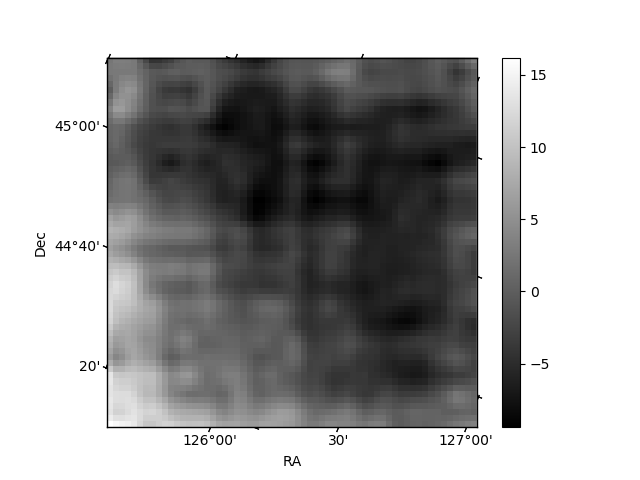
Histogram calculated using DETX and DETY for each event in the final _common_clean file
| Quadrant A | 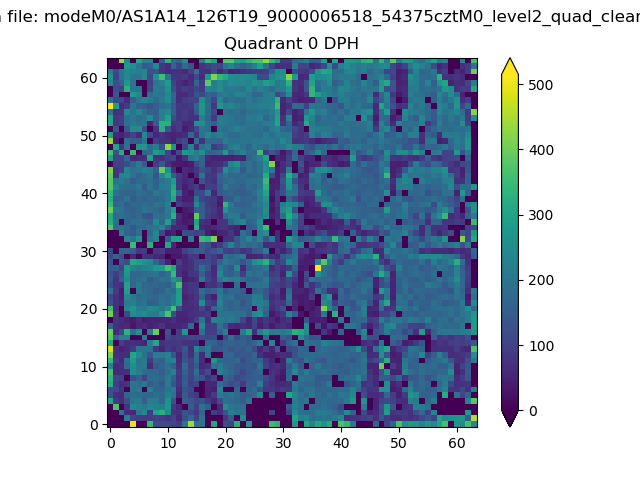 |
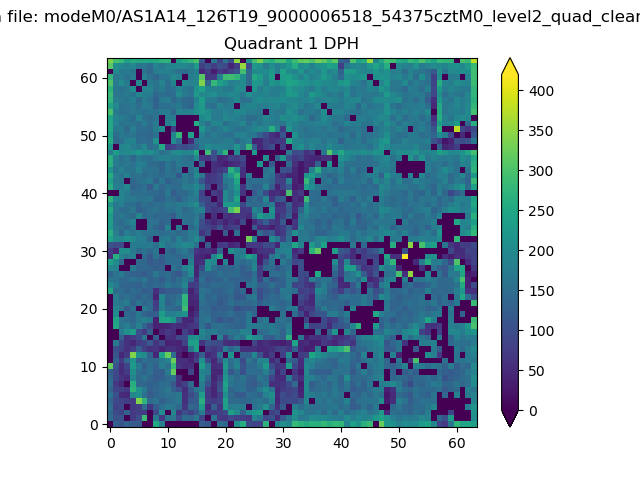 |
Quadrant B |
|---|---|---|---|
| Quadrant D | 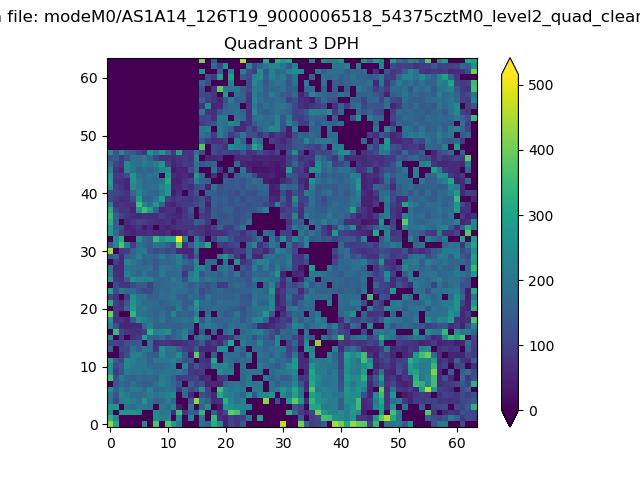 |
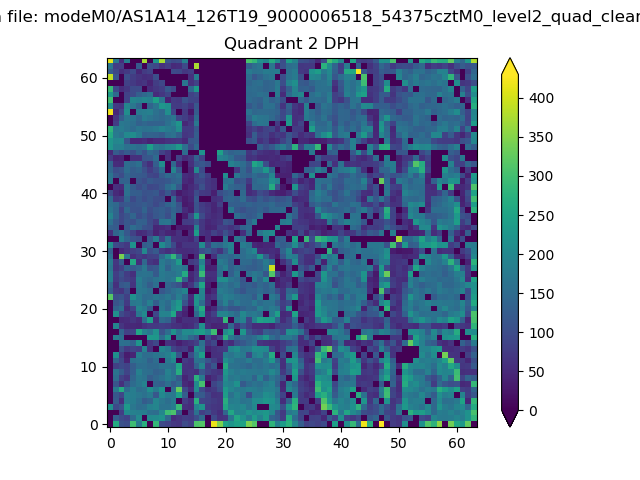 |
Quadrant C |
| Plot type | Count rate plots | Images |
|---|---|---|
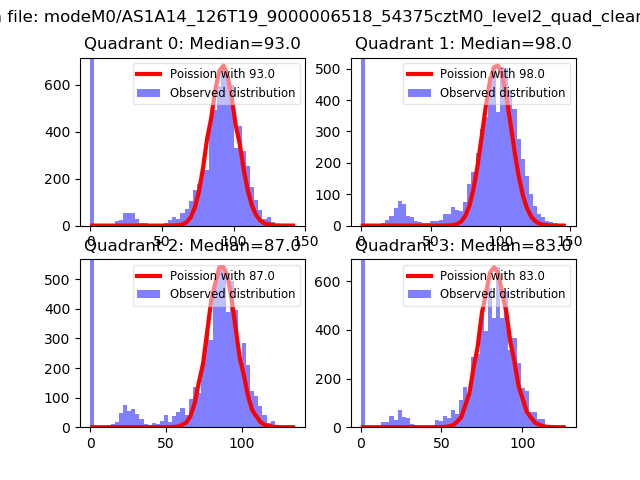
| Comparison with Poisson distribution Blue bars denote a histogram of data divided into 1 sec bins. Red curve is a Poisson curve with rate = median count rate of data. |
 |
 |
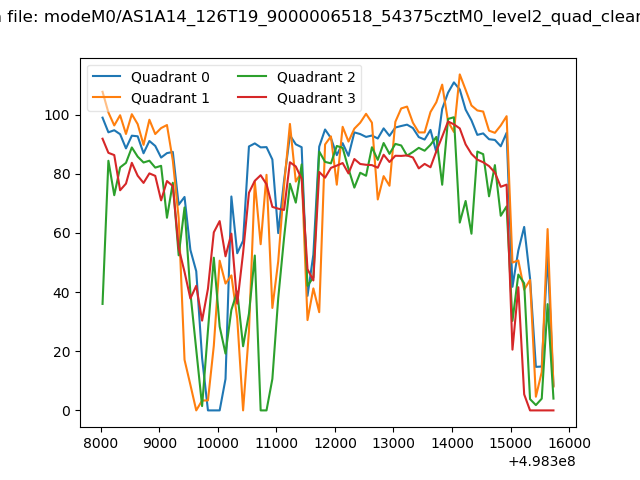
| Quadrant-wise count rates Data is divided into 100 sec bins |
 |
|
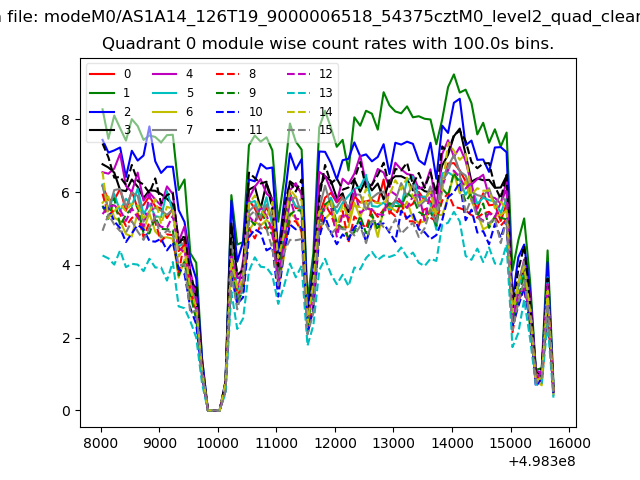
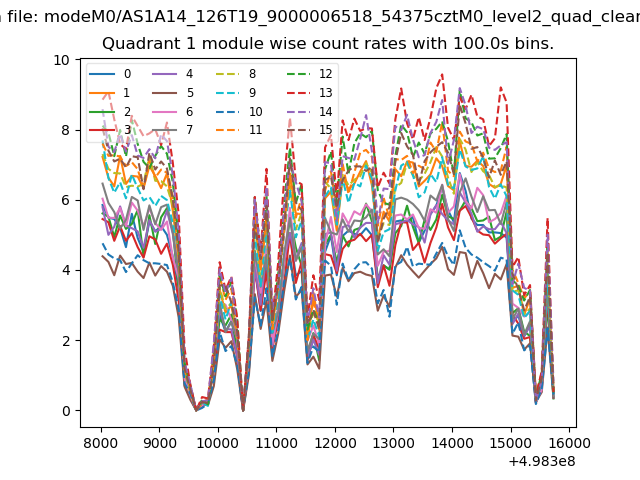
| Module-wise count rates for Quadrant A Data is divided into 100 sec bins |
 |
 |
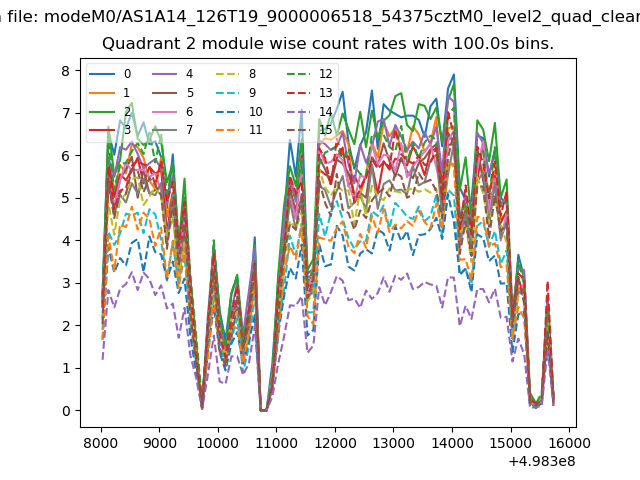
| Module-wise count rates for Quadrant B Data is divided into 100 sec bins |
 |
 |
| Module-wise count rates for Quadrant C Data is divided into 100 sec bins |
 |
 |
| Module-wise count rates for Quadrant D Data is divided into 100 sec bins |
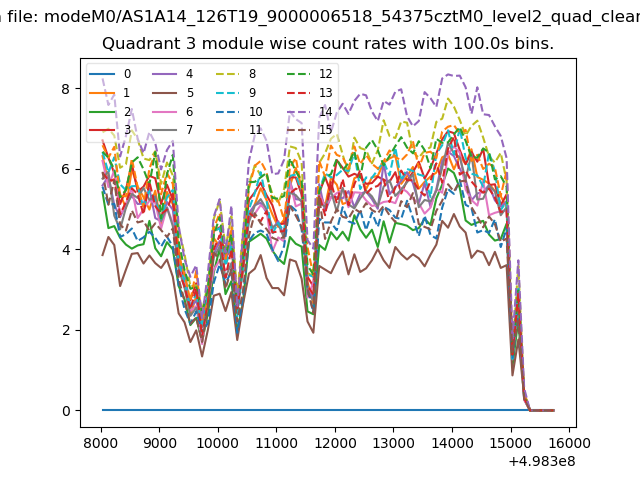 |
 |
| Parameter | Plot |
|---|---|
| CZT HV Monitor | 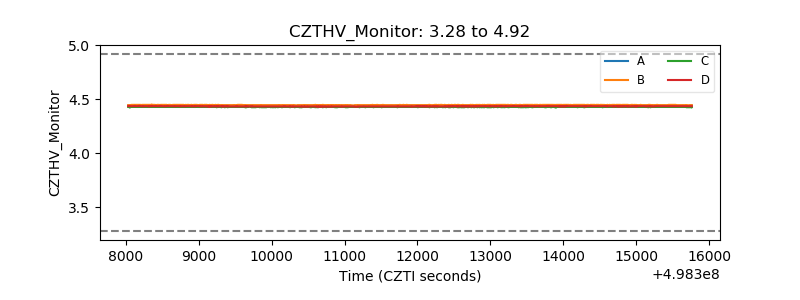 |
| D_VDD | 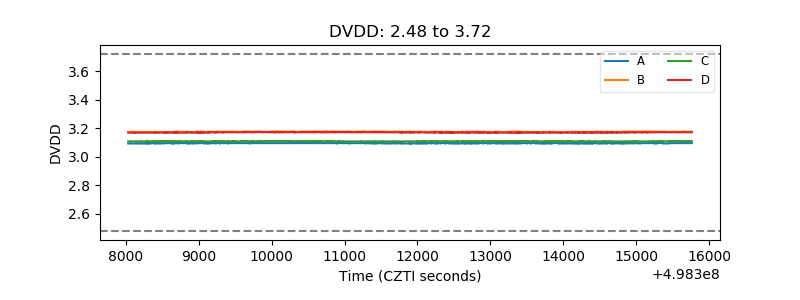 |
| Temperature 1 | 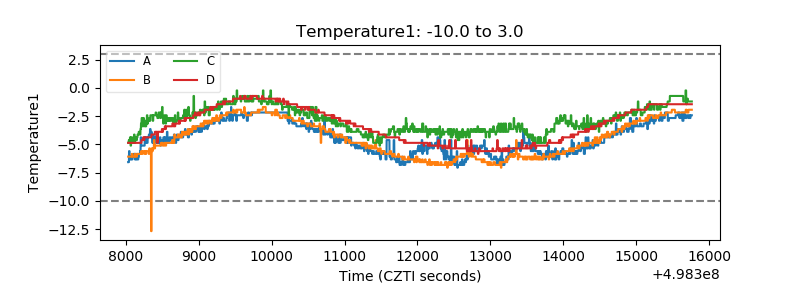 |
| Veto HV Monitor |  |
| Veto LLD | 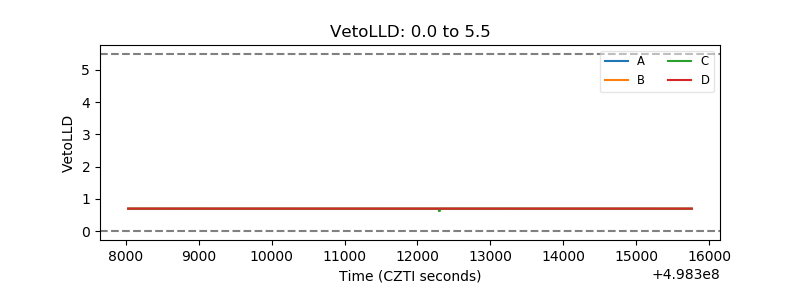 |
| Alpha Counter | 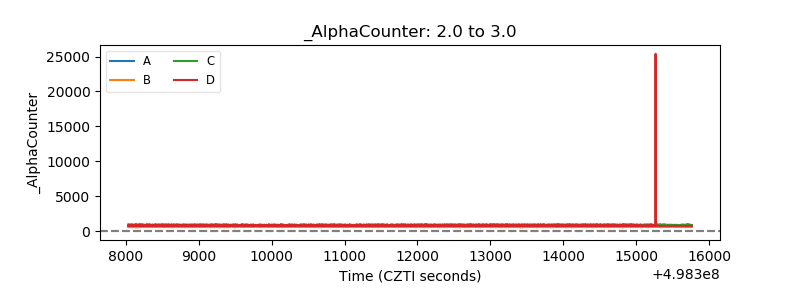 |
| _CPM_Rate | 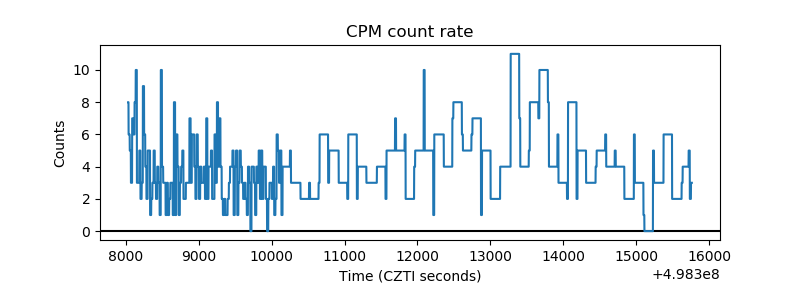 |
| CZT Counter | 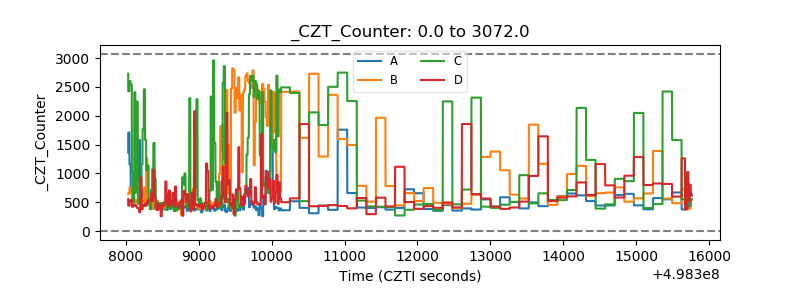 |
| +2.5 Volts monitor |  |
| +5 Volts monitor | 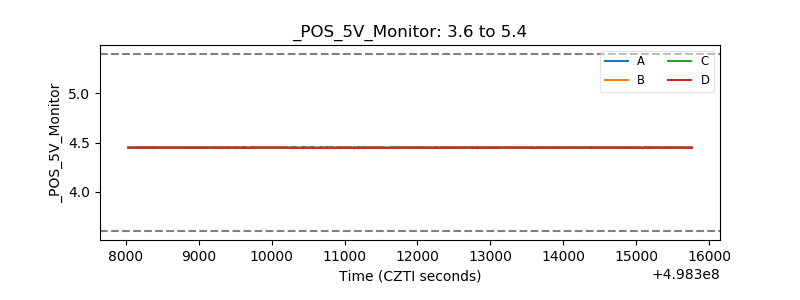 |
| _ROLL_ROT | 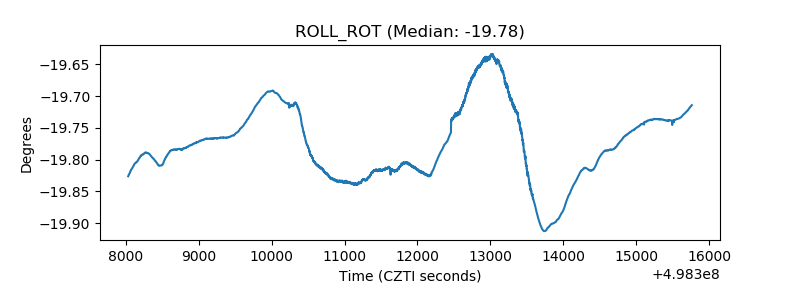 |
| _Roll_DEC | 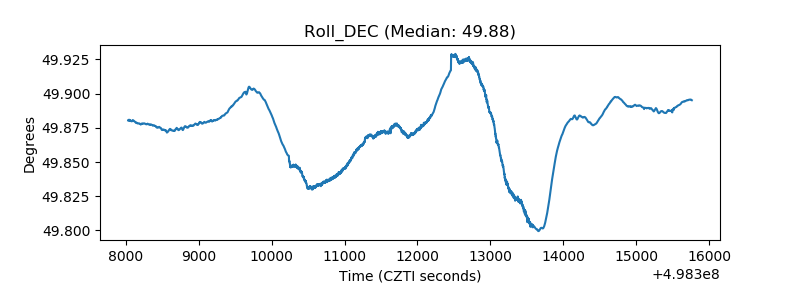 |
| _Roll_RA | 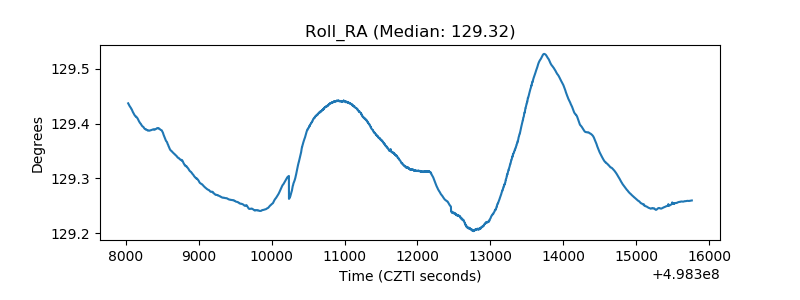 |
| Veto Counter | 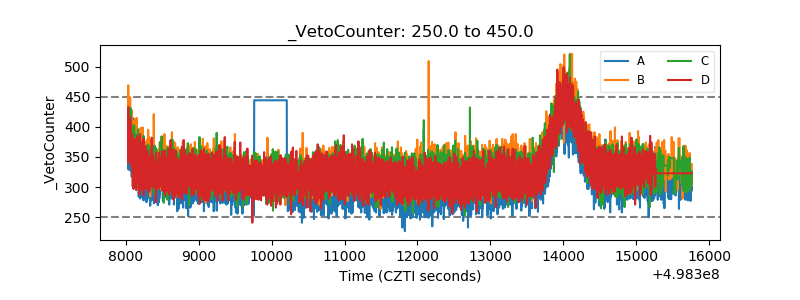 |