| Param | Original file | Final file |
|---|---|---|
| Filename | modeM0/AS1A14_126T19_9000006518_54376cztM0_level2.fits | modeM0/AS1A14_126T19_9000006518_54376cztM0_level2_quad_clean.evt |
| Size (bytes) | 708,906,240 | 95,106,240 |
| Size | 676.1 MB | 90.7 MB |
| Events in quadrant A | 3,303,426 | 686,028 |
| Events in quadrant B | 5,907,625 | 671,721 |
| Events in quadrant C | 9,090,653 | 482,061 |
| Events in quadrant D | 7,370,289 | 528,545 |
| Mode SS | |||
|---|---|---|---|
| Quadrant | BADHDUFLAG | Total packets | Discarded packets |
| A | 0 | 146 | 0 |
| B | 0 | 146 | 0 |
| C | 0 | 146 | 0 |
| D | 0 | 146 | 0 |
| Mode M0 | |||
|---|---|---|---|
| Quadrant | BADHDUFLAG | Total packets | Discarded packets |
| A | 0 | 15046 | 0 |
| B | 0 | 22408 | 0 |
| C | 0 | 32196 | 17 |
| D | 0 | 26867 | 0 |
| Quadrant | Total seconds | Saturated seconds | Saturation percentage |
|---|---|---|---|
| A | 7345 | 5 | 0.068074% |
| B | 7346 | 705 | 9.597060% |
| C | 7344 | 2101 | 28.608388% |
| D | 7346 | 1095 | 14.906071% |
Noise dominated data is calculated using 1-second bins in cleaned event files. If a bin has >2000 counts, and if more than 50% of those come from <1% of pixels, then it is considered to be noise-dominated and hence unusable.
| Quadrant | # 1 sec bins | Bins with >0 counts | Bins with >2000 counts | High rate bins dominated by noise | Noise dominated (total time) | Noise dominated (detector-on time) | Marked lightcurve |
|---|---|---|---|---|---|---|---|
| A | 7345 | 7345 | 1 | 1 | 0.01% | 0.01% | 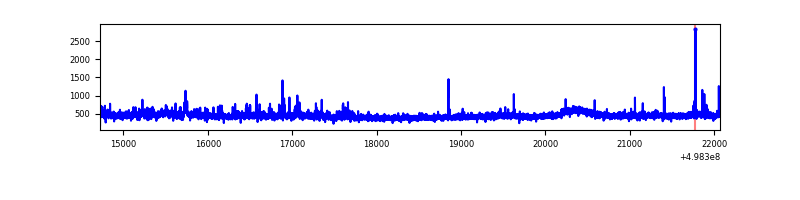 |
| B | 7346 | 7346 | 529 | 529 | 7.20% | 7.20% | 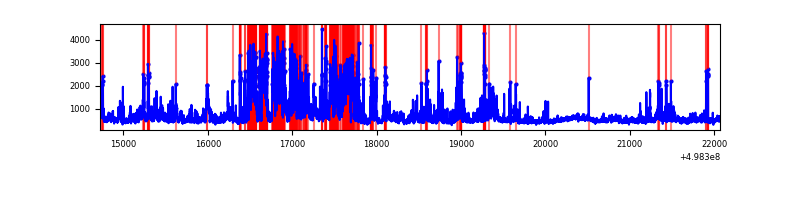 |
| C | 7346 | 7345 | 1946 | 1946 | 26.49% | 26.49% | 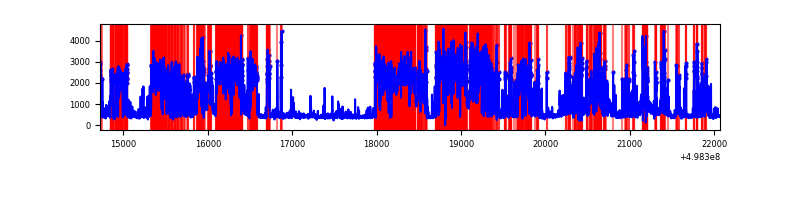 |
| D | 7346 | 7346 | 1073 | 1073 | 14.61% | 14.61% | 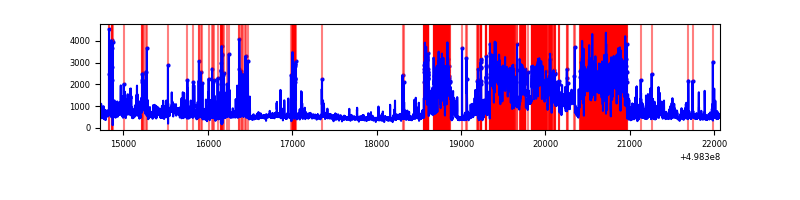 |
Top three noisy pixels from each quadrant. If the there are fewer than three noisy pixels in the level2.evt file, extra rows are filled as -1
| Pixel properties | Quadrant properties | ||||||
|---|---|---|---|---|---|---|---|
| Quadrant | DetID | PixID | Counts | Sigma | Mean | Median | Sigma |
| A | 7 | 206 | 94498 | 490.07 | 782 | 764 | 191.3 |
| A | 4 | 78 | 46658 | 239.95 | 782 | 764 | 191.3 |
| A | 5 | 243 | 24283 | 122.96 | 782 | 764 | 191.3 |
| B | 10 | 14 | 2162074 | 13476.3 | 742 | 714 | 160.4 |
| B | 7 | 0 | 399450 | 2486.16 | 742 | 714 | 160.4 |
| B | 12 | 18 | 136004 | 843.55 | 742 | 714 | 160.4 |
| C | 1 | 241 | 4398313 | 24203.11 | 673 | 668 | 181.7 |
| C | 12 | 2 | 939886 | 5169.13 | 673 | 668 | 181.7 |
| C | 1 | 29 | 603508 | 3317.82 | 673 | 668 | 181.7 |
| D | 8 | 176 | 3667843 | 18140.39 | 714 | 682 | 202.2 |
| D | 12 | 3 | 261585 | 1290.61 | 714 | 682 | 202.2 |
| D | 15 | 217 | 256031 | 1263.14 | 714 | 682 | 202.2 |
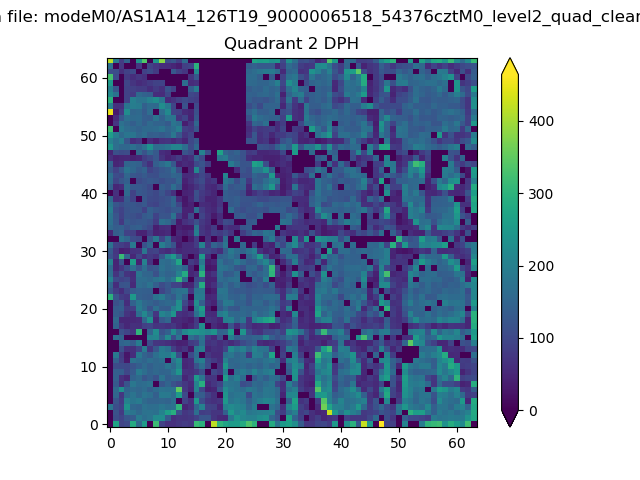
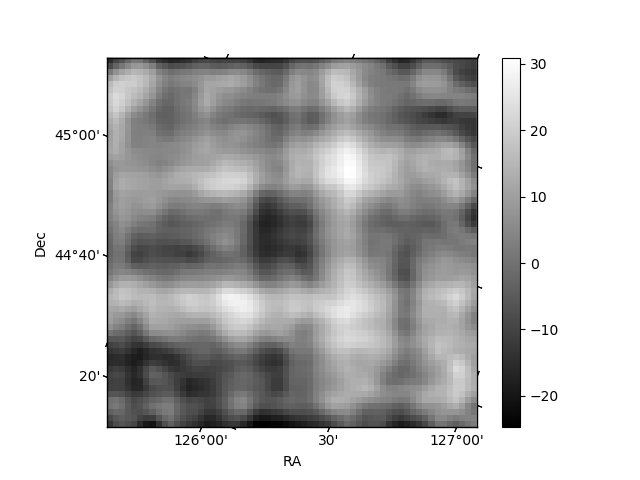
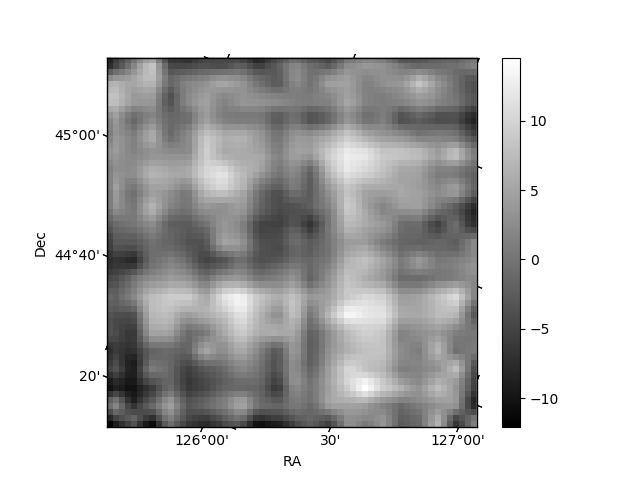
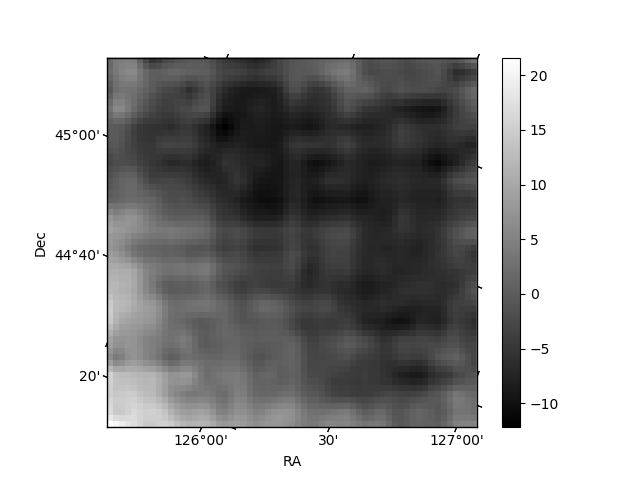
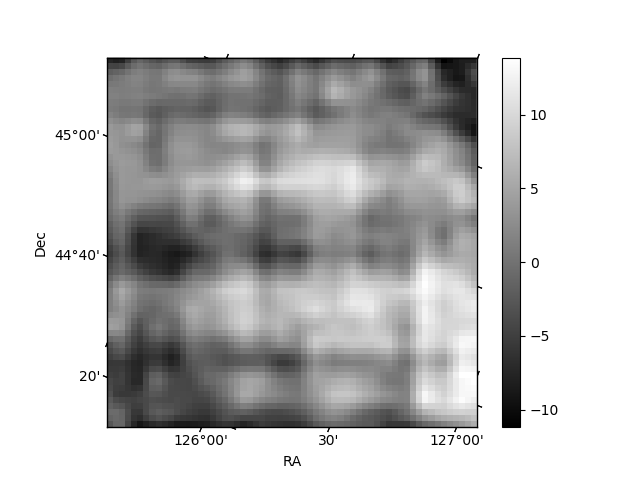
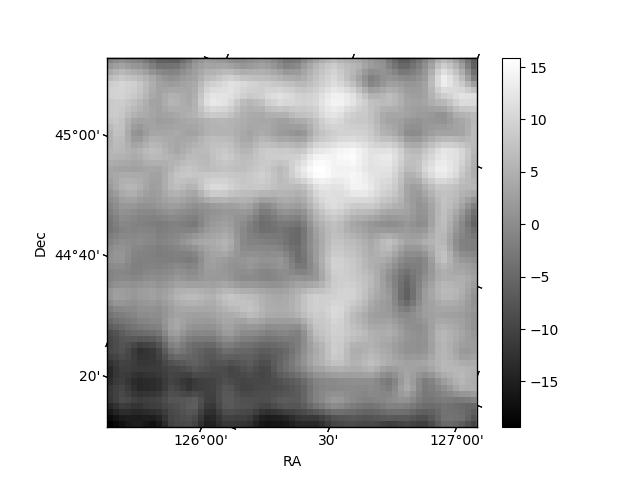
Histogram calculated using DETX and DETY for each event in the final _common_clean file
| Quadrant A | 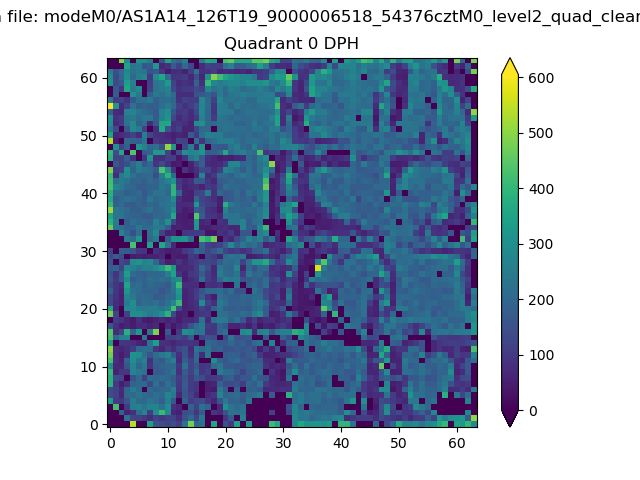 |
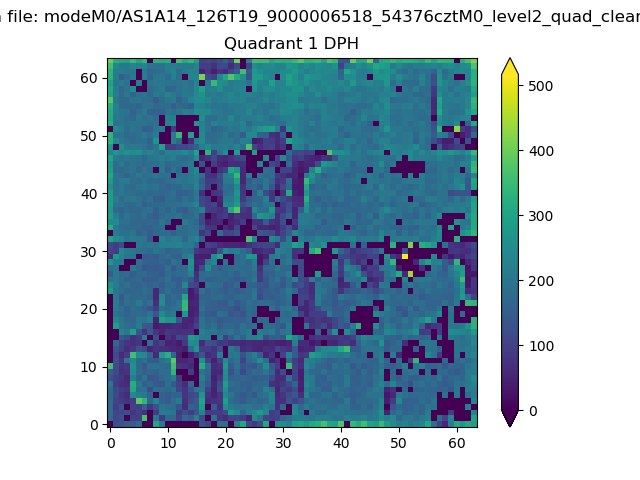 |
Quadrant B |
|---|---|---|---|
| Quadrant D | 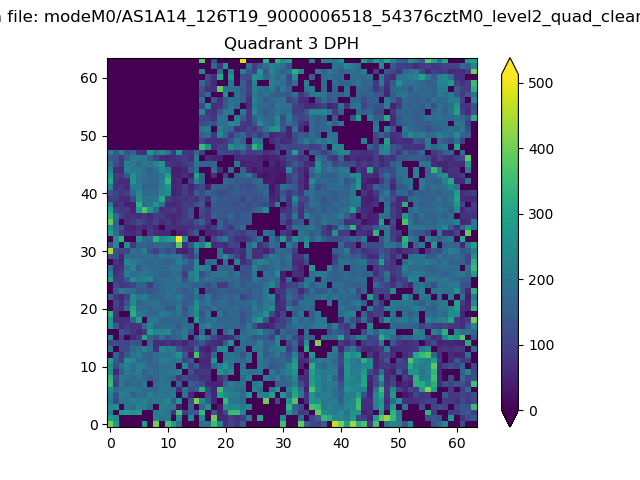 |
 |
Quadrant C |
| Plot type | Count rate plots | Images |
|---|---|---|
| Comparison with Poisson distribution Blue bars denote a histogram of data divided into 1 sec bins. Red curve is a Poisson curve with rate = median count rate of data. |
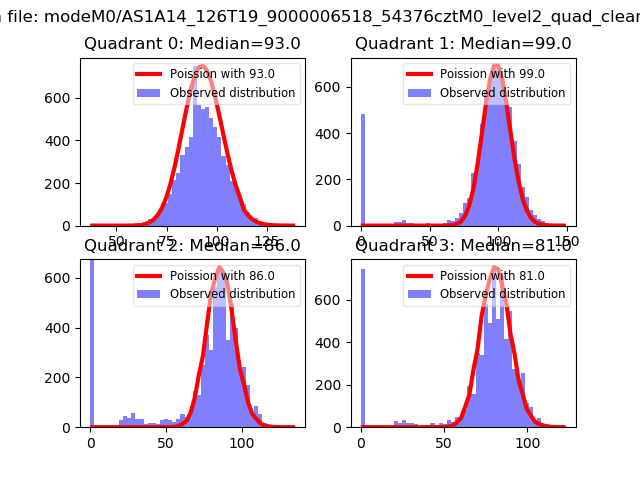 |
 |
| Quadrant-wise count rates Data is divided into 100 sec bins |
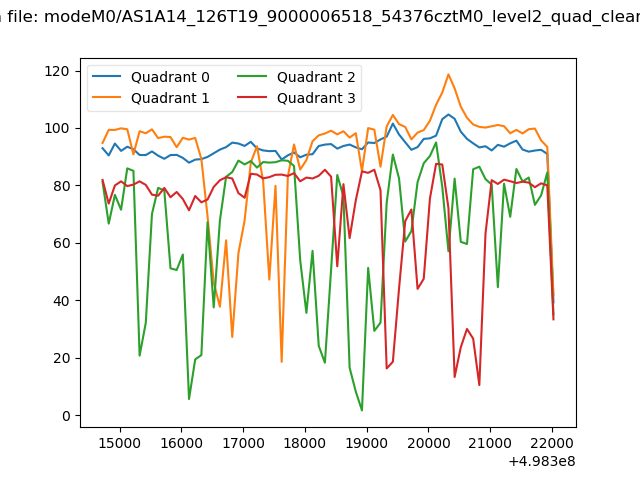 |
|
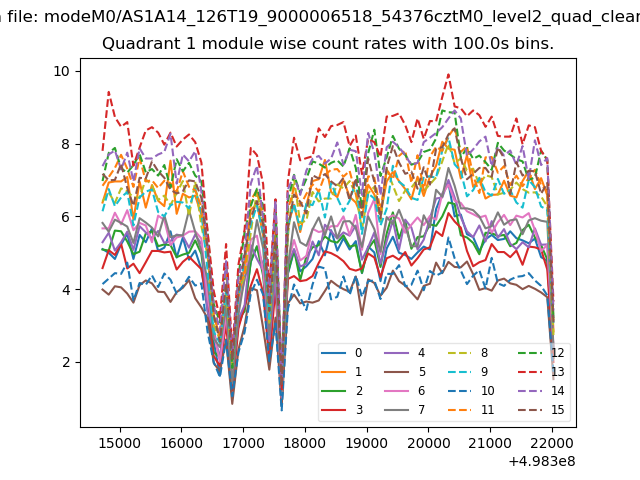
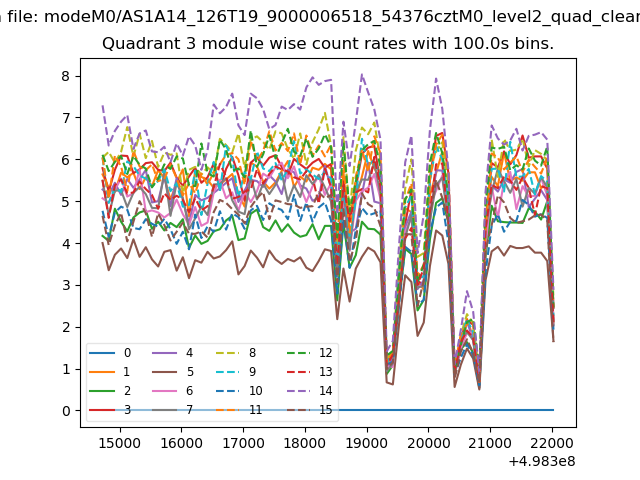
| Module-wise count rates for Quadrant A Data is divided into 100 sec bins |
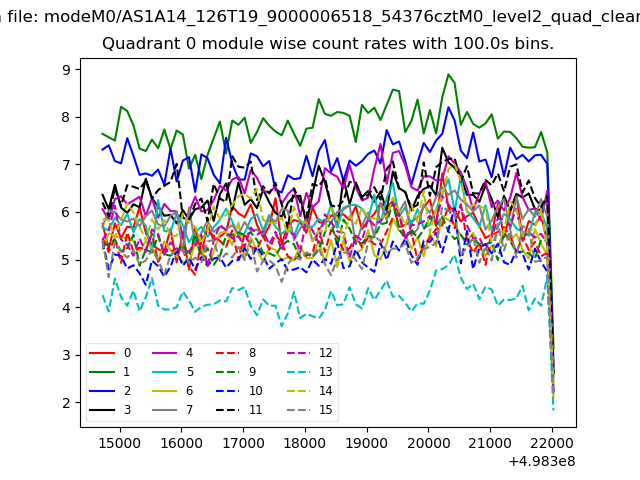 |
 |
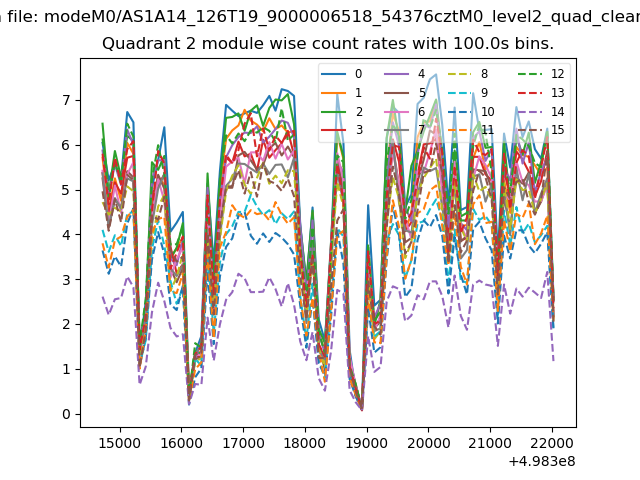
| Module-wise count rates for Quadrant B Data is divided into 100 sec bins |
 |
 |
| Module-wise count rates for Quadrant C Data is divided into 100 sec bins |
 |
 |
| Module-wise count rates for Quadrant D Data is divided into 100 sec bins |
 |
 |
| Parameter | Plot |
|---|---|
| CZT HV Monitor | 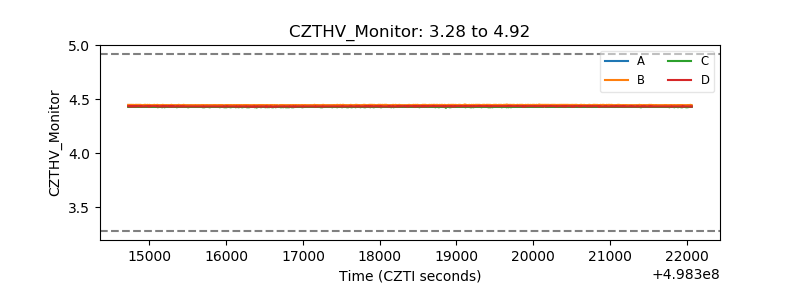 |
| D_VDD | 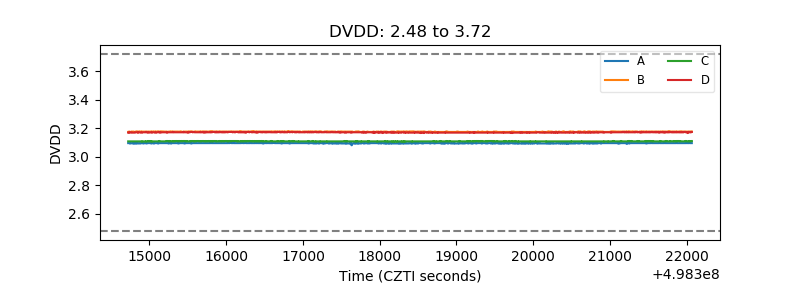 |
| Temperature 1 | 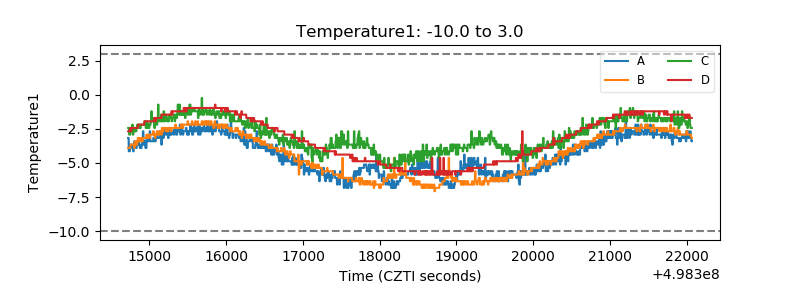 |
| Veto HV Monitor | 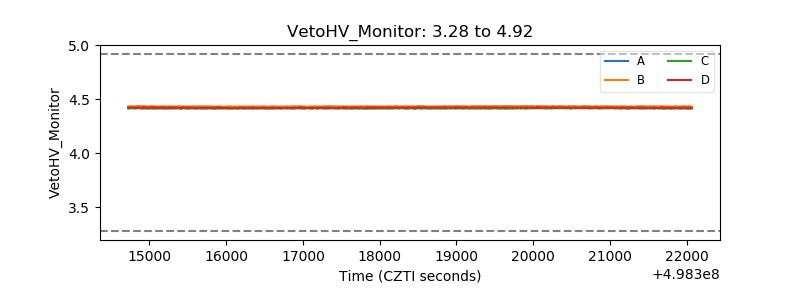 |
| Veto LLD | 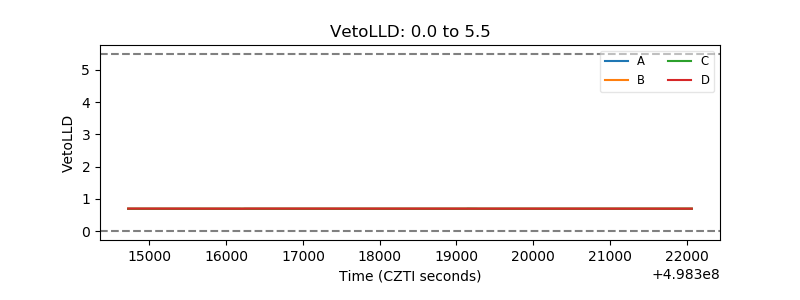 |
| Alpha Counter | 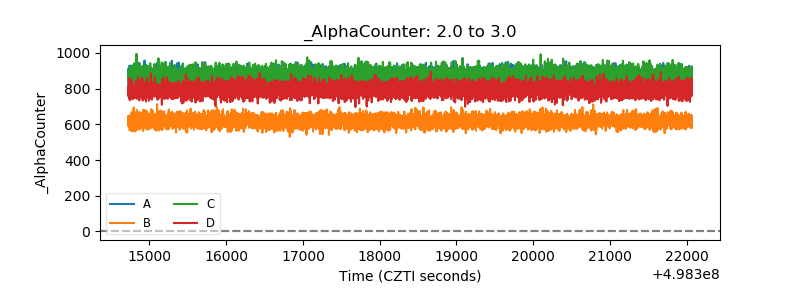 |
| _CPM_Rate | 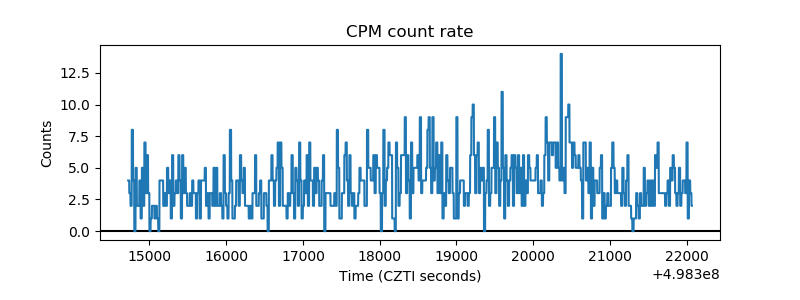 |
| CZT Counter | 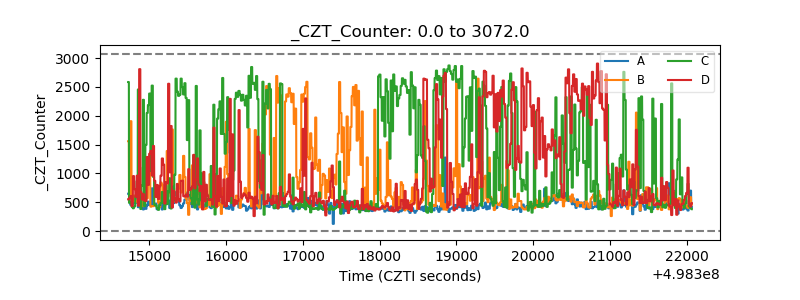 |
| +2.5 Volts monitor |  |
| +5 Volts monitor | 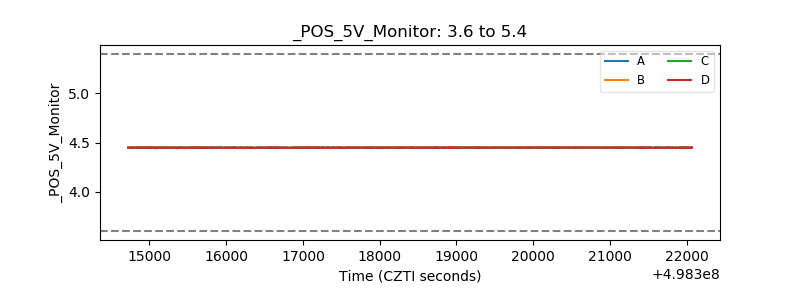 |
| _ROLL_ROT | 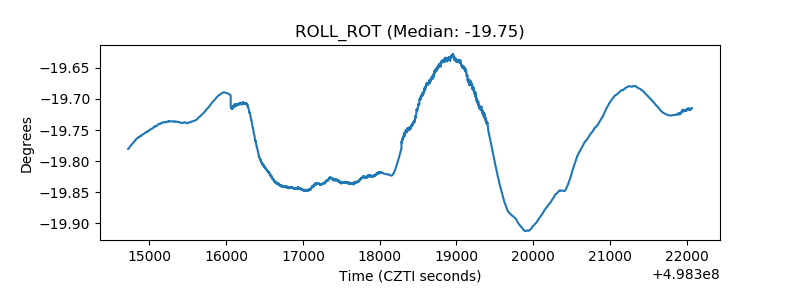 |
| _Roll_DEC | 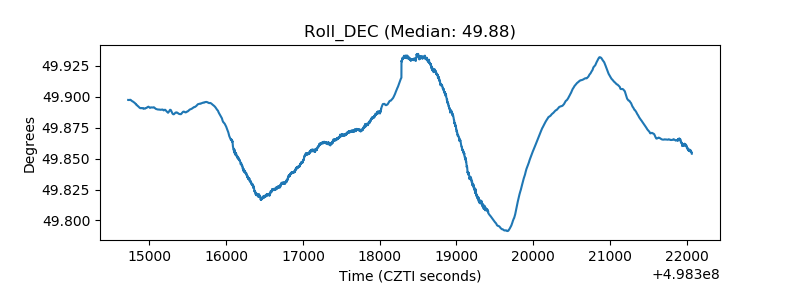 |
| _Roll_RA | 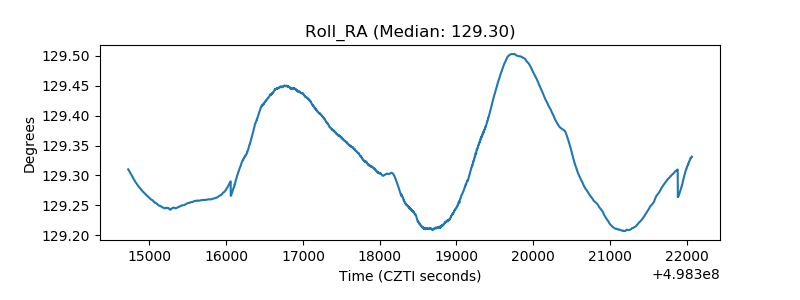 |
| Veto Counter | 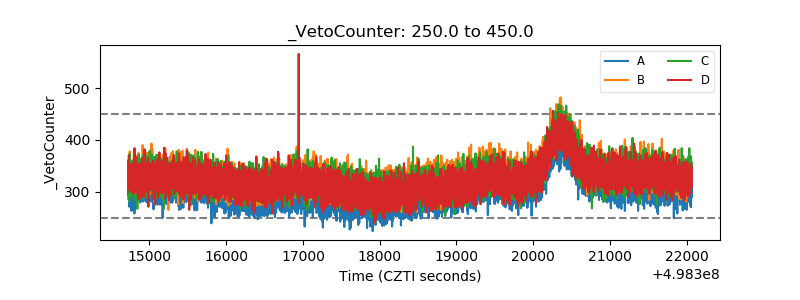 |