| Param | Original file | Final file |
|---|---|---|
| Filename | modeM0/AS1A14_126T19_9000006518_54379cztM0_level2.fits | modeM0/AS1A14_126T19_9000006518_54379cztM0_level2_quad_clean.evt |
| Size (bytes) | 790,488,000 | 104,840,640 |
| Size | 753.9 MB | 100.0 MB |
| Events in quadrant A | 3,771,952 | 770,027 |
| Events in quadrant B | 6,688,029 | 742,790 |
| Events in quadrant C | 12,006,269 | 451,343 |
| Events in quadrant D | 6,159,788 | 640,596 |
| Mode SS | |||
|---|---|---|---|
| Quadrant | BADHDUFLAG | Total packets | Discarded packets |
| A | 0 | 164 | 0 |
| B | 0 | 164 | 0 |
| C | 0 | 164 | 0 |
| D | 0 | 164 | 0 |
| Mode M0 | |||
|---|---|---|---|
| Quadrant | BADHDUFLAG | Total packets | Discarded packets |
| A | 0 | 17010 | 0 |
| B | 0 | 25515 | 0 |
| C | 0 | 41433 | 0 |
| D | 0 | 23929 | 0 |
| Quadrant | Total seconds | Saturated seconds | Saturation percentage |
|---|---|---|---|
| A | 8193 | 38 | 0.463811% |
| B | 8193 | 984 | 12.010253% |
| C | 8194 | 3353 | 40.920186% |
| D | 8194 | 572 | 6.980718% |
Noise dominated data is calculated using 1-second bins in cleaned event files. If a bin has >2000 counts, and if more than 50% of those come from <1% of pixels, then it is considered to be noise-dominated and hence unusable.
| Quadrant | # 1 sec bins | Bins with >0 counts | Bins with >2000 counts | High rate bins dominated by noise | Noise dominated (total time) | Noise dominated (detector-on time) | Marked lightcurve |
|---|---|---|---|---|---|---|---|
| A | 8193 | 8193 | 9 | 9 | 0.11% | 0.11% | 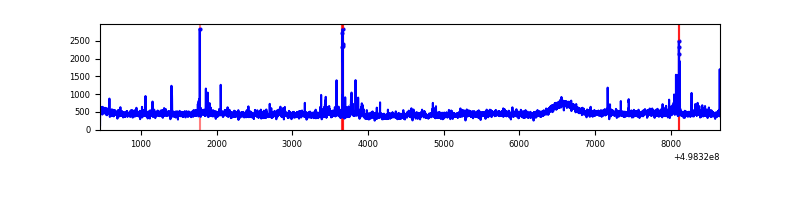 |
| B | 8193 | 8193 | 698 | 698 | 8.52% | 8.52% | 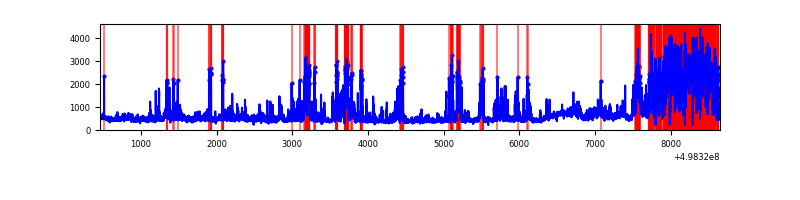 |
| C | 8194 | 8194 | 3012 | 3012 | 36.76% | 36.76% | 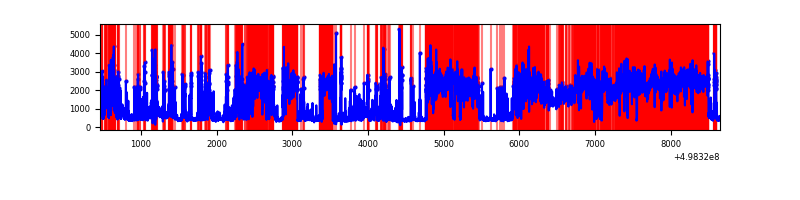 |
| D | 8194 | 8194 | 505 | 505 | 6.16% | 6.16% | 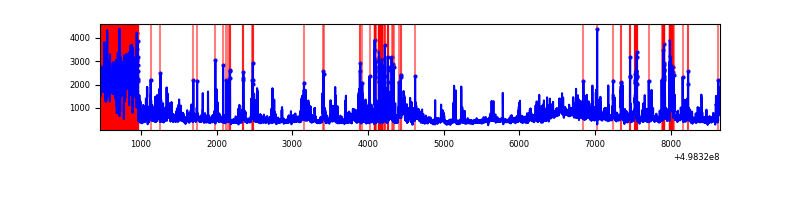 |
Top three noisy pixels from each quadrant. If the there are fewer than three noisy pixels in the level2.evt file, extra rows are filled as -1
| Pixel properties | Quadrant properties | ||||||
|---|---|---|---|---|---|---|---|
| Quadrant | DetID | PixID | Counts | Sigma | Mean | Median | Sigma |
| A | 3 | 130 | 53960 | 241.41 | 895 | 871 | 219.9 |
| A | 7 | 206 | 52277 | 233.76 | 895 | 871 | 219.9 |
| A | 5 | 243 | 47505 | 212.06 | 895 | 871 | 219.9 |
| B | 10 | 14 | 2614254 | 14540.97 | 836 | 804 | 179.7 |
| B | 7 | 0 | 340625 | 1890.73 | 836 | 804 | 179.7 |
| B | 0 | 213 | 140031 | 774.64 | 836 | 804 | 179.7 |
| C | 1 | 241 | 7350675 | 37028.85 | 733 | 725 | 198.5 |
| C | 12 | 2 | 975046 | 4908.6 | 733 | 725 | 198.5 |
| C | 13 | 16 | 320414 | 1610.58 | 733 | 725 | 198.5 |
| D | 8 | 176 | 1619983 | 6780.83 | 846 | 806 | 238.8 |
| D | 12 | 3 | 421807 | 1763.08 | 846 | 806 | 238.8 |
| D | 7 | 70 | 182153 | 759.45 | 846 | 806 | 238.8 |
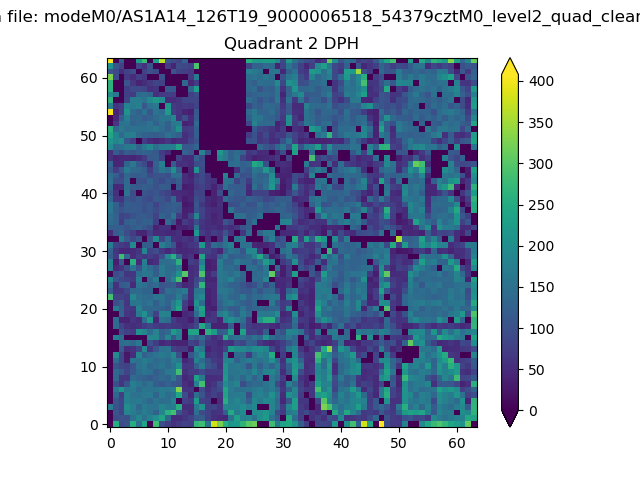
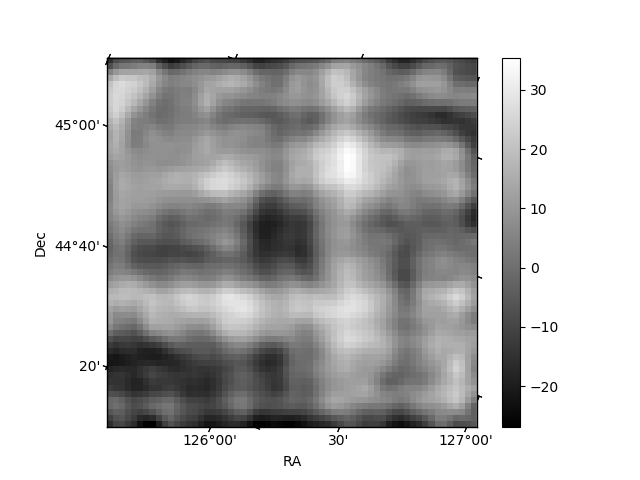
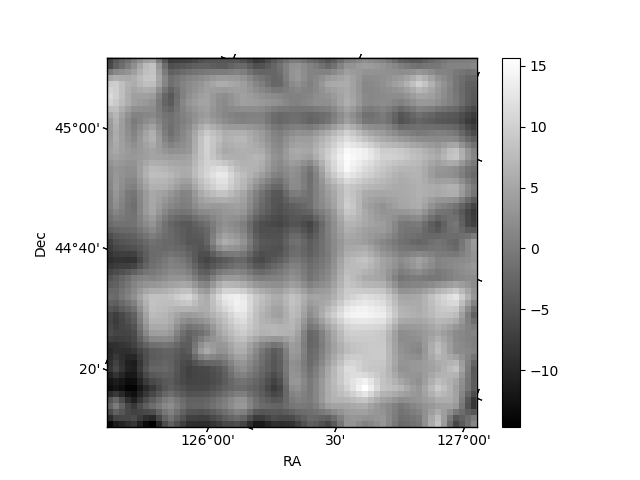
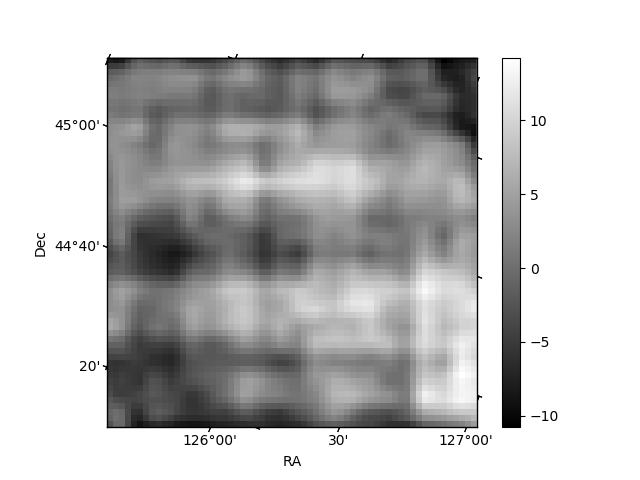
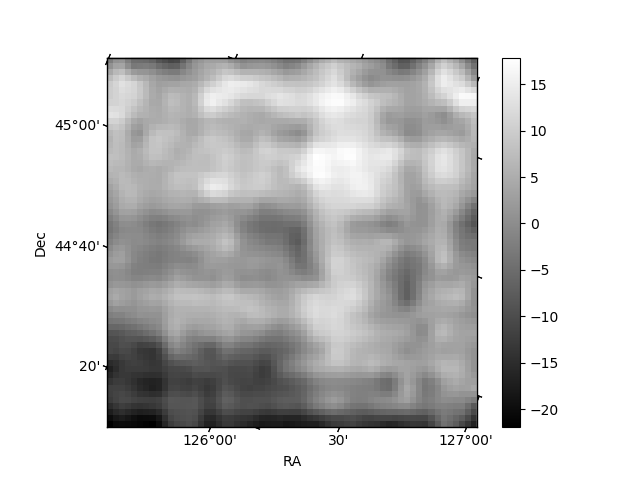
Histogram calculated using DETX and DETY for each event in the final _common_clean file
| Quadrant A | 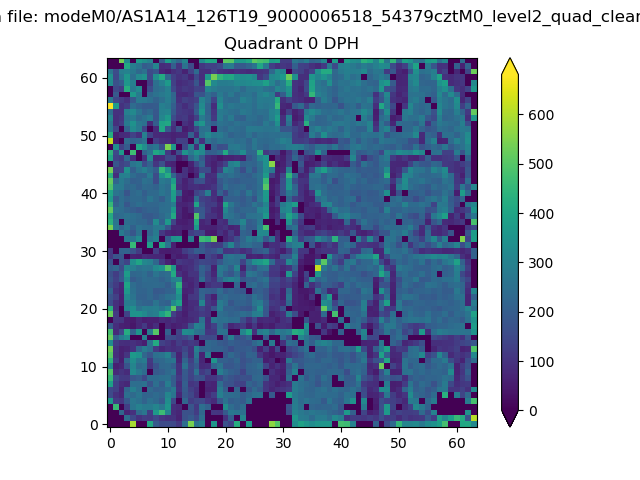 |
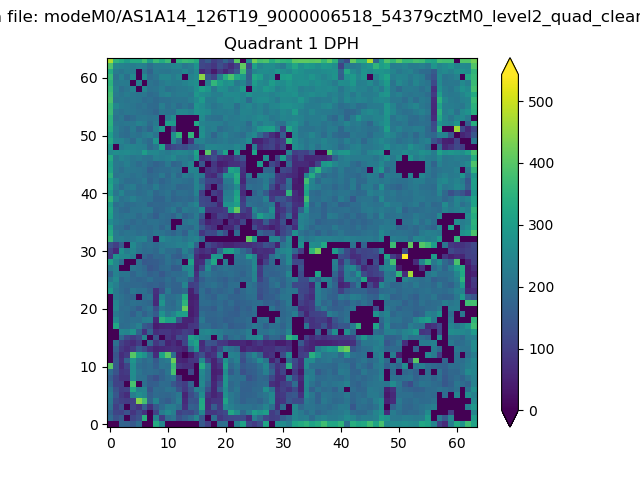 |
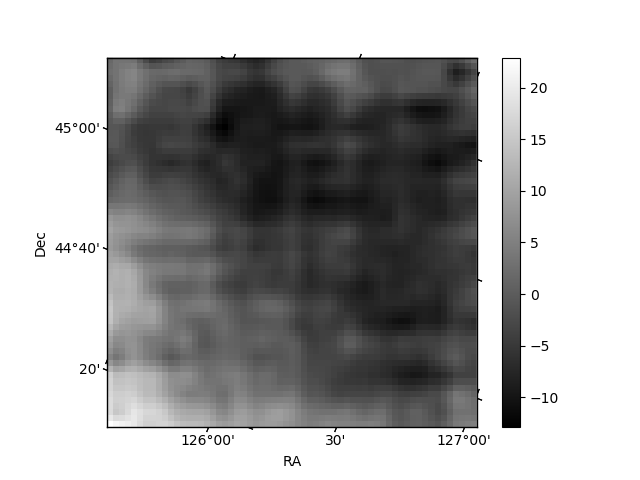
Quadrant B |
|---|---|---|---|
| Quadrant D | 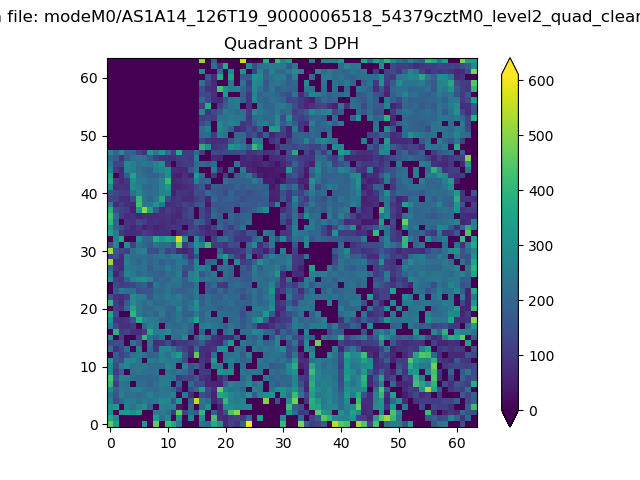 |
 |
Quadrant C |
| Plot type | Count rate plots | Images |
|---|---|---|
| Comparison with Poisson distribution Blue bars denote a histogram of data divided into 1 sec bins. Red curve is a Poisson curve with rate = median count rate of data. |
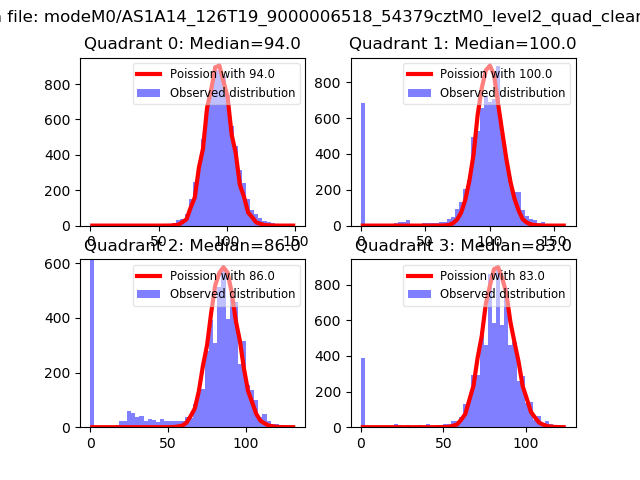 |
 |
| Quadrant-wise count rates Data is divided into 100 sec bins |
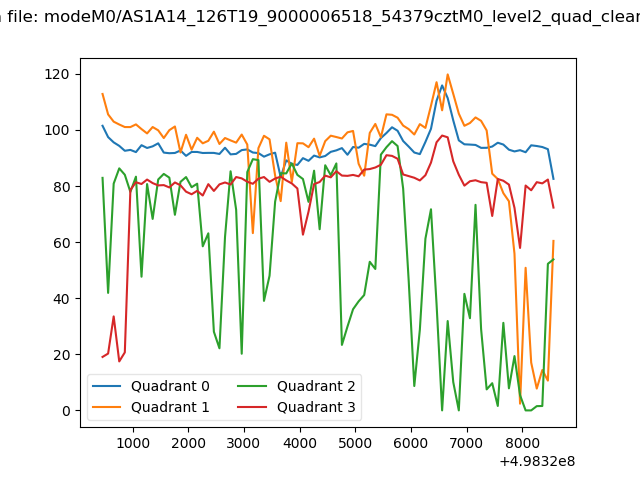 |
|
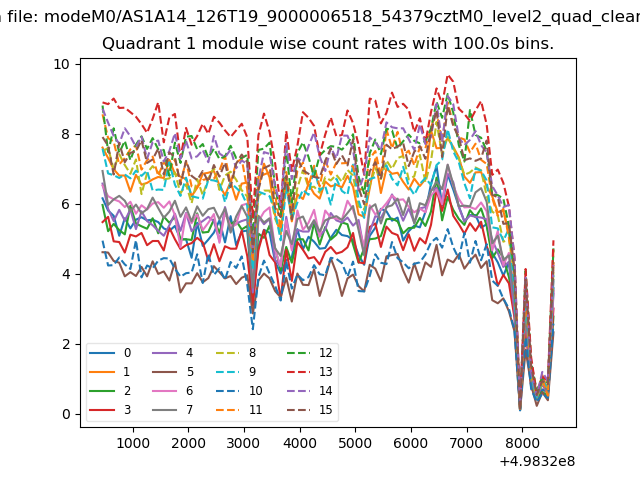
| Module-wise count rates for Quadrant A Data is divided into 100 sec bins |
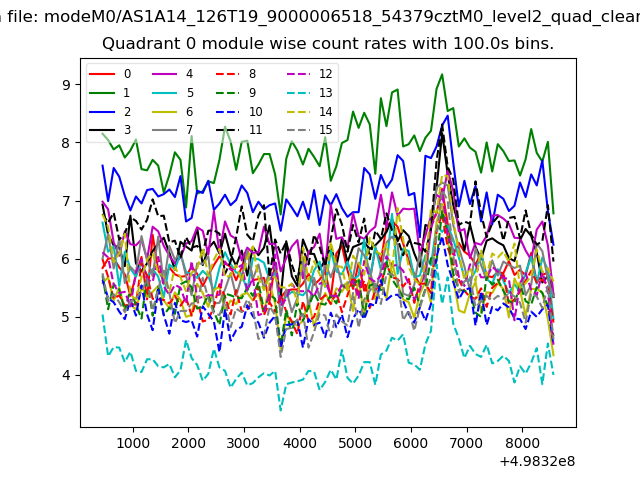 |
 |
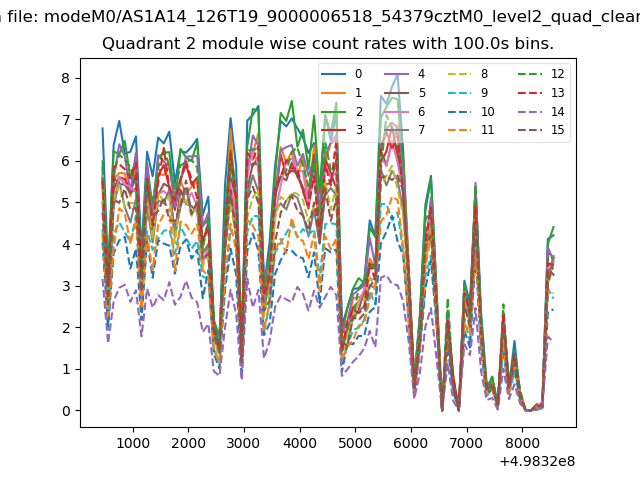
| Module-wise count rates for Quadrant B Data is divided into 100 sec bins |
 |
 |
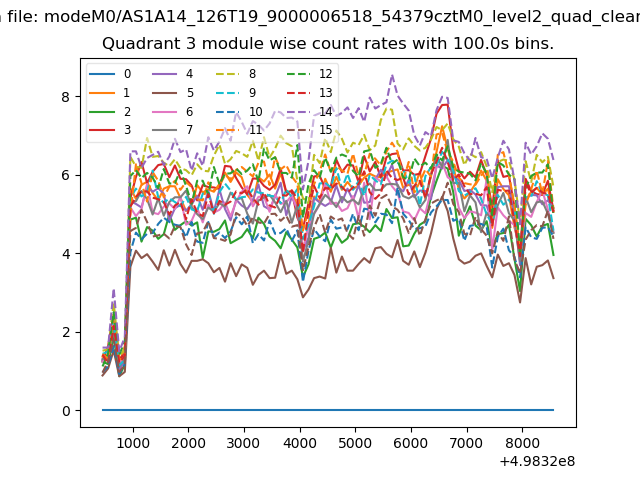
| Module-wise count rates for Quadrant C Data is divided into 100 sec bins |
 |
 |
| Module-wise count rates for Quadrant D Data is divided into 100 sec bins |
 |
 |
| Parameter | Plot |
|---|---|
| CZT HV Monitor | 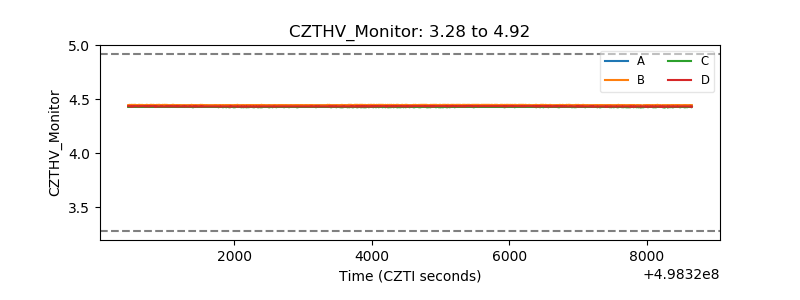 |
| D_VDD | 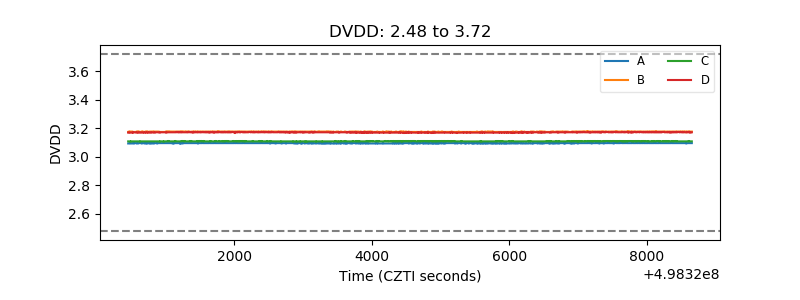 |
| Temperature 1 | 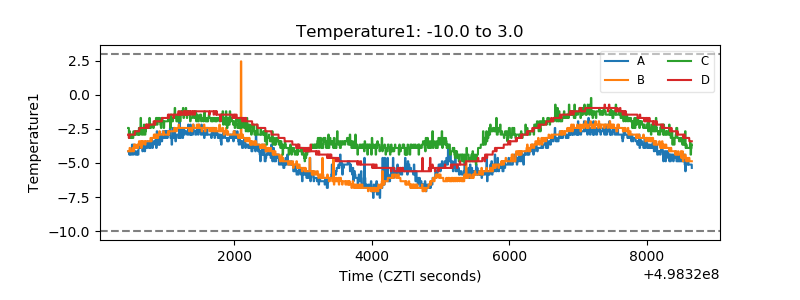 |
| Veto HV Monitor | 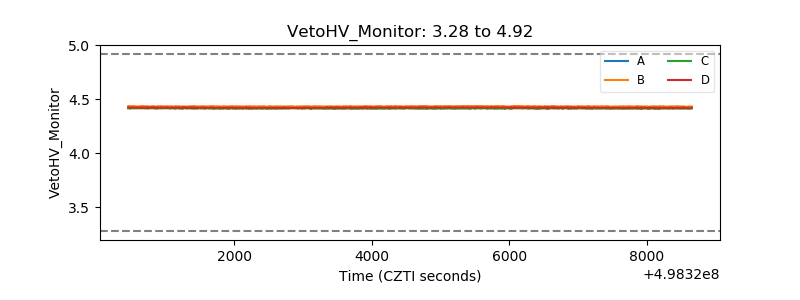 |
| Veto LLD | 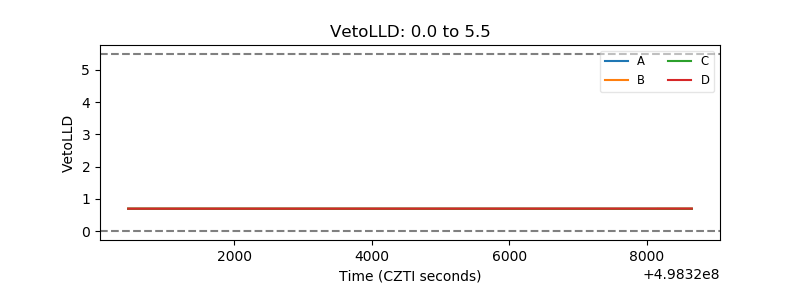 |
| Alpha Counter | 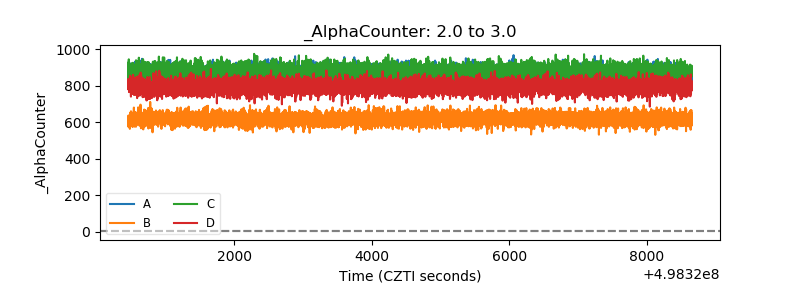 |
| _CPM_Rate | 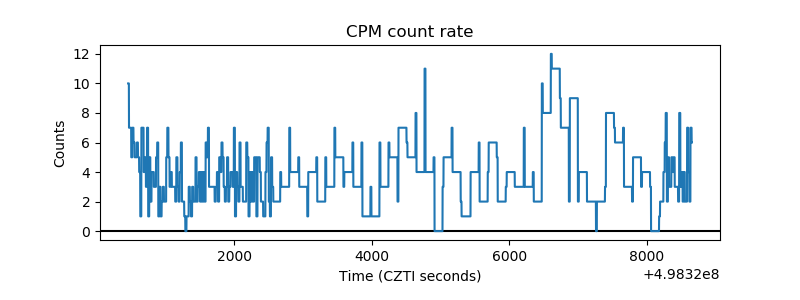 |
| CZT Counter | 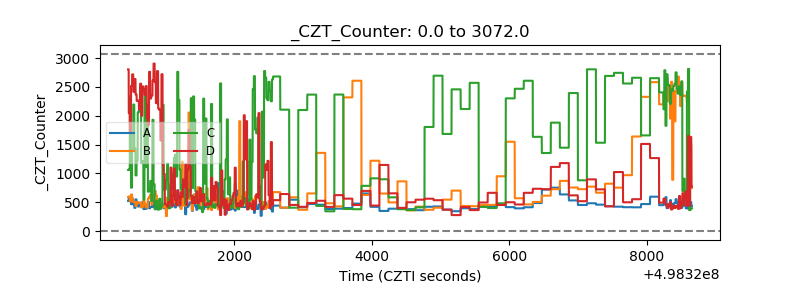 |
| +2.5 Volts monitor | 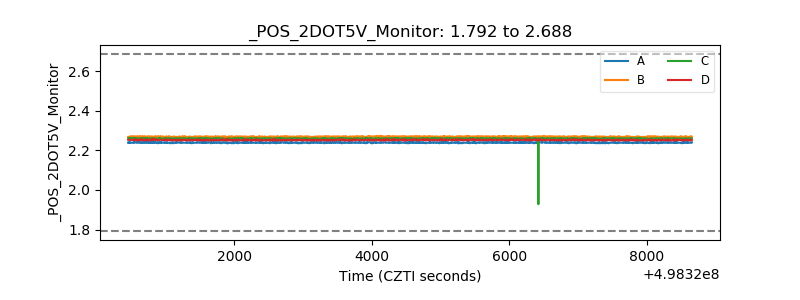 |
| +5 Volts monitor | 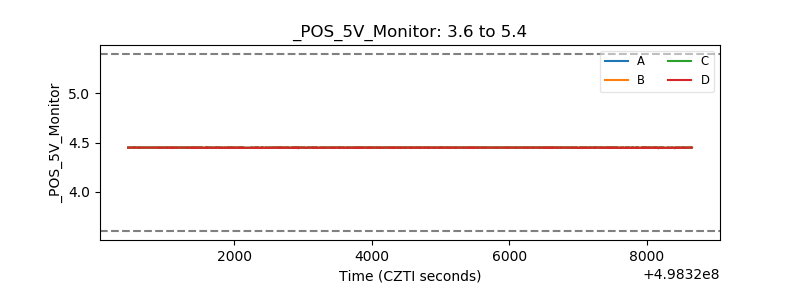 |
| _ROLL_ROT | 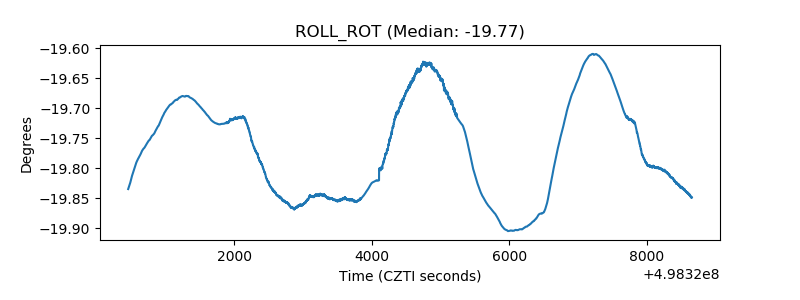 |
| _Roll_DEC | 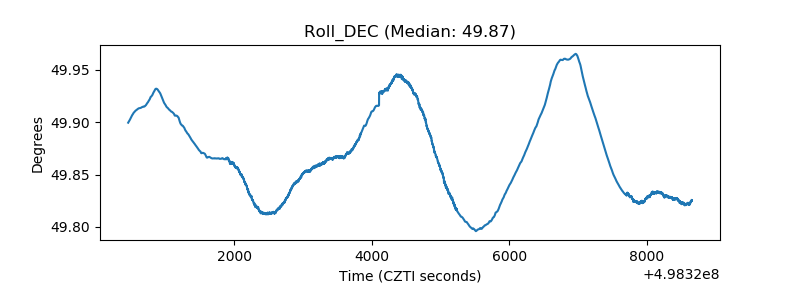 |
| _Roll_RA | 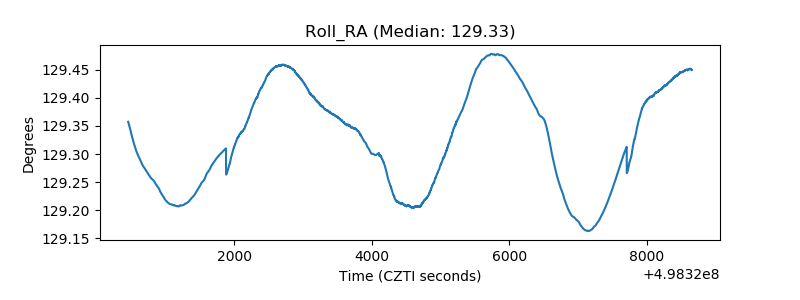 |
| Veto Counter | 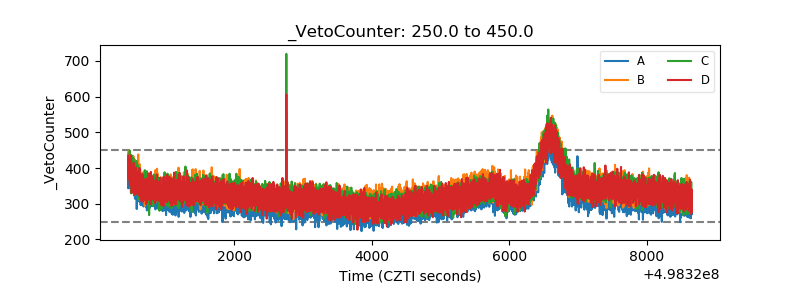 |