| Param | Original file | Final file |
|---|---|---|
| Filename | modeM0/AS1A14_126T19_9000006518_54381cztM0_level2.fits | modeM0/AS1A14_126T19_9000006518_54381cztM0_level2_quad_clean.evt |
| Size (bytes) | 620,665,920 | 86,100,480 |
| Size | 591.9 MB | 82.1 MB |
| Events in quadrant A | 2,871,443 | 617,455 |
| Events in quadrant B | 9,094,805 | 459,001 |
| Events in quadrant C | 5,449,769 | 532,404 |
| Events in quadrant D | 5,049,860 | 540,143 |
| Mode SS | |||
|---|---|---|---|
| Quadrant | BADHDUFLAG | Total packets | Discarded packets |
| A | 0 | 134 | 0 |
| B | 0 | 134 | 0 |
| C | 0 | 134 | 0 |
| D | 0 | 134 | 0 |
| Mode M0 | |||
|---|---|---|---|
| Quadrant | BADHDUFLAG | Total packets | Discarded packets |
| A | 0 | 13620 | 1 |
| B | 0 | 31506 | 3 |
| C | 0 | 21090 | 1 |
| D | 0 | 19649 | 1 |
| Mode M9 | |||
|---|---|---|---|
| Quadrant | BADHDUFLAG | Total packets | Discarded packets |
| A | 0 | 9 | 0 |
| B | 0 | 9 | 0 |
| C | 0 | 9 | 0 |
| D | 0 | 9 | 0 |
| Quadrant | Total seconds | Saturated seconds | Saturation percentage |
|---|---|---|---|
| A | 6561 | 56 | 0.853528% |
| B | 6560 | 2292 | 34.939024% |
| C | 6560 | 809 | 12.332317% |
| D | 6560 | 335 | 5.106707% |
Noise dominated data is calculated using 1-second bins in cleaned event files. If a bin has >2000 counts, and if more than 50% of those come from <1% of pixels, then it is considered to be noise-dominated and hence unusable.
| Quadrant | # 1 sec bins | Bins with >0 counts | Bins with >2000 counts | High rate bins dominated by noise | Noise dominated (total time) | Noise dominated (detector-on time) | Marked lightcurve |
|---|---|---|---|---|---|---|---|
| A | 7491 | 6562 | 30 | 30 | 0.40% | 0.46% | 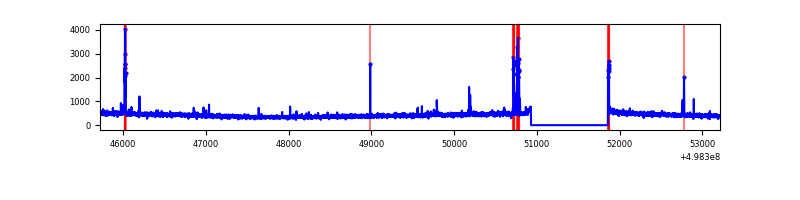 |
| B | 7490 | 6560 | 1824 | 1824 | 24.35% | 27.80% | 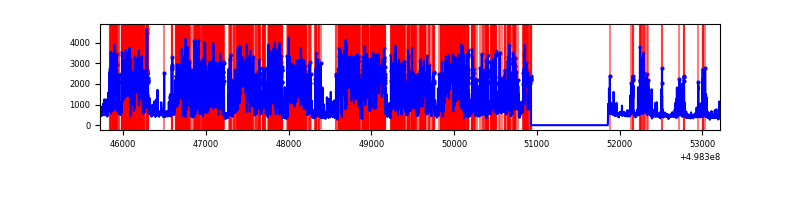 |
| C | 7490 | 6561 | 730 | 730 | 9.75% | 11.13% | 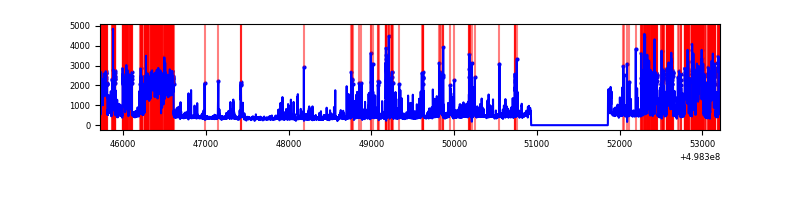 |
| D | 7490 | 6561 | 294 | 294 | 3.93% | 4.48% | 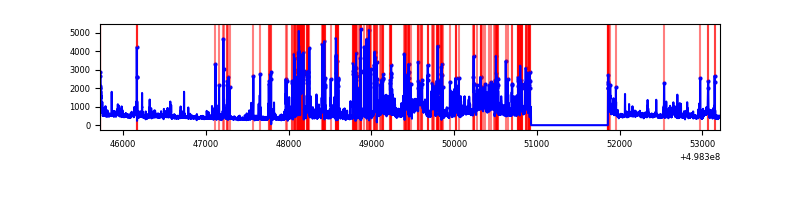 |
Top three noisy pixels from each quadrant. If the there are fewer than three noisy pixels in the level2.evt file, extra rows are filled as -1
| Pixel properties | Quadrant properties | ||||||
|---|---|---|---|---|---|---|---|
| Quadrant | DetID | PixID | Counts | Sigma | Mean | Median | Sigma |
| A | 0 | 8 | 90322 | 529.16 | 691 | 674 | 169.4 |
| A | 8 | 246 | 46925 | 273.0 | 691 | 674 | 169.4 |
| A | 3 | 62 | 26323 | 151.4 | 691 | 674 | 169.4 |
| B | 10 | 14 | 6445546 | 51041.46 | 583 | 562 | 126.3 |
| B | 7 | 0 | 92993 | 732.01 | 583 | 562 | 126.3 |
| B | 0 | 213 | 61353 | 481.44 | 583 | 562 | 126.3 |
| C | 1 | 241 | 1836344 | 10198.28 | 653 | 648 | 180.0 |
| C | 14 | 254 | 303582 | 1682.96 | 653 | 648 | 180.0 |
| C | 13 | 3 | 252706 | 1400.32 | 653 | 648 | 180.0 |
| D | 8 | 176 | 1999840 | 10660.48 | 661 | 631 | 187.5 |
| D | 3 | 12 | 112481 | 596.42 | 661 | 631 | 187.5 |
| D | 12 | 3 | 89433 | 473.52 | 661 | 631 | 187.5 |
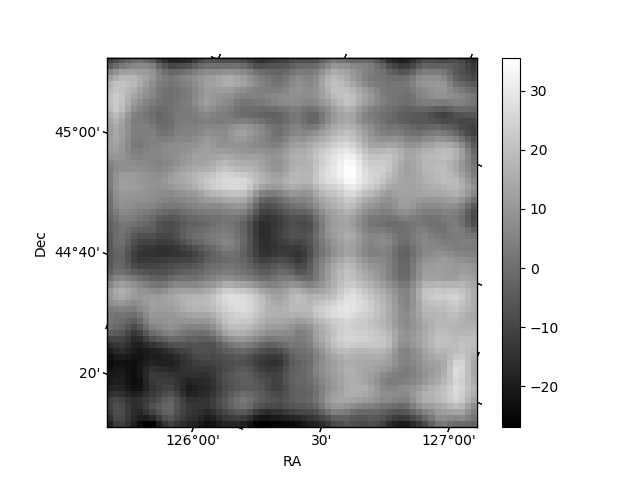
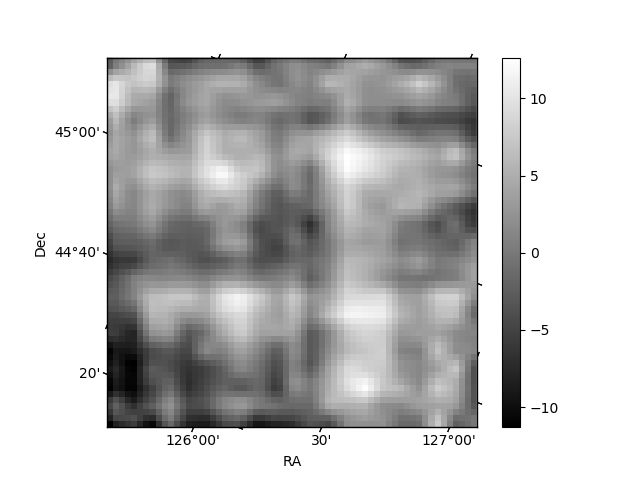
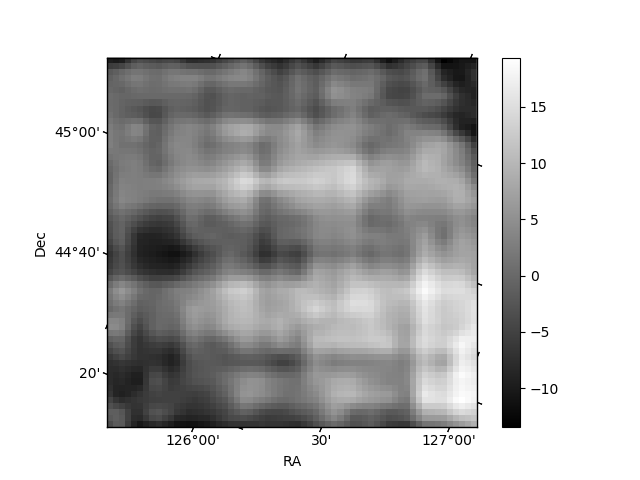
Histogram calculated using DETX and DETY for each event in the final _common_clean file
| Quadrant A | 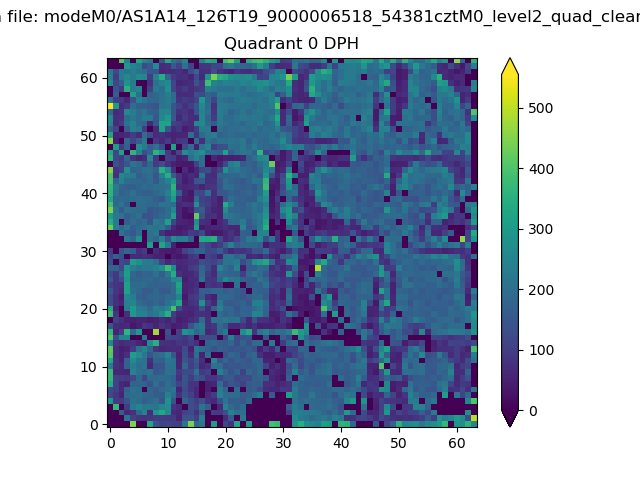 |
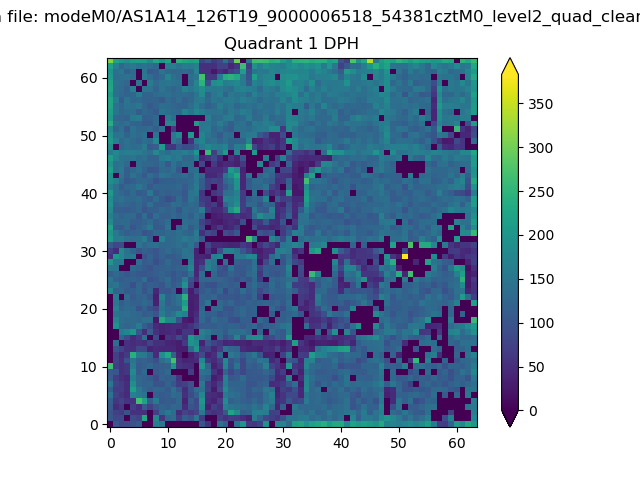 |
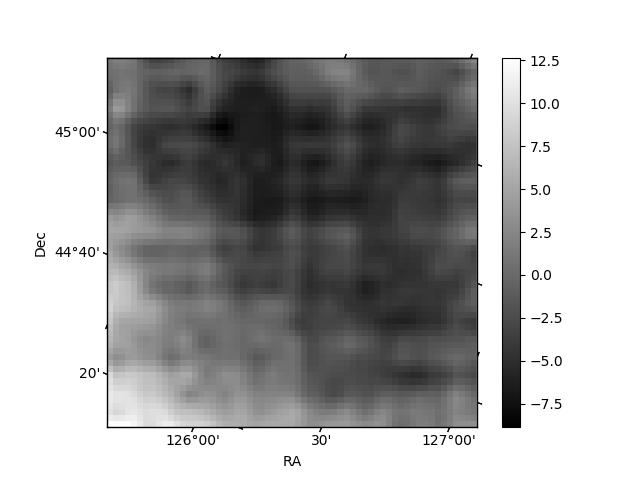
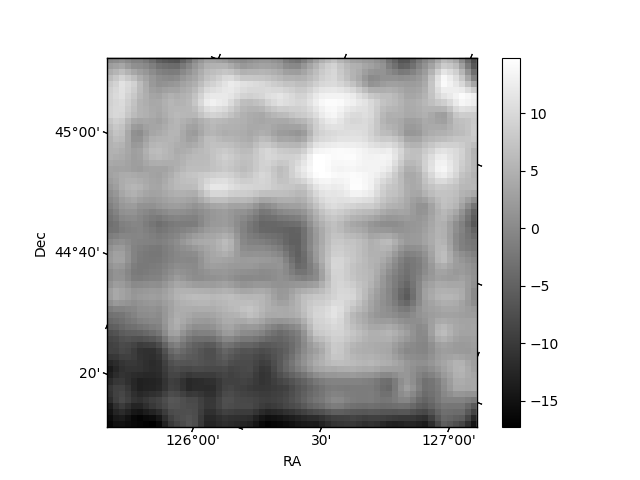
Quadrant B |
|---|---|---|---|
| Quadrant D | 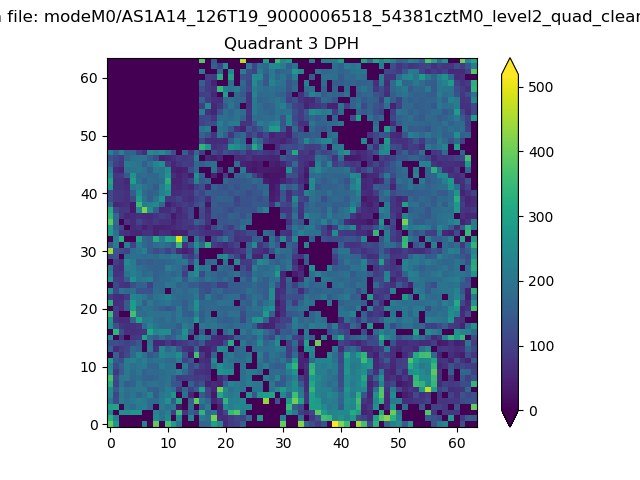 |
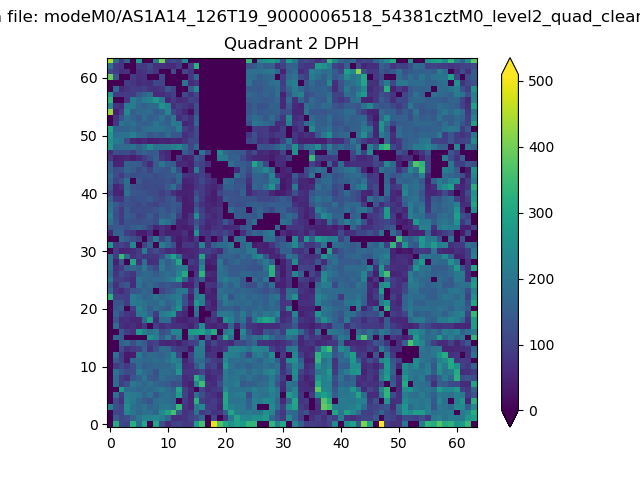 |
Quadrant C |
| Plot type | Count rate plots | Images |
|---|---|---|
| Comparison with Poisson distribution Blue bars denote a histogram of data divided into 1 sec bins. Red curve is a Poisson curve with rate = median count rate of data. |
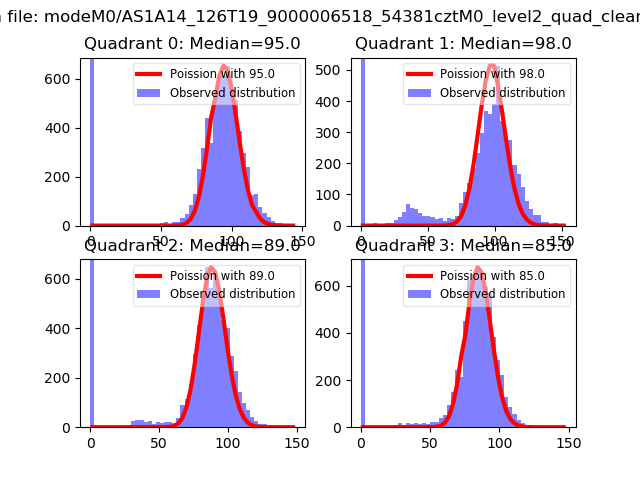 |
 |
| Quadrant-wise count rates Data is divided into 100 sec bins |
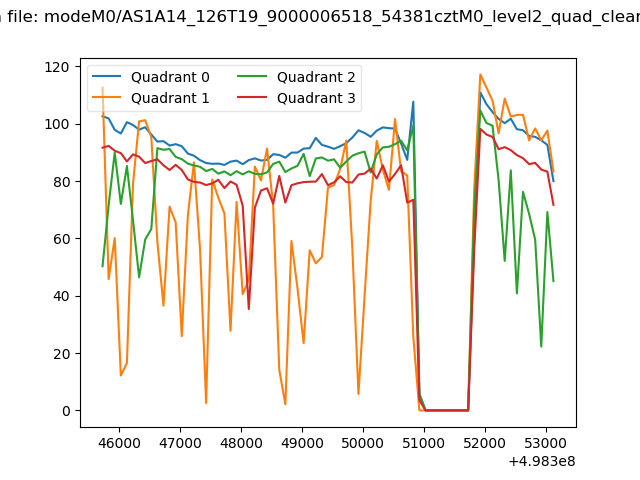 |
|
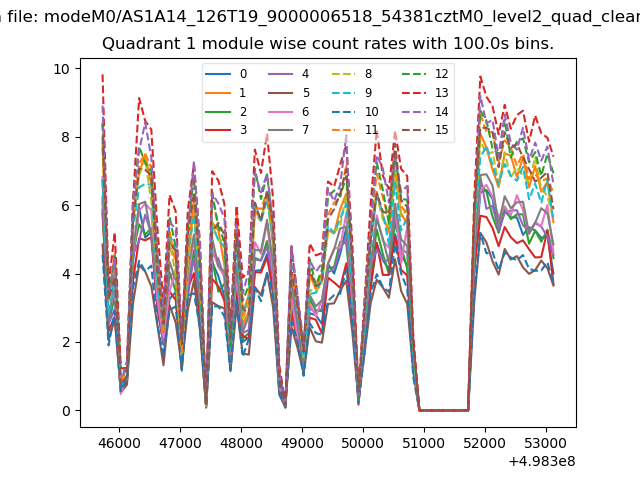
| Module-wise count rates for Quadrant A Data is divided into 100 sec bins |
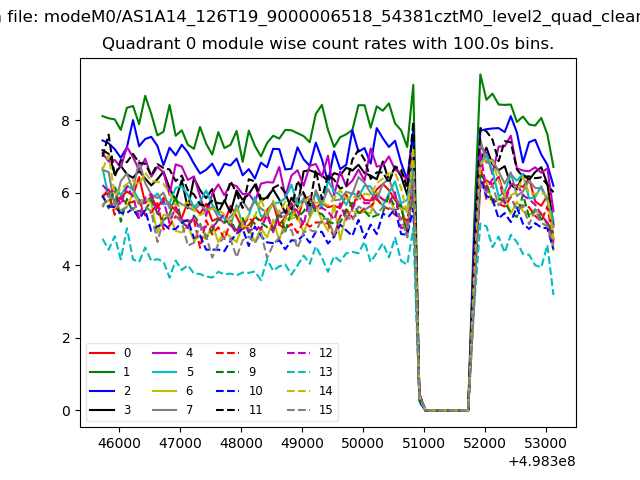 |
 |
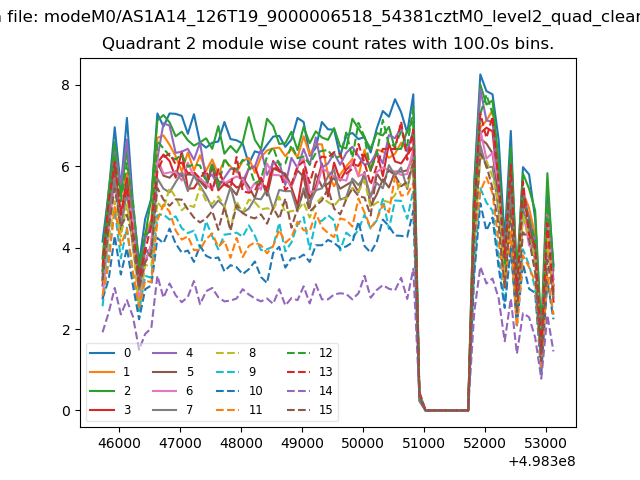
| Module-wise count rates for Quadrant B Data is divided into 100 sec bins |
 |
 |
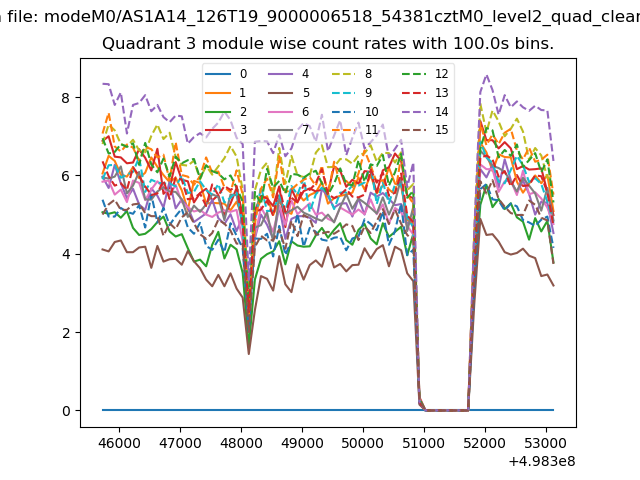
| Module-wise count rates for Quadrant C Data is divided into 100 sec bins |
 |
 |
| Module-wise count rates for Quadrant D Data is divided into 100 sec bins |
 |
 |
| Parameter | Plot |
|---|---|
| CZT HV Monitor | 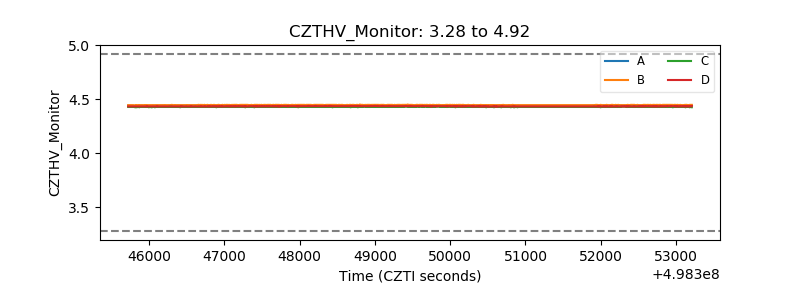 |
| D_VDD | 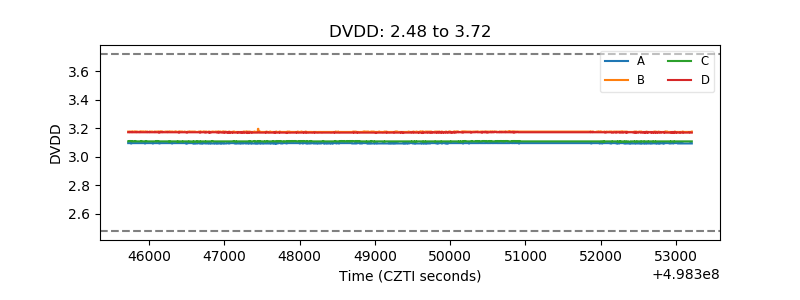 |
| Temperature 1 | 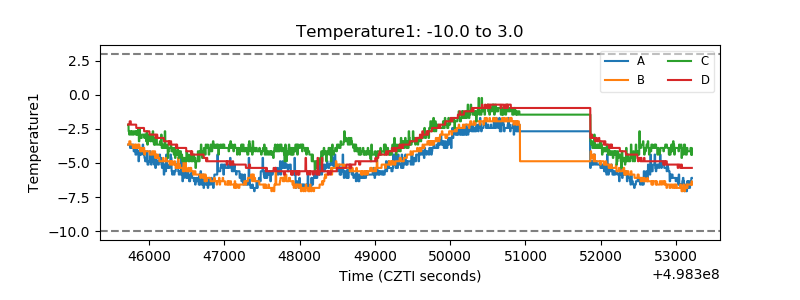 |
| Veto HV Monitor |  |
| Veto LLD | 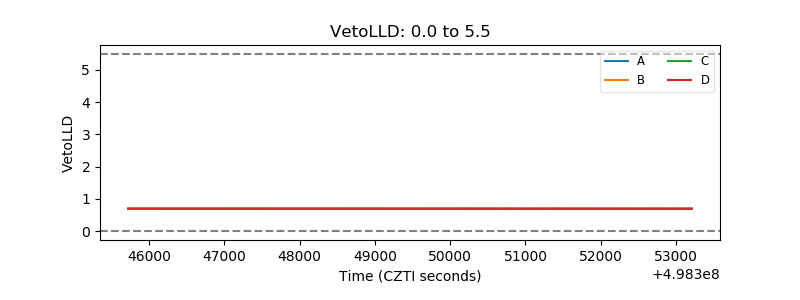 |
| Alpha Counter | 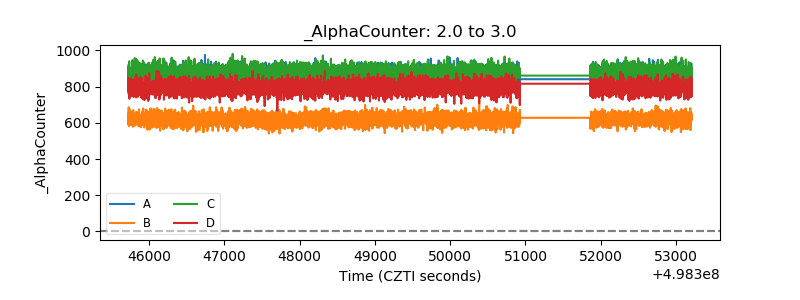 |
| _CPM_Rate | 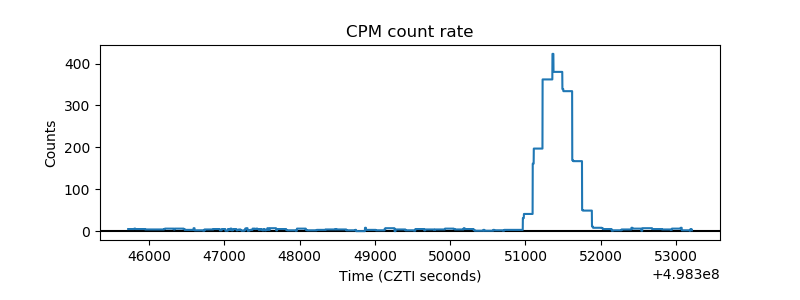 |
| CZT Counter | 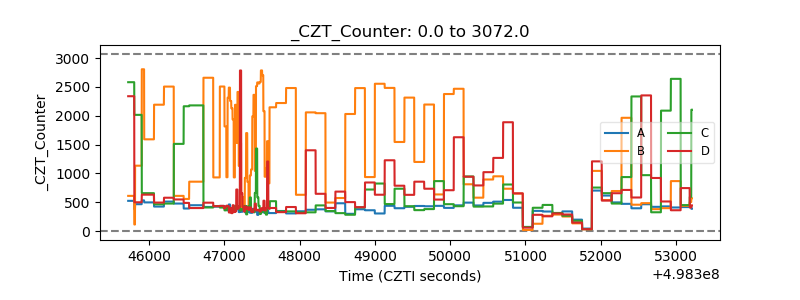 |
| +2.5 Volts monitor | 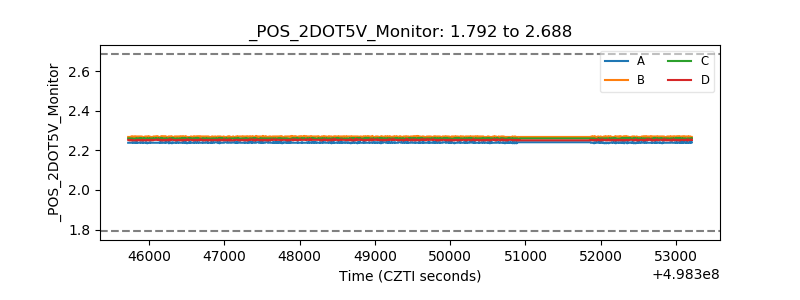 |
| +5 Volts monitor | 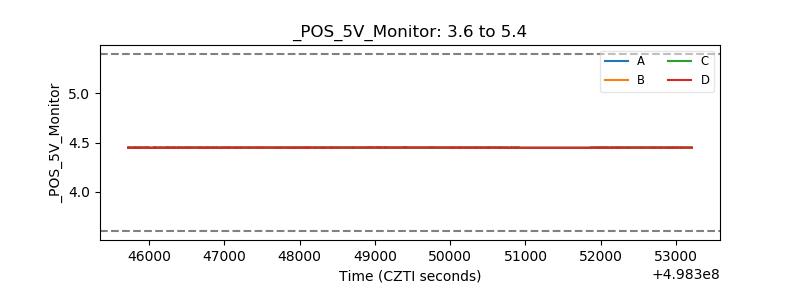 |
| _ROLL_ROT | 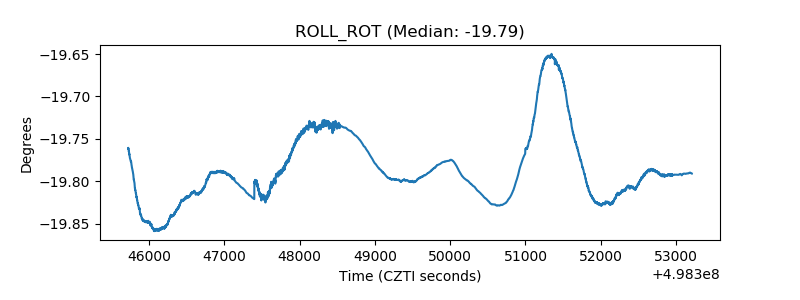 |
| _Roll_DEC | 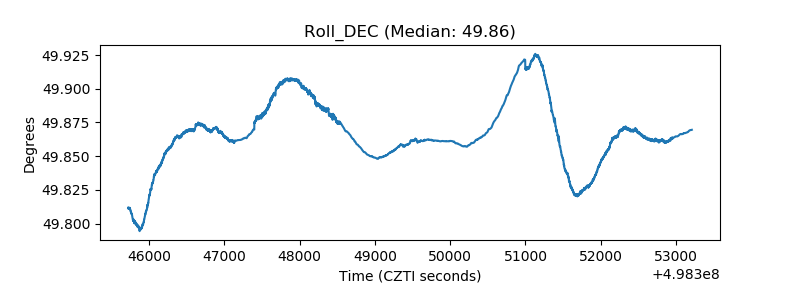 |
| _Roll_RA | 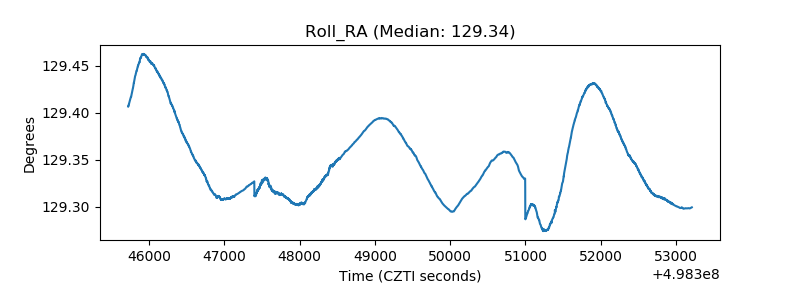 |
| Veto Counter | 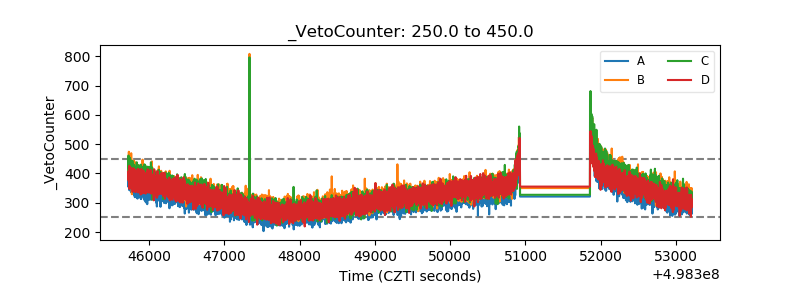 |