| Param | Original file | Final file |
|---|---|---|
| Filename | modeM0/AS1A14_126T19_9000006518_54383cztM0_level2.fits | modeM0/AS1A14_126T19_9000006518_54383cztM0_level2_quad_clean.evt |
| Size (bytes) | 772,997,760 | 80,366,400 |
| Size | 737.2 MB | 76.6 MB |
| Events in quadrant A | 3,087,629 | 631,432 |
| Events in quadrant B | 7,233,612 | 522,502 |
| Events in quadrant C | 8,310,666 | 441,753 |
| Events in quadrant D | 9,470,633 | 377,304 |
| Mode SS | |||
|---|---|---|---|
| Quadrant | BADHDUFLAG | Total packets | Discarded packets |
| A | 0 | 134 | 0 |
| B | 0 | 134 | 0 |
| C | 0 | 134 | 0 |
| D | 0 | 134 | 0 |
| Mode M0 | |||
|---|---|---|---|
| Quadrant | BADHDUFLAG | Total packets | Discarded packets |
| A | 0 | 14250 | 2 |
| B | 0 | 26086 | 2 |
| C | 0 | 29338 | 2 |
| D | 0 | 32738 | 3 |
| Mode M9 | |||
|---|---|---|---|
| Quadrant | BADHDUFLAG | Total packets | Discarded packets |
| A | 0 | 12 | 0 |
| B | 0 | 12 | 0 |
| C | 0 | 13 | 0 |
| D | 0 | 13 | 0 |
| Quadrant | Total seconds | Saturated seconds | Saturation percentage |
|---|---|---|---|
| A | 6596 | 90 | 1.364463% |
| B | 6596 | 1681 | 25.485143% |
| C | 6596 | 2041 | 30.942996% |
| D | 6595 | 2425 | 36.770281% |
Noise dominated data is calculated using 1-second bins in cleaned event files. If a bin has >2000 counts, and if more than 50% of those come from <1% of pixels, then it is considered to be noise-dominated and hence unusable.
| Quadrant | # 1 sec bins | Bins with >0 counts | Bins with >2000 counts | High rate bins dominated by noise | Noise dominated (total time) | Noise dominated (detector-on time) | Marked lightcurve |
|---|---|---|---|---|---|---|---|
| A | 7621 | 6597 | 52 | 52 | 0.68% | 0.79% | 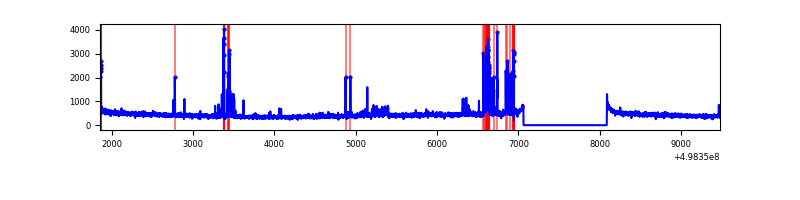 |
| B | 7621 | 6596 | 1236 | 1236 | 16.22% | 18.74% | 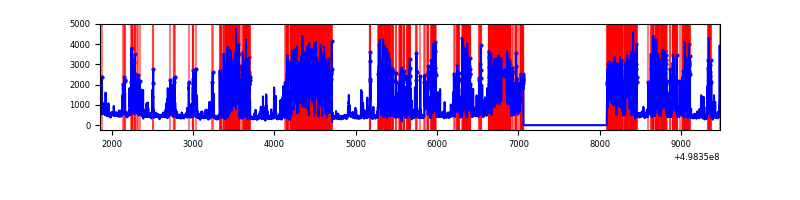 |
| C | 7621 | 6597 | 1837 | 1837 | 24.10% | 27.85% | 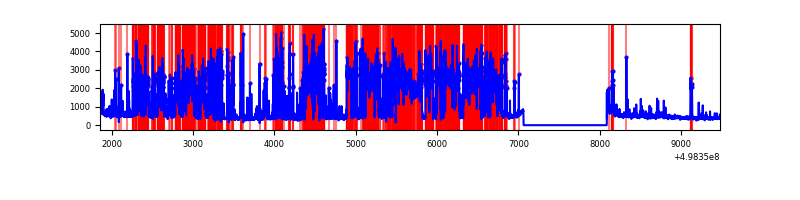 |
| D | 7620 | 6595 | 2076 | 2076 | 27.24% | 31.48% | 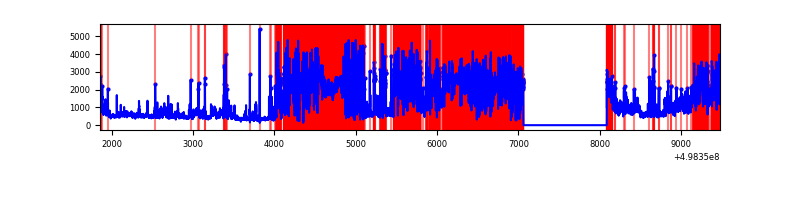 |
Top three noisy pixels from each quadrant. If the there are fewer than three noisy pixels in the level2.evt file, extra rows are filled as -1
| Pixel properties | Quadrant properties | ||||||
|---|---|---|---|---|---|---|---|
| Quadrant | DetID | PixID | Counts | Sigma | Mean | Median | Sigma |
| A | 0 | 8 | 276380 | 1583.96 | 702 | 683 | 174.1 |
| A | 8 | 246 | 40862 | 230.84 | 702 | 683 | 174.1 |
| A | 3 | 62 | 21128 | 117.46 | 702 | 683 | 174.1 |
| B | 10 | 14 | 4580857 | 34540.81 | 617 | 594 | 132.6 |
| B | 0 | 213 | 63586 | 475.04 | 617 | 594 | 132.6 |
| B | 0 | 171 | 57979 | 432.75 | 617 | 594 | 132.6 |
| C | 1 | 241 | 4775947 | 29328.36 | 590 | 584 | 162.8 |
| C | 13 | 3 | 563900 | 3459.66 | 590 | 584 | 162.8 |
| C | 14 | 254 | 354013 | 2170.62 | 590 | 584 | 162.8 |
| D | 8 | 176 | 6656437 | 44470.85 | 518 | 495 | 149.7 |
| D | 2 | 172 | 265955 | 1773.64 | 518 | 495 | 149.7 |
| D | 3 | 12 | 223660 | 1491.05 | 518 | 495 | 149.7 |
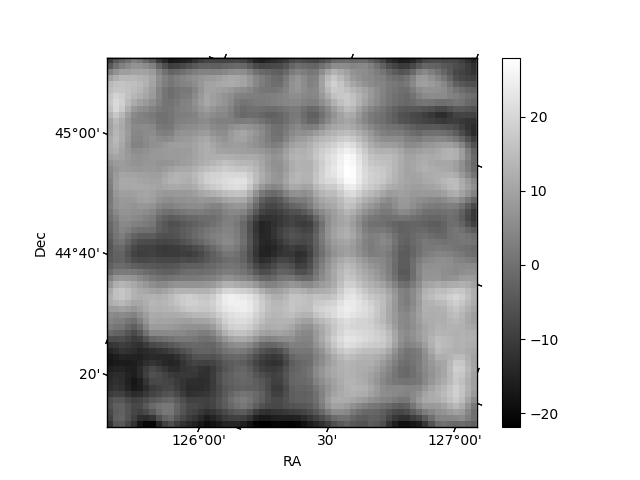
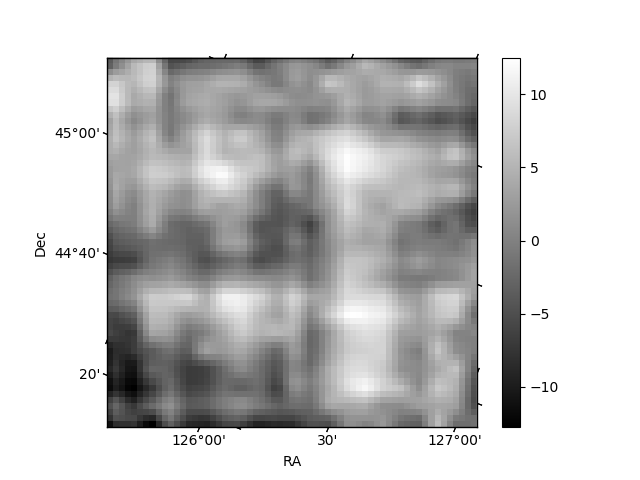
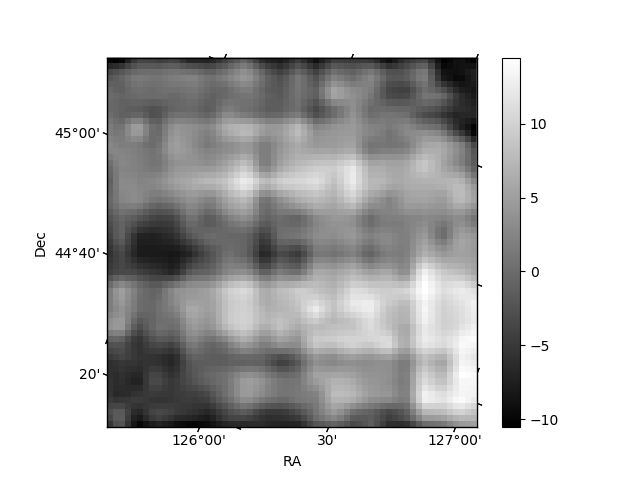
Histogram calculated using DETX and DETY for each event in the final _common_clean file
| Quadrant A | 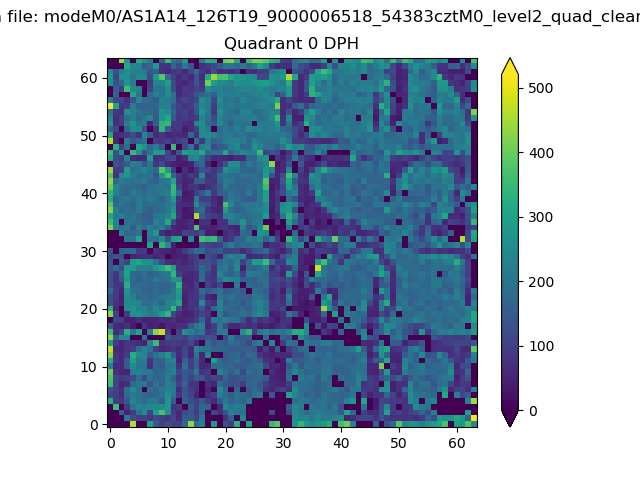 |
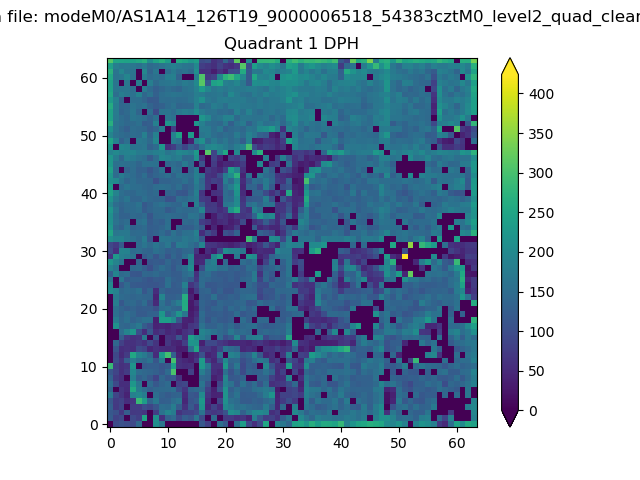 |
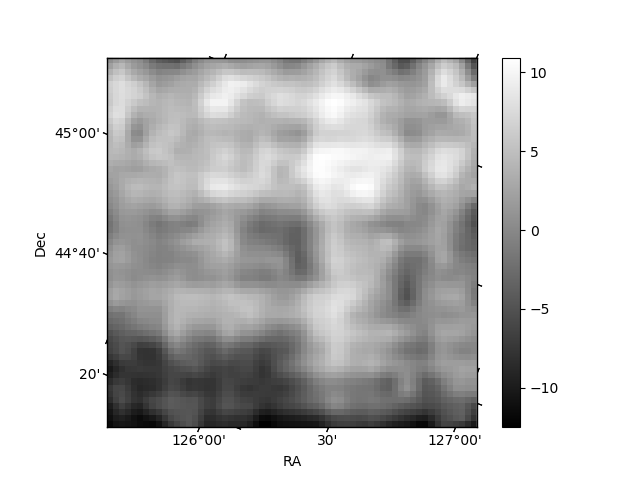
Quadrant B |
|---|---|---|---|
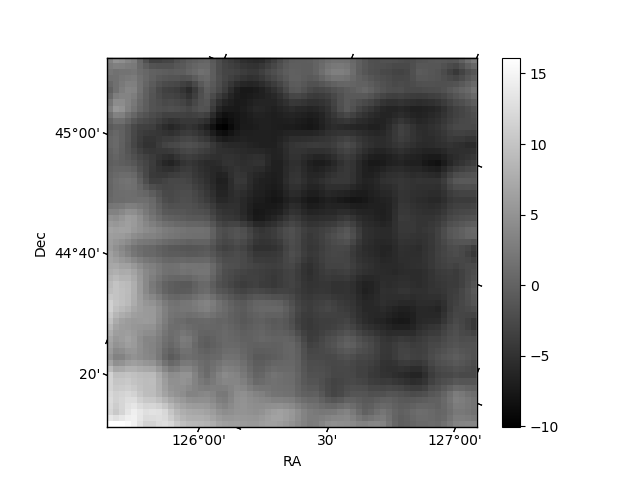
| Quadrant D | 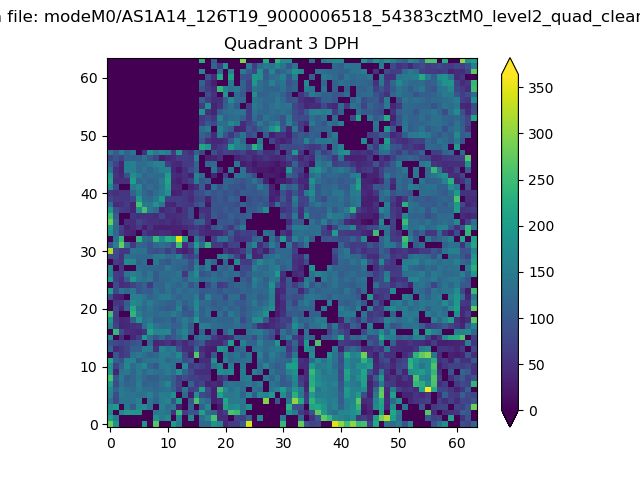 |
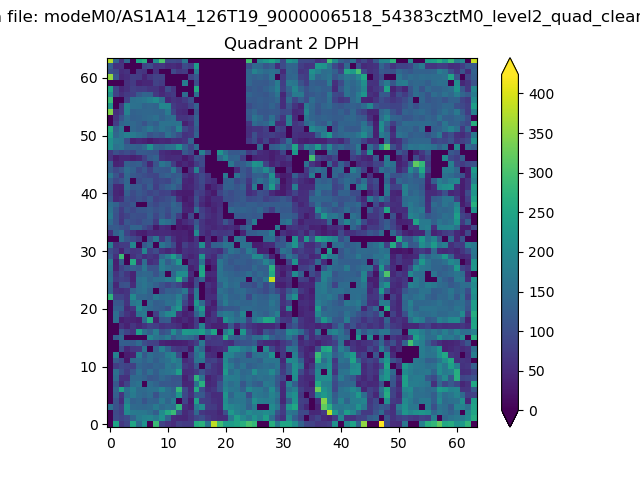 |
Quadrant C |
| Plot type | Count rate plots | Images |
|---|---|---|
| Comparison with Poisson distribution Blue bars denote a histogram of data divided into 1 sec bins. Red curve is a Poisson curve with rate = median count rate of data. |
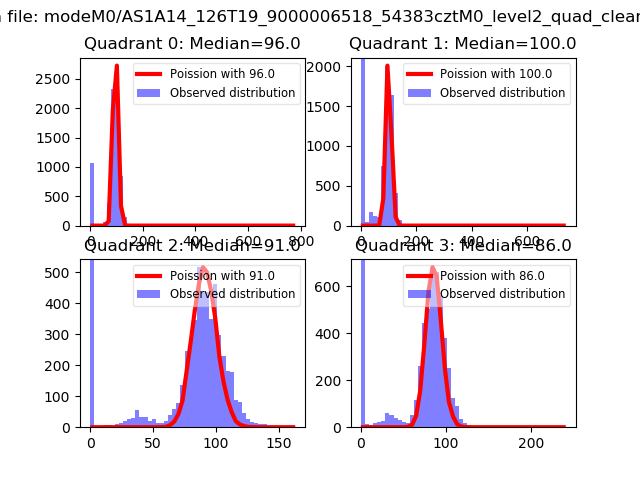 |
 |
| Quadrant-wise count rates Data is divided into 100 sec bins |
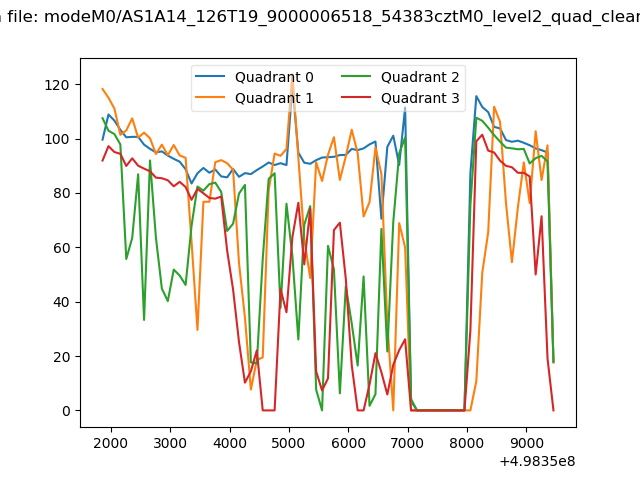 |
|
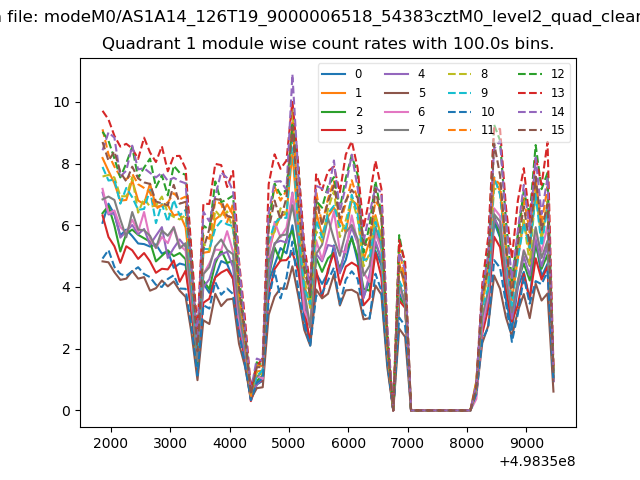
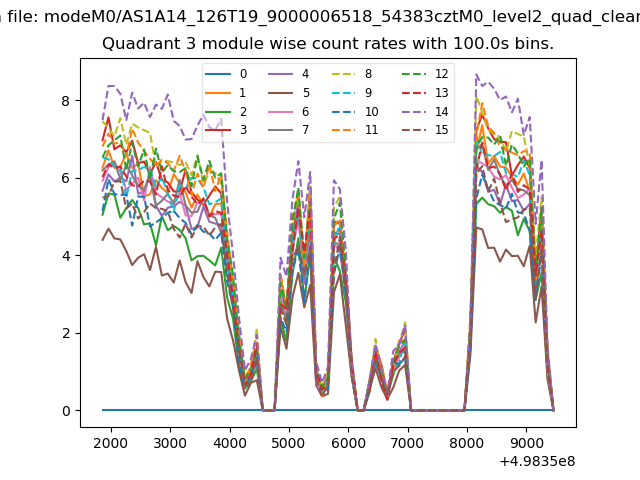
| Module-wise count rates for Quadrant A Data is divided into 100 sec bins |
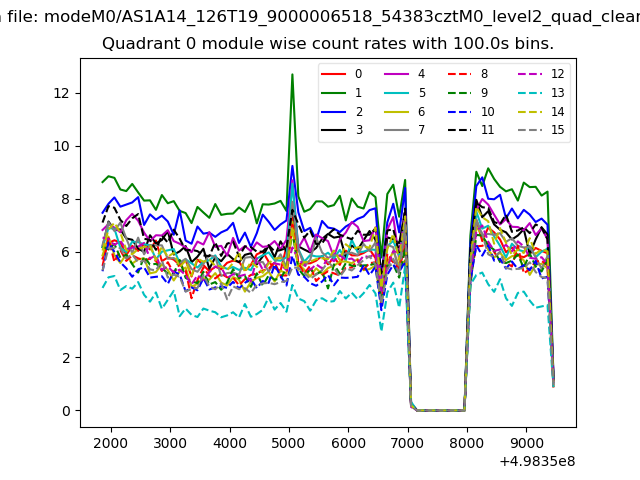 |
 |
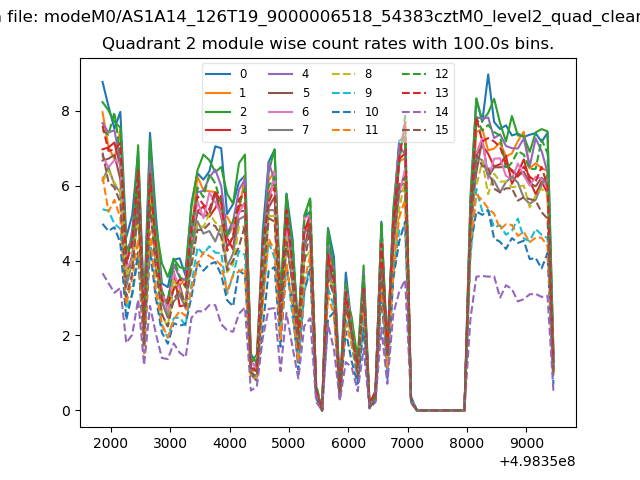
| Module-wise count rates for Quadrant B Data is divided into 100 sec bins |
 |
 |
| Module-wise count rates for Quadrant C Data is divided into 100 sec bins |
 |
 |
| Module-wise count rates for Quadrant D Data is divided into 100 sec bins |
 |
 |
| Parameter | Plot |
|---|---|
| CZT HV Monitor | 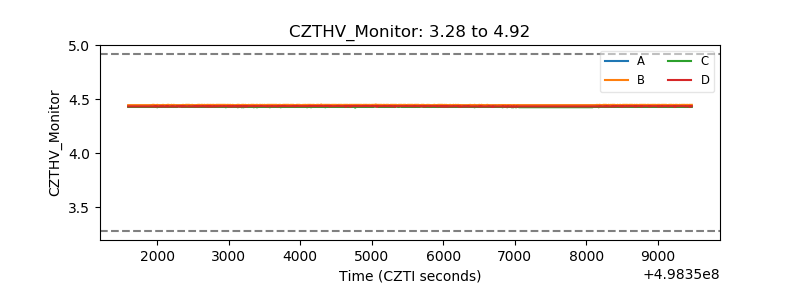 |
| D_VDD | 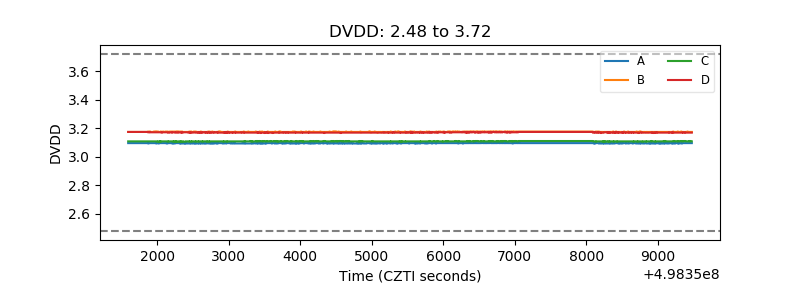 |
| Temperature 1 | 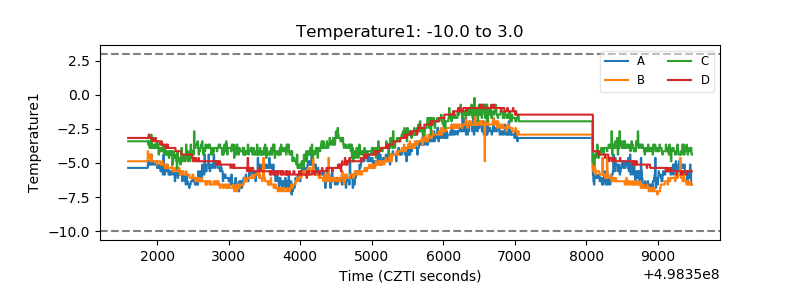 |
| Veto HV Monitor | 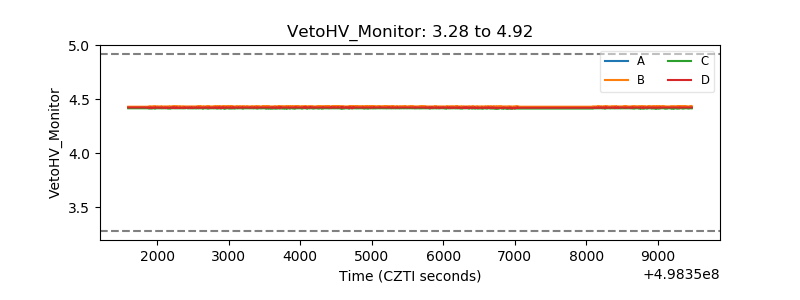 |
| Veto LLD | 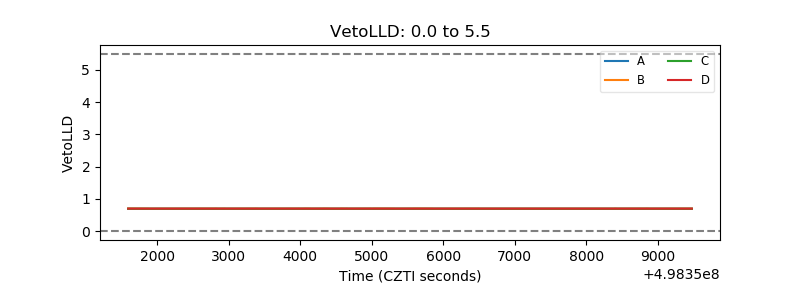 |
| Alpha Counter | 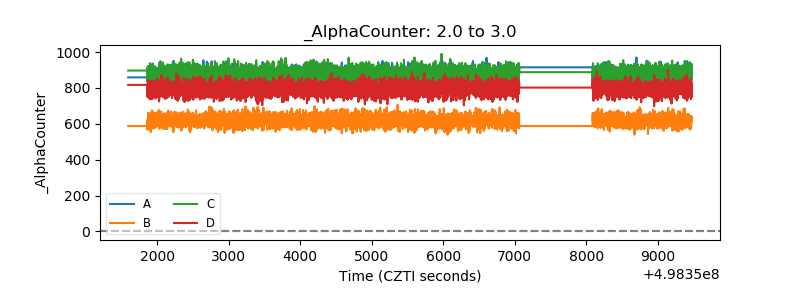 |
| _CPM_Rate | 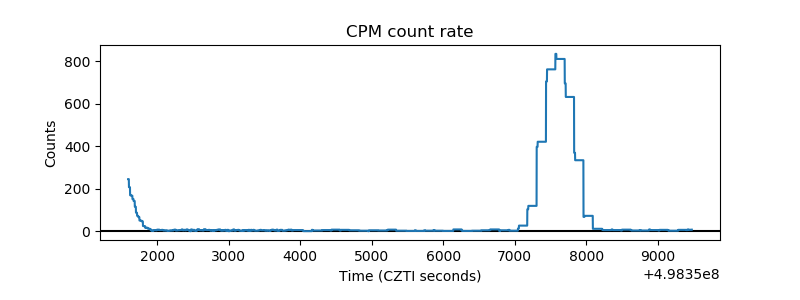 |
| CZT Counter | 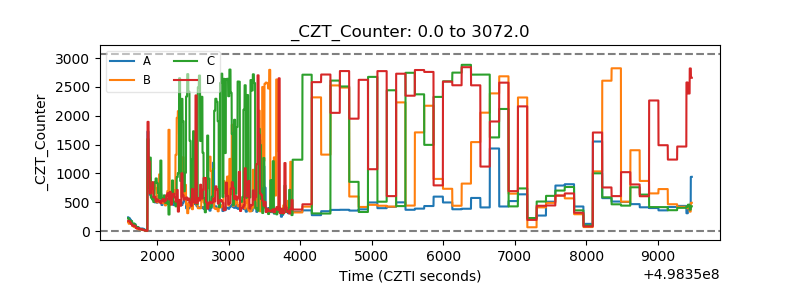 |
| +2.5 Volts monitor |  |
| +5 Volts monitor |  |
| _ROLL_ROT | 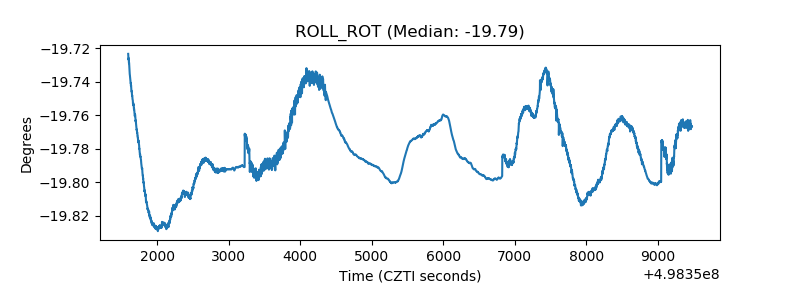 |
| _Roll_DEC | 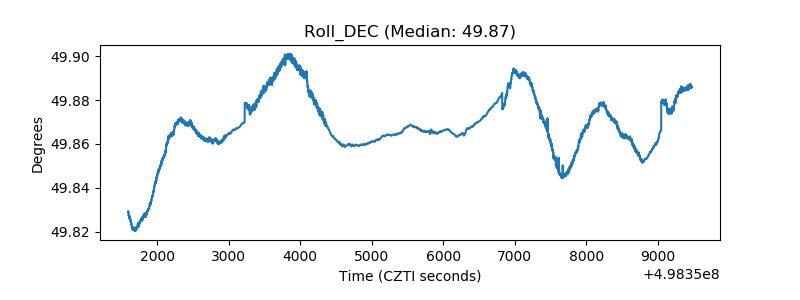 |
| _Roll_RA | 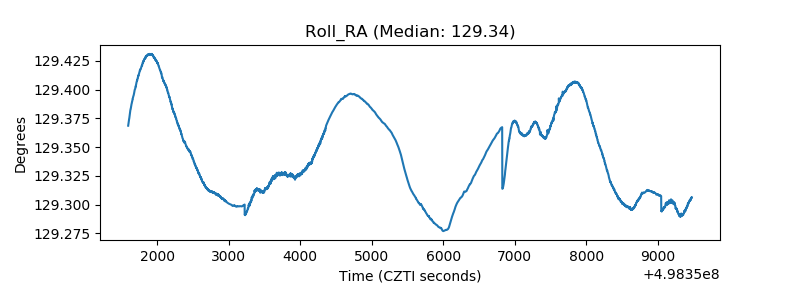 |
| Veto Counter | 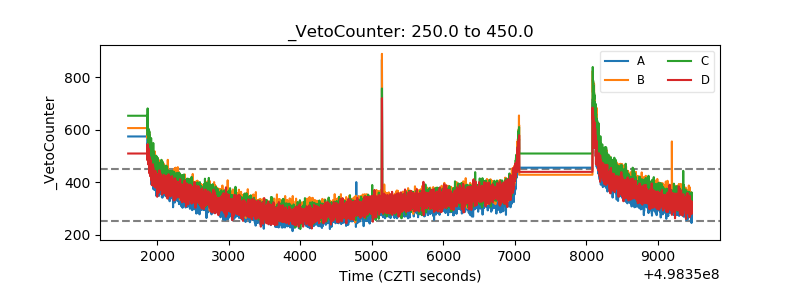 |