| Param | Original file | Final file |
|---|---|---|
| Filename | modeM0/AS1A14_126T19_9000006518_54384cztM0_level2.fits | modeM0/AS1A14_126T19_9000006518_54384cztM0_level2_quad_clean.evt |
| Size (bytes) | 710,576,640 | 84,337,920 |
| Size | 677.7 MB | 80.4 MB |
| Events in quadrant A | 2,911,296 | 649,771 |
| Events in quadrant B | 4,857,582 | 624,762 |
| Events in quadrant C | 4,919,029 | 562,816 |
| Events in quadrant D | 13,100,999 | 254,100 |
| Mode SS | |||
|---|---|---|---|
| Quadrant | BADHDUFLAG | Total packets | Discarded packets |
| A | 0 | 138 | 0 |
| B | 0 | 138 | 0 |
| C | 0 | 138 | 0 |
| D | 0 | 138 | 0 |
| Mode M0 | |||
|---|---|---|---|
| Quadrant | BADHDUFLAG | Total packets | Discarded packets |
| A | 0 | 13704 | 2 |
| B | 0 | 19270 | 2 |
| C | 0 | 19524 | 2 |
| D | 0 | 43534 | 2 |
| Mode M9 | |||
|---|---|---|---|
| Quadrant | BADHDUFLAG | Total packets | Discarded packets |
| A | 0 | 22 | 0 |
| B | 0 | 22 | 0 |
| C | 0 | 22 | 0 |
| D | 0 | 22 | 0 |
| Quadrant | Total seconds | Saturated seconds | Saturation percentage |
|---|---|---|---|
| A | 6621 | 33 | 0.498414% |
| B | 6622 | 788 | 11.899728% |
| C | 6622 | 741 | 11.189973% |
| D | 6622 | 3957 | 59.755361% |
Noise dominated data is calculated using 1-second bins in cleaned event files. If a bin has >2000 counts, and if more than 50% of those come from <1% of pixels, then it is considered to be noise-dominated and hence unusable.
| Quadrant | # 1 sec bins | Bins with >0 counts | Bins with >2000 counts | High rate bins dominated by noise | Noise dominated (total time) | Noise dominated (detector-on time) | Marked lightcurve |
|---|---|---|---|---|---|---|---|
| A | 8812 | 6624 | 10 | 10 | 0.11% | 0.15% | 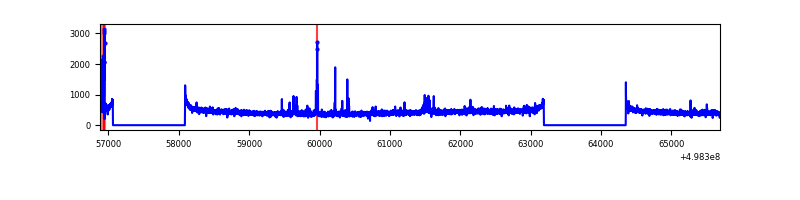 |
| B | 8813 | 6624 | 531 | 531 | 6.03% | 8.02% | 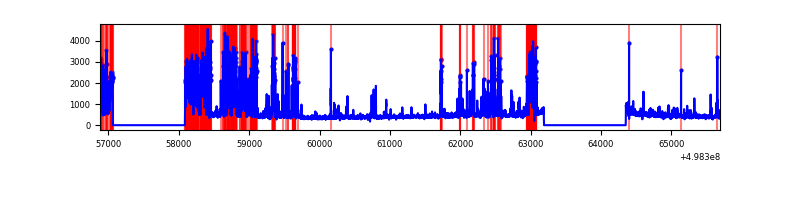 |
| C | 8813 | 6625 | 523 | 523 | 5.93% | 7.89% | 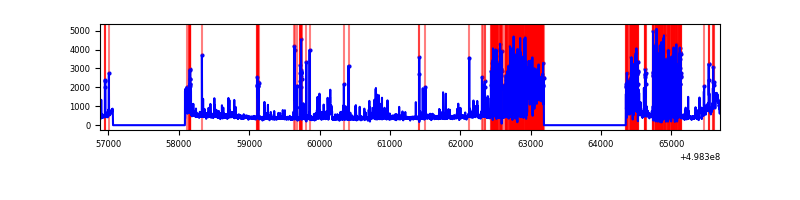 |
| D | 8812 | 6623 | 3550 | 3550 | 40.29% | 53.60% | 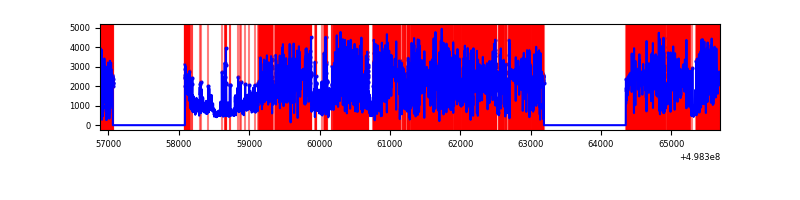 |
Top three noisy pixels from each quadrant. If the there are fewer than three noisy pixels in the level2.evt file, extra rows are filled as -1
| Pixel properties | Quadrant properties | ||||||
|---|---|---|---|---|---|---|---|
| Quadrant | DetID | PixID | Counts | Sigma | Mean | Median | Sigma |
| A | 0 | 8 | 62909 | 353.78 | 715 | 697 | 175.8 |
| A | 3 | 62 | 47740 | 267.52 | 715 | 697 | 175.8 |
| A | 13 | 254 | 15288 | 82.98 | 715 | 697 | 175.8 |
| B | 10 | 14 | 2023800 | 14129.89 | 668 | 642 | 143.2 |
| B | 0 | 171 | 102036 | 708.14 | 668 | 642 | 143.2 |
| B | 0 | 213 | 31581 | 216.08 | 668 | 642 | 143.2 |
| C | 13 | 3 | 1555218 | 8632.21 | 661 | 656 | 180.1 |
| C | 1 | 241 | 336257 | 1863.53 | 661 | 656 | 180.1 |
| C | 14 | 254 | 245043 | 1357.04 | 661 | 656 | 180.1 |
| D | 8 | 176 | 10815201 | 88287.6 | 427 | 408 | 122.5 |
| D | 2 | 172 | 291137 | 2373.39 | 427 | 408 | 122.5 |
| D | 3 | 12 | 77353 | 628.15 | 427 | 408 | 122.5 |
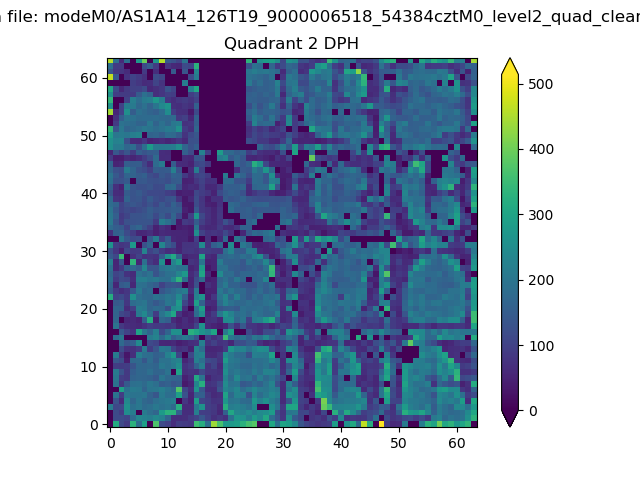
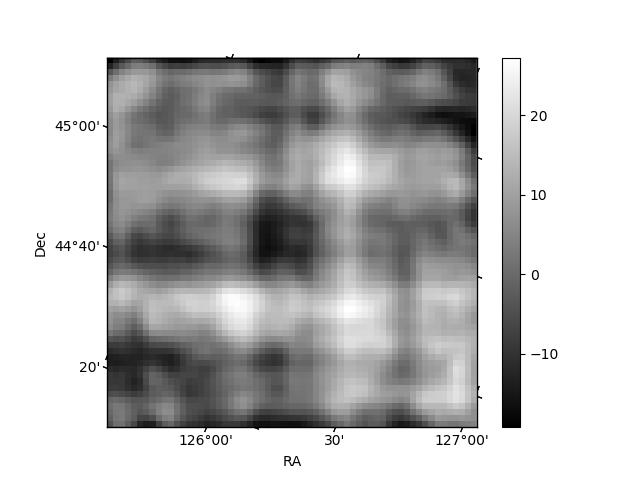
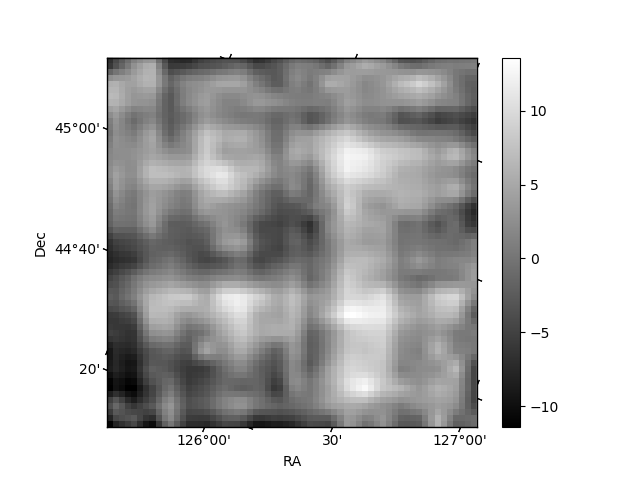
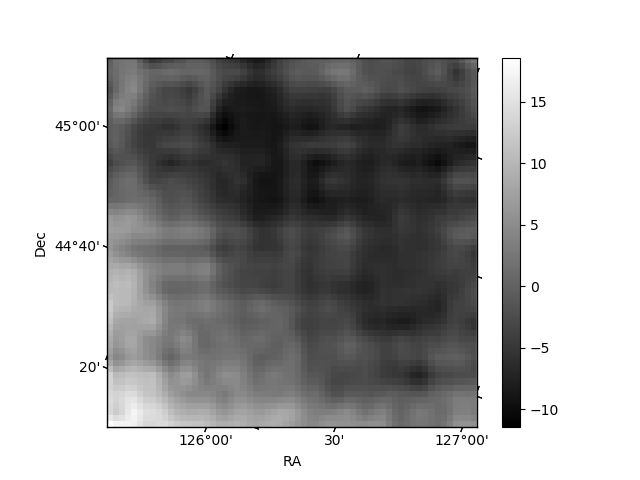
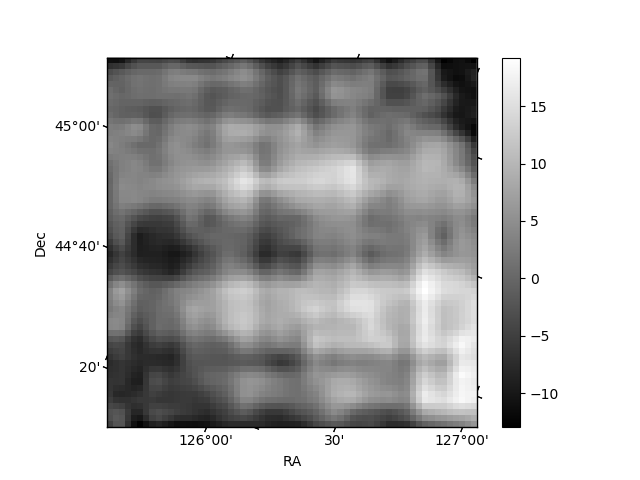
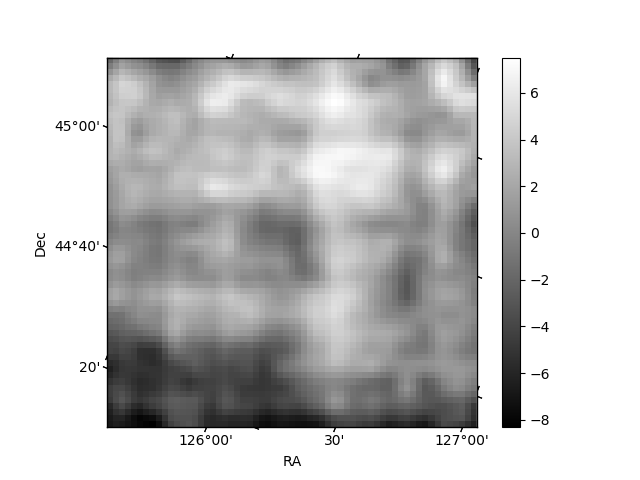
Histogram calculated using DETX and DETY for each event in the final _common_clean file
| Quadrant A | 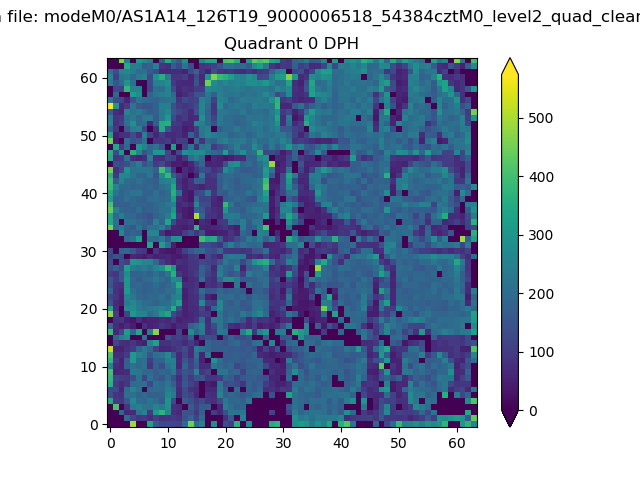 |
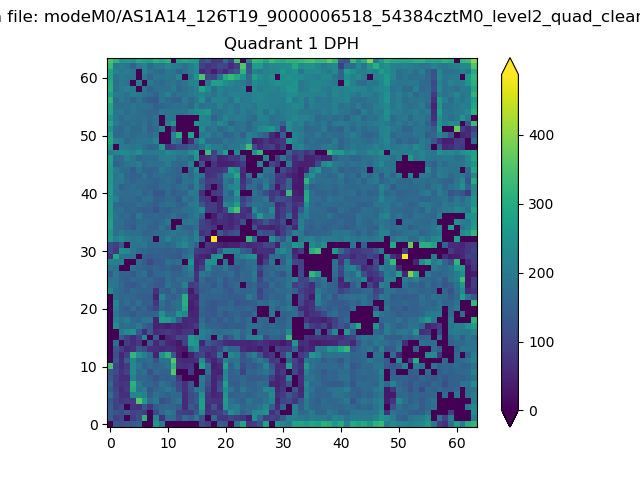 |
Quadrant B |
|---|---|---|---|
| Quadrant D | 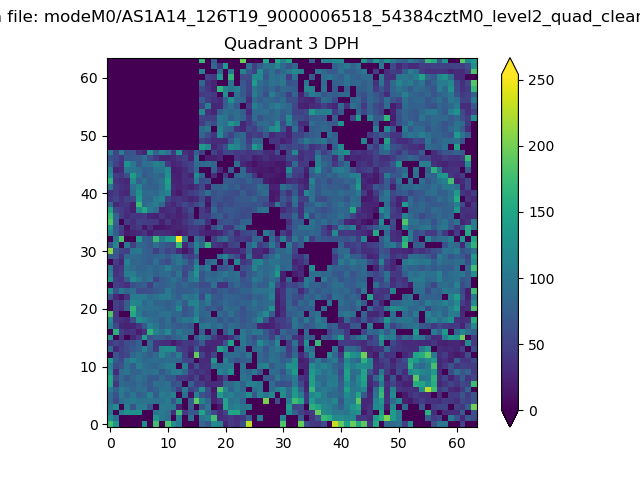 |
 |
Quadrant C |
| Plot type | Count rate plots | Images |
|---|---|---|
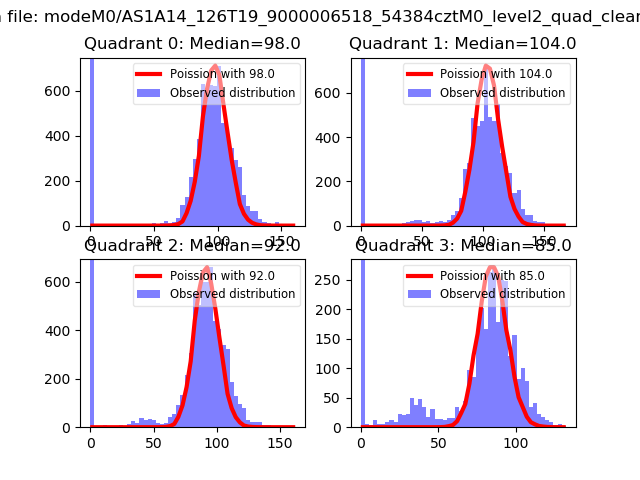
| Comparison with Poisson distribution Blue bars denote a histogram of data divided into 1 sec bins. Red curve is a Poisson curve with rate = median count rate of data. |
 |
 |
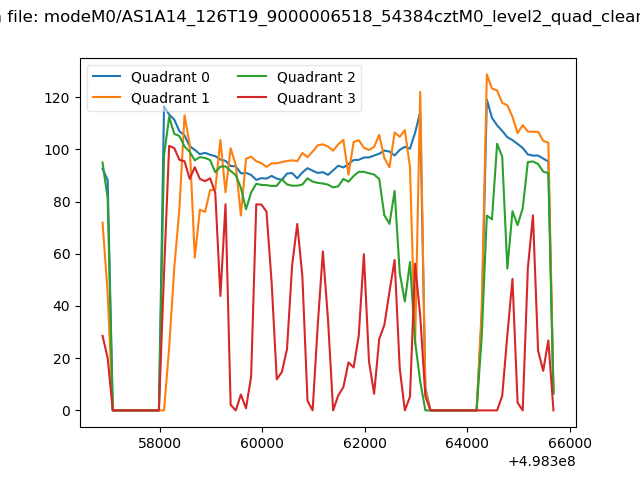
| Quadrant-wise count rates Data is divided into 100 sec bins |
 |
|
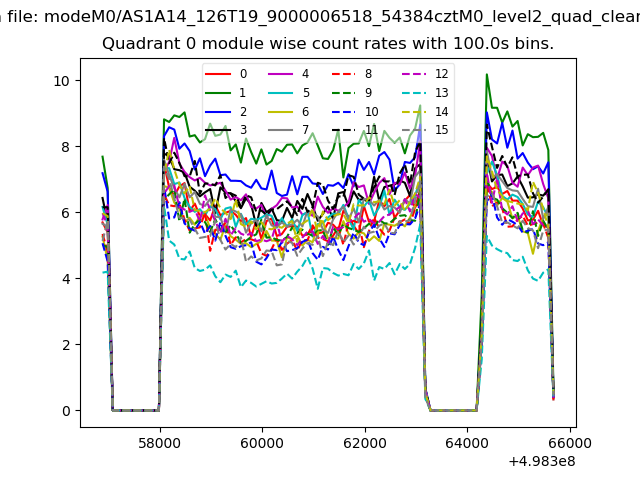
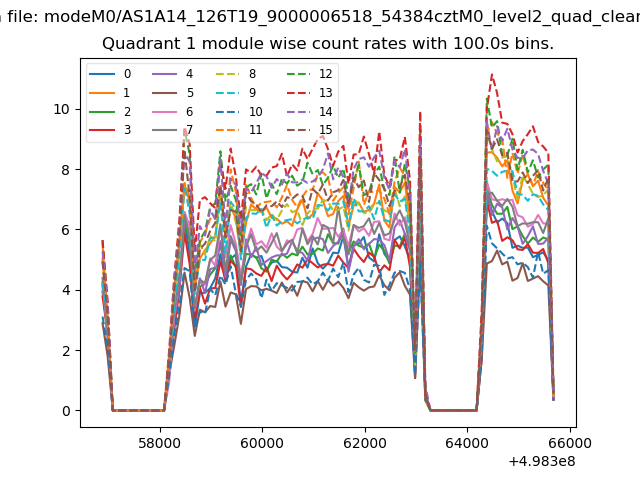
| Module-wise count rates for Quadrant A Data is divided into 100 sec bins |
 |
 |
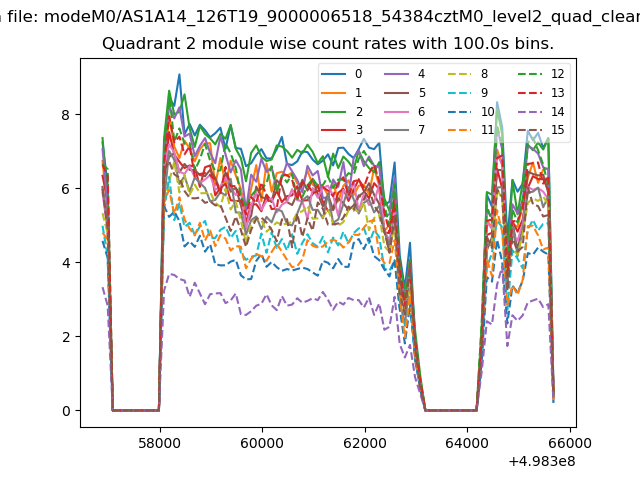
| Module-wise count rates for Quadrant B Data is divided into 100 sec bins |
 |
 |
| Module-wise count rates for Quadrant C Data is divided into 100 sec bins |
 |
 |
| Module-wise count rates for Quadrant D Data is divided into 100 sec bins |
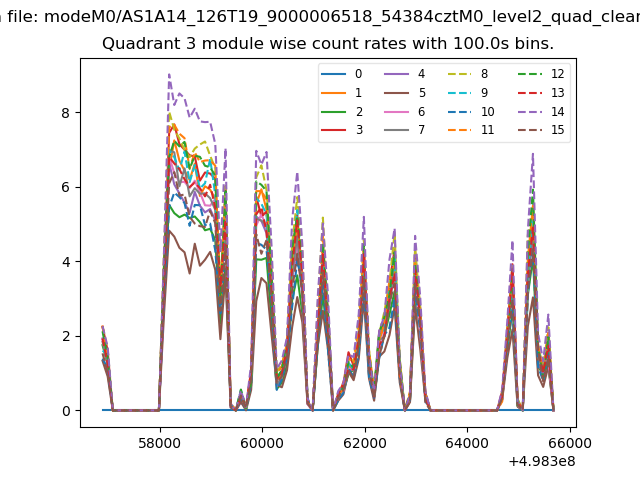 |
 |
| Parameter | Plot |
|---|---|
| CZT HV Monitor | 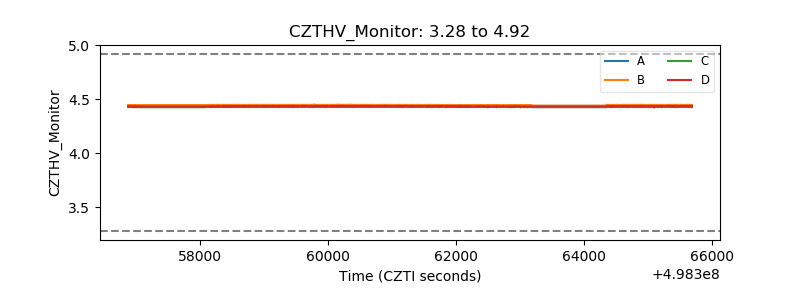 |
| D_VDD | 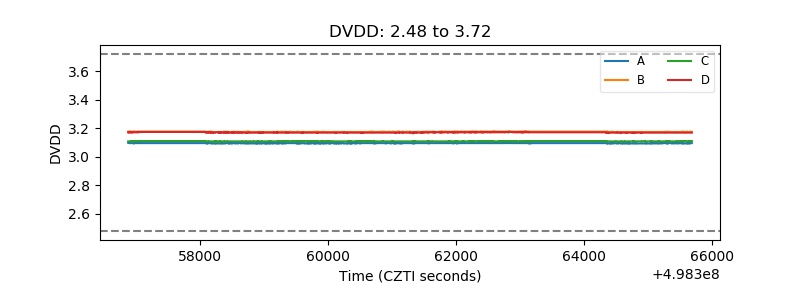 |
| Temperature 1 | 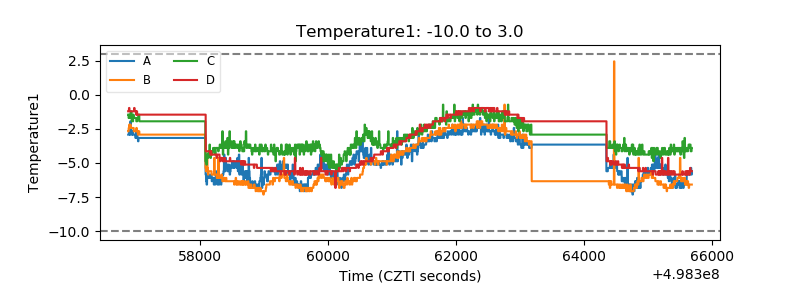 |
| Veto HV Monitor | 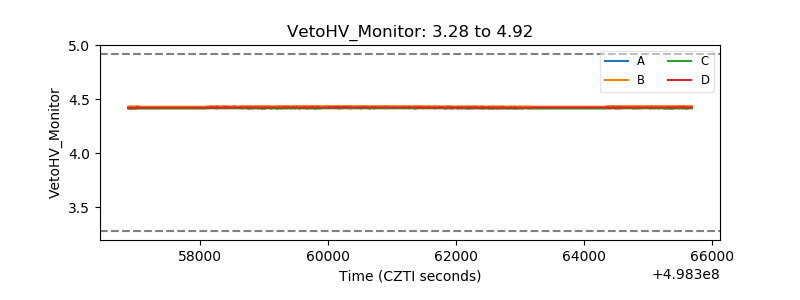 |
| Veto LLD | 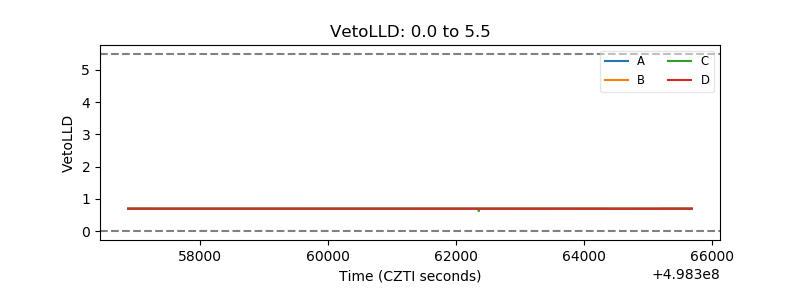 |
| Alpha Counter | 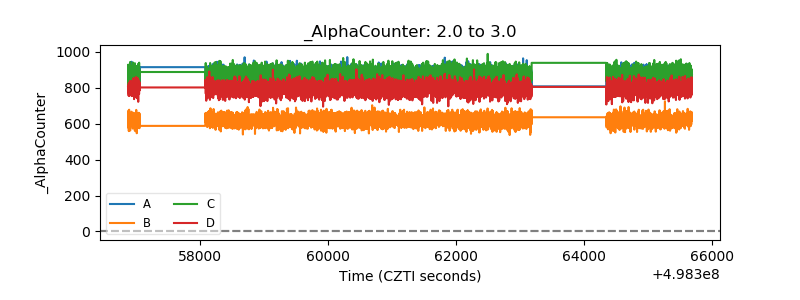 |
| _CPM_Rate | 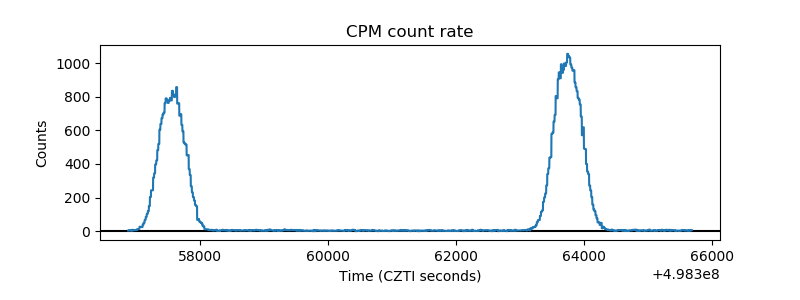 |
| CZT Counter | 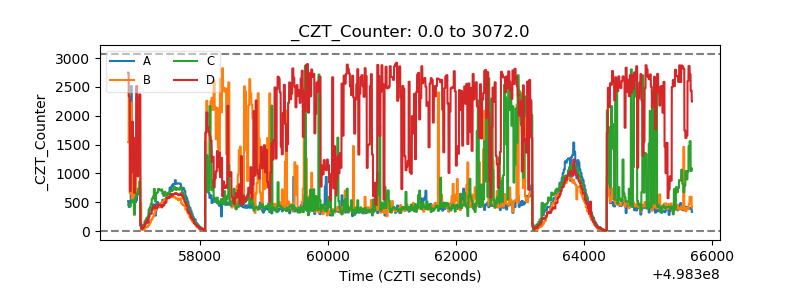 |
| +2.5 Volts monitor |  |
| +5 Volts monitor |  |
| _ROLL_ROT | 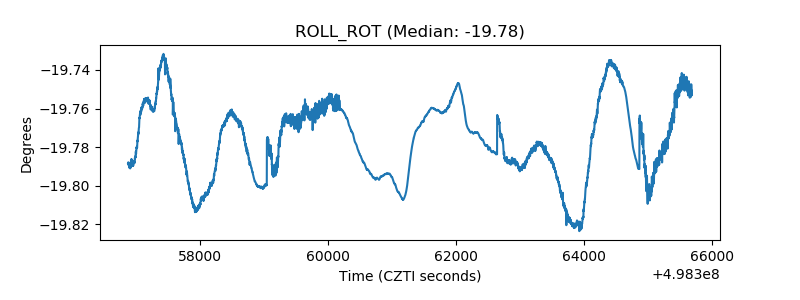 |
| _Roll_DEC | 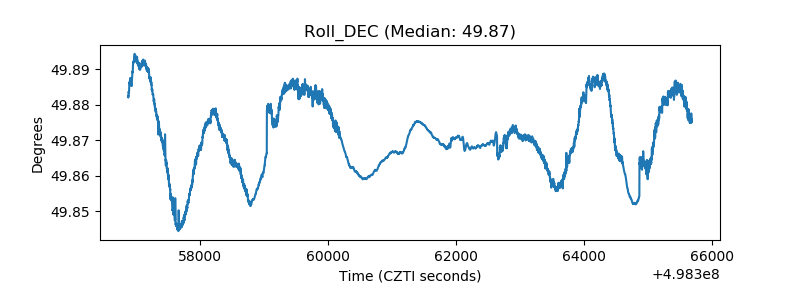 |
| _Roll_RA | 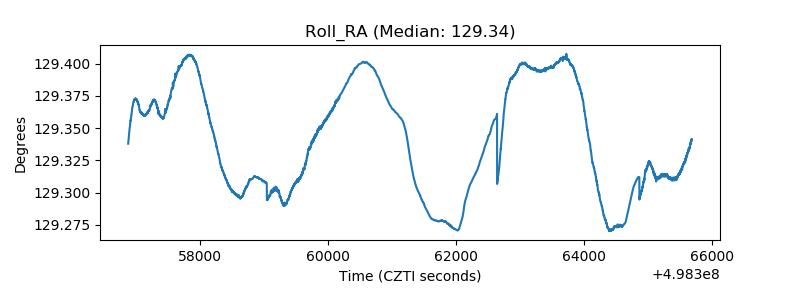 |
| Veto Counter | 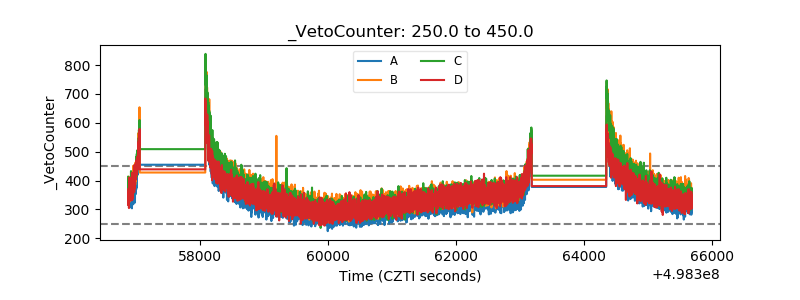 |