| Param | Original file | Final file |
|---|---|---|
| Filename | modeM0/AS1A14_126T19_9000006518_54385cztM0_level2.fits | modeM0/AS1A14_126T19_9000006518_54385cztM0_level2_quad_clean.evt |
| Size (bytes) | 2,770,309,440 | 326,180,160 |
| Size | 2.6 GB | 311.1 MB |
| Events in quadrant A | 11,458,308 | 2,501,760 |
| Events in quadrant B | 23,361,691 | 2,309,090 |
| Events in quadrant C | 25,833,791 | 2,005,205 |
| Events in quadrant D | 39,871,072 | 1,257,039 |
| Mode SS | |||
|---|---|---|---|
| Quadrant | BADHDUFLAG | Total packets | Discarded packets |
| A | 0 | 534 | 0 |
| B | 0 | 534 | 0 |
| C | 0 | 534 | 0 |
| D | 0 | 534 | 0 |
| Mode M0 | |||
|---|---|---|---|
| Quadrant | BADHDUFLAG | Total packets | Discarded packets |
| A | 0 | 54576 | 5 |
| B | 0 | 88300 | 7 |
| C | 0 | 95985 | 6 |
| D | 0 | 137008 | 5 |
| Mode M9 | |||
|---|---|---|---|
| Quadrant | BADHDUFLAG | Total packets | Discarded packets |
| A | 0 | 50 | 0 |
| B | 0 | 50 | 0 |
| C | 0 | 50 | 0 |
| D | 0 | 50 | 0 |
| Quadrant | Total seconds | Saturated seconds | Saturation percentage |
|---|---|---|---|
| A | 26197 | 201 | 0.767263% |
| B | 26197 | 4372 | 16.688934% |
| C | 26197 | 4984 | 19.025079% |
| D | 26197 | 10940 | 41.760507% |
Noise dominated data is calculated using 1-second bins in cleaned event files. If a bin has >2000 counts, and if more than 50% of those come from <1% of pixels, then it is considered to be noise-dominated and hence unusable.
| Quadrant | # 1 sec bins | Bins with >0 counts | Bins with >2000 counts | High rate bins dominated by noise | Noise dominated (total time) | Noise dominated (detector-on time) | Marked lightcurve |
|---|---|---|---|---|---|---|---|
| A | 31208 | 26203 | 82 | 82 | 0.26% | 0.31% | 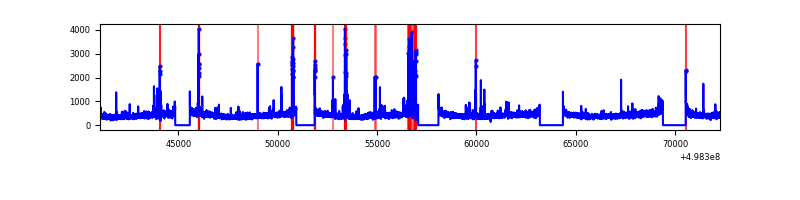 |
| B | 31209 | 26202 | 3276 | 3276 | 10.50% | 12.50% | 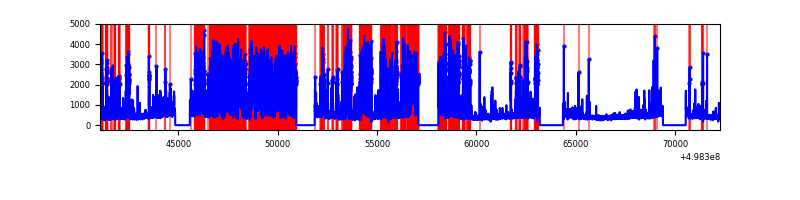 |
| C | 31208 | 26203 | 4529 | 4529 | 14.51% | 17.28% | 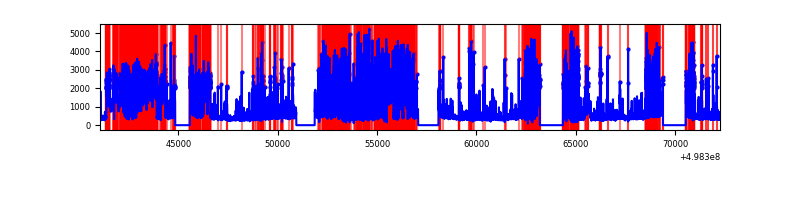 |
| D | 31207 | 26201 | 9656 | 9656 | 30.94% | 36.85% | 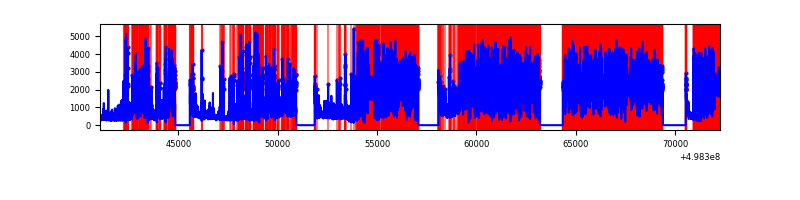 |
Top three noisy pixels from each quadrant. If the there are fewer than three noisy pixels in the level2.evt file, extra rows are filled as -1
| Pixel properties | Quadrant properties | ||||||
|---|---|---|---|---|---|---|---|
| Quadrant | DetID | PixID | Counts | Sigma | Mean | Median | Sigma |
| A | 0 | 8 | 440478 | 646.55 | 2766 | 2701 | 677.1 |
| A | 8 | 246 | 102752 | 147.76 | 2766 | 2701 | 677.1 |
| A | 3 | 62 | 96642 | 138.74 | 2766 | 2701 | 677.1 |
| B | 10 | 14 | 12136423 | 22358.09 | 2538 | 2441 | 542.7 |
| B | 0 | 171 | 277720 | 507.23 | 2538 | 2441 | 542.7 |
| B | 7 | 0 | 271014 | 494.87 | 2538 | 2441 | 542.7 |
| C | 1 | 241 | 11474245 | 16950.09 | 2474 | 2452 | 676.8 |
| C | 13 | 3 | 2375353 | 3506.07 | 2474 | 2452 | 676.8 |
| C | 14 | 254 | 1029770 | 1517.91 | 2474 | 2452 | 676.8 |
| D | 8 | 176 | 29014020 | 51841.26 | 1958 | 1870 | 559.6 |
| D | 2 | 172 | 1126009 | 2008.7 | 1958 | 1870 | 559.6 |
| D | 7 | 70 | 598846 | 1066.72 | 1958 | 1870 | 559.6 |
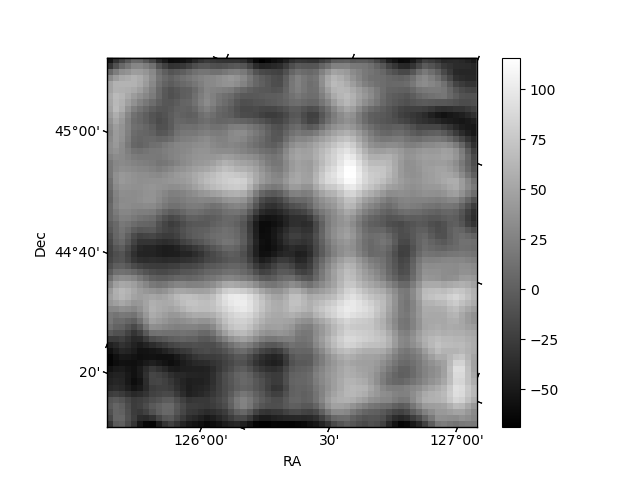
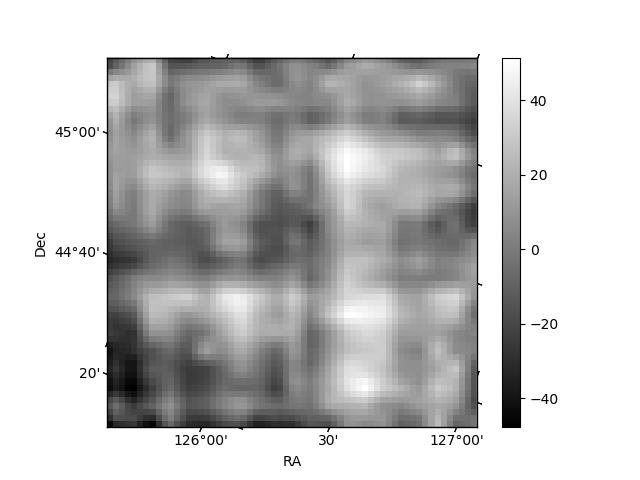
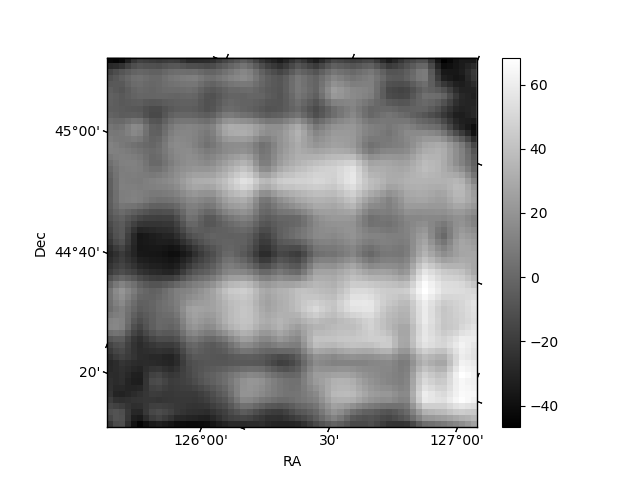
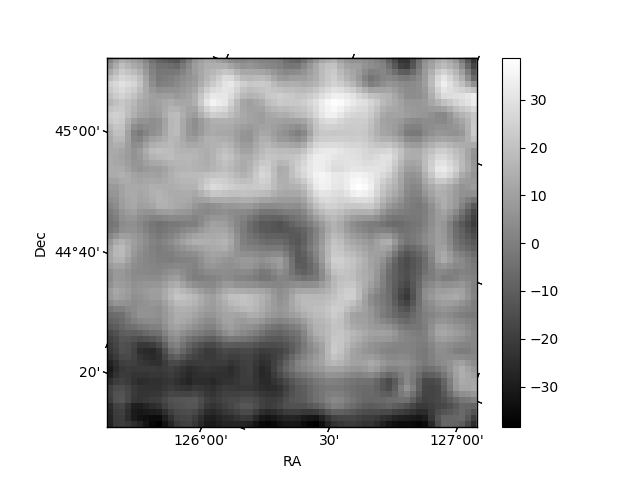
Histogram calculated using DETX and DETY for each event in the final _common_clean file
| Quadrant A | 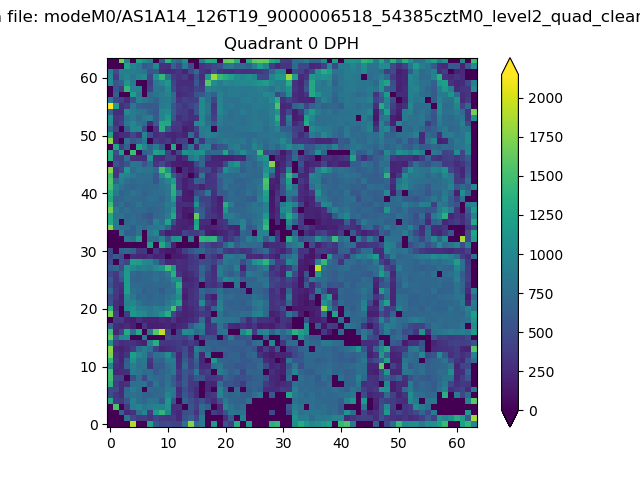 |
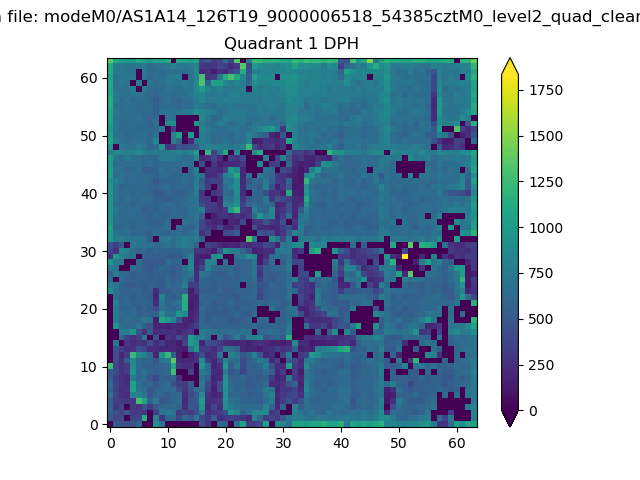 |
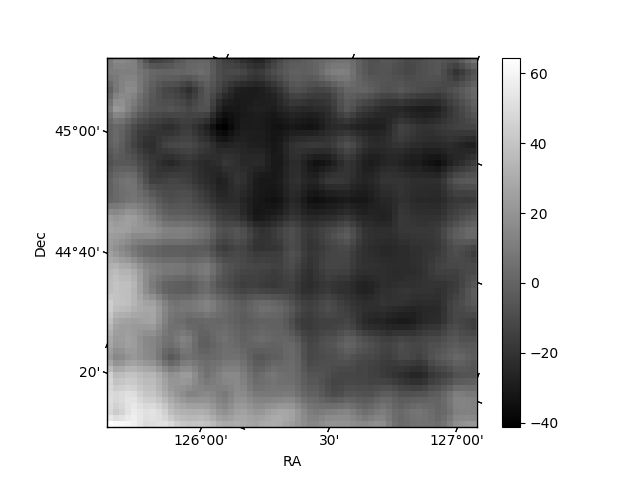
Quadrant B |
|---|---|---|---|
| Quadrant D | 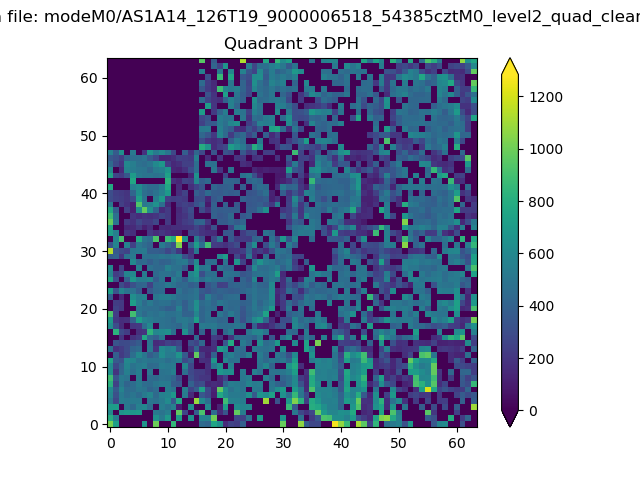 |
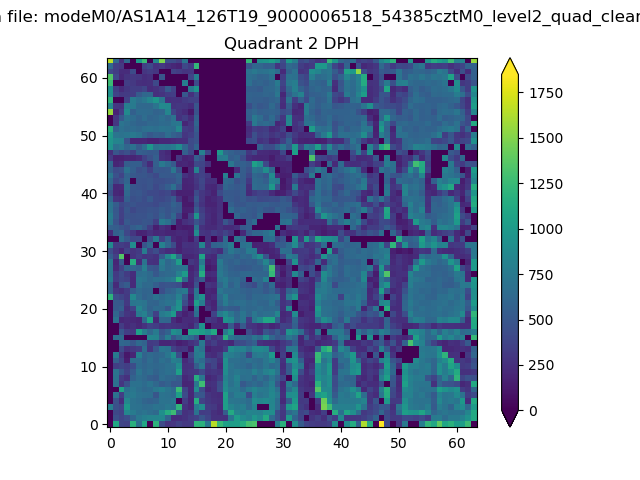 |
Quadrant C |
| Plot type | Count rate plots | Images |
|---|---|---|
| Comparison with Poisson distribution Blue bars denote a histogram of data divided into 1 sec bins. Red curve is a Poisson curve with rate = median count rate of data. |
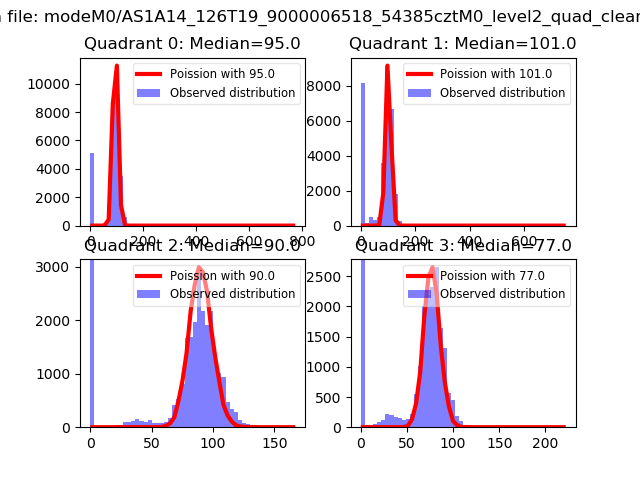 |
 |
| Quadrant-wise count rates Data is divided into 100 sec bins |
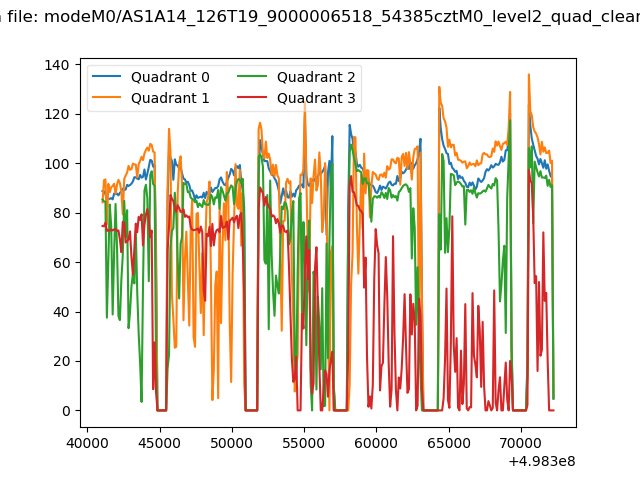 |
|
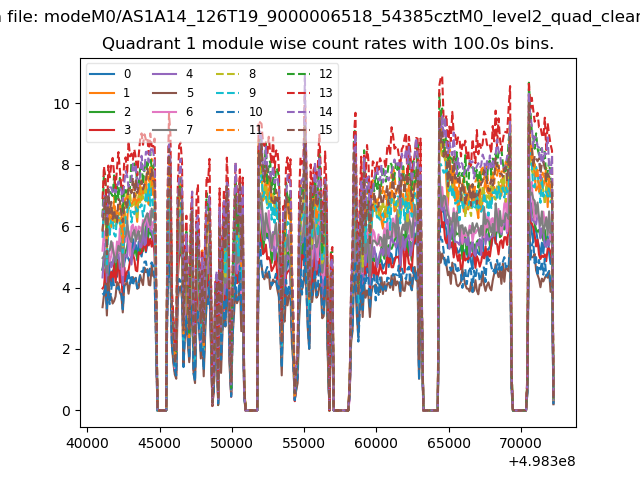
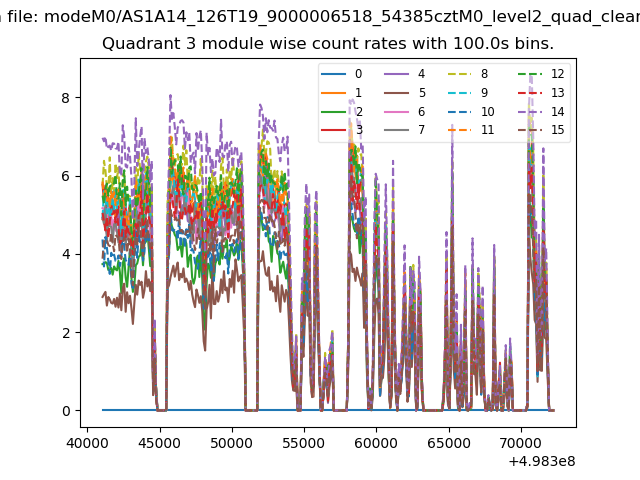
| Module-wise count rates for Quadrant A Data is divided into 100 sec bins |
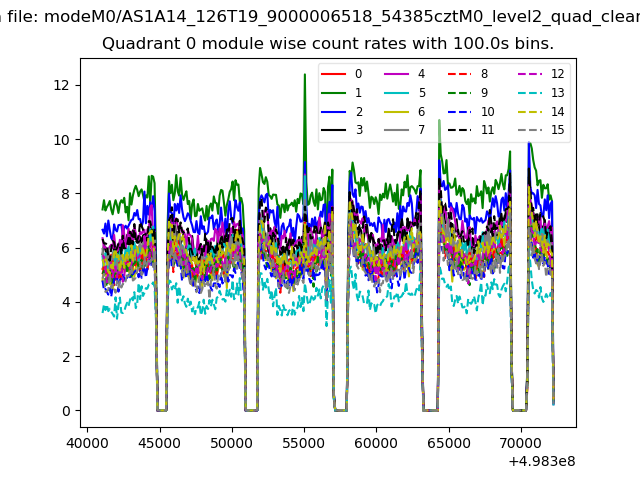 |
 |
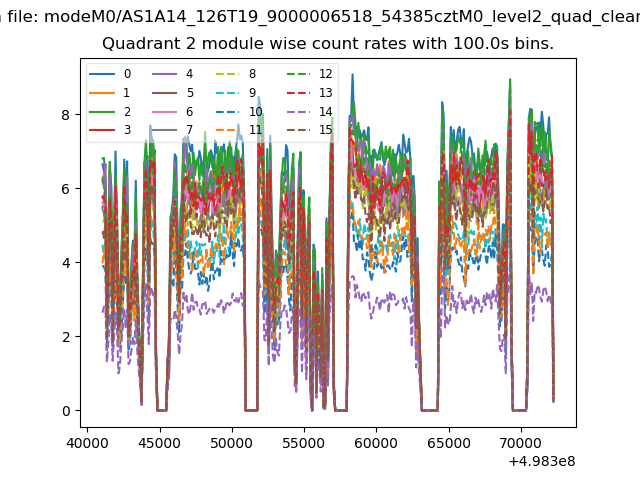
| Module-wise count rates for Quadrant B Data is divided into 100 sec bins |
 |
 |
| Module-wise count rates for Quadrant C Data is divided into 100 sec bins |
 |
 |
| Module-wise count rates for Quadrant D Data is divided into 100 sec bins |
 |
 |
| Parameter | Plot |
|---|---|
| CZT HV Monitor | 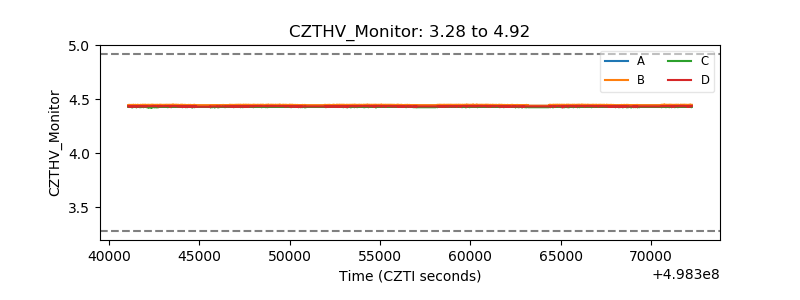 |
| D_VDD | 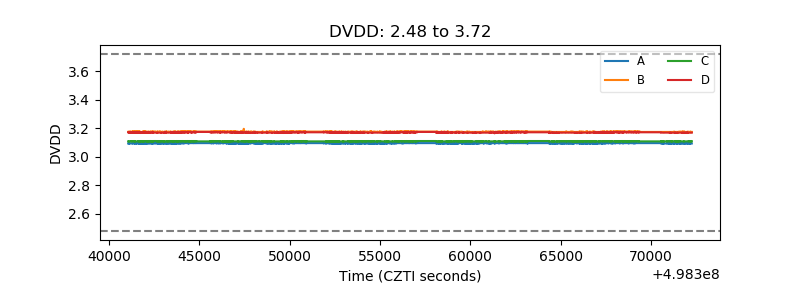 |
| Temperature 1 | 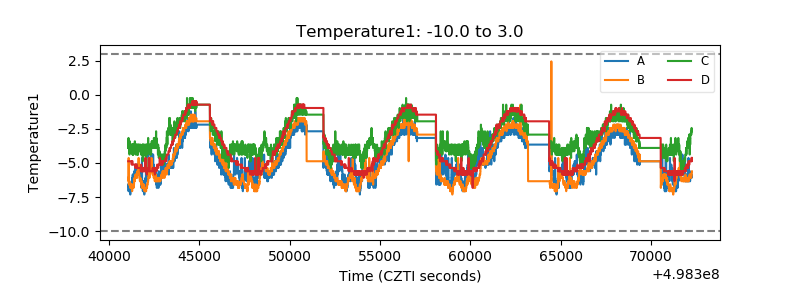 |
| Veto HV Monitor |  |
| Veto LLD | 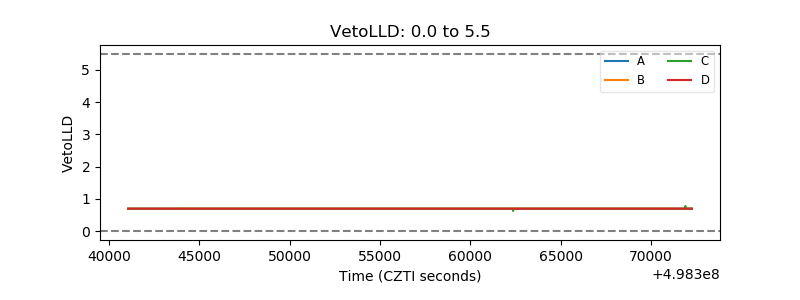 |
| Alpha Counter | 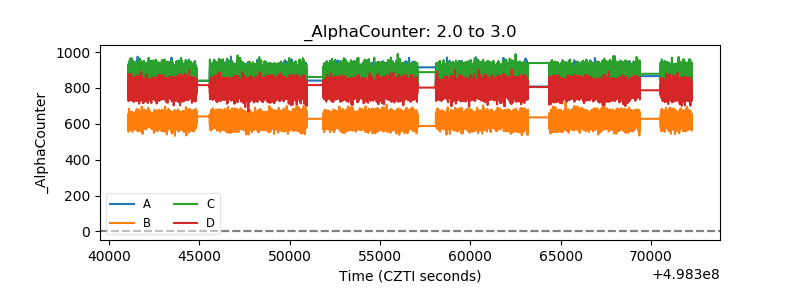 |
| _CPM_Rate | 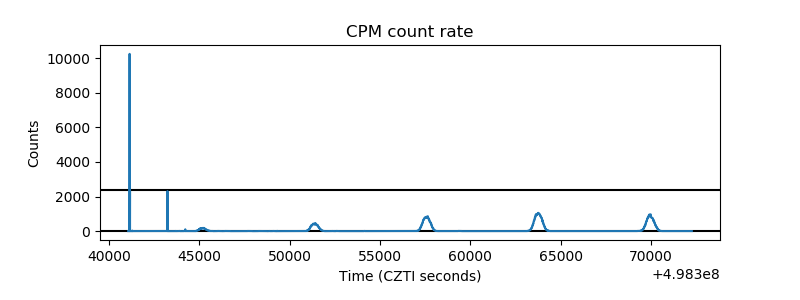 |
| CZT Counter | 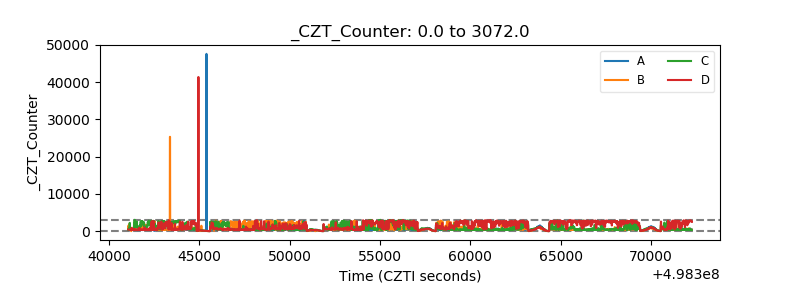 |
| +2.5 Volts monitor |  |
| +5 Volts monitor |  |
| _ROLL_ROT | 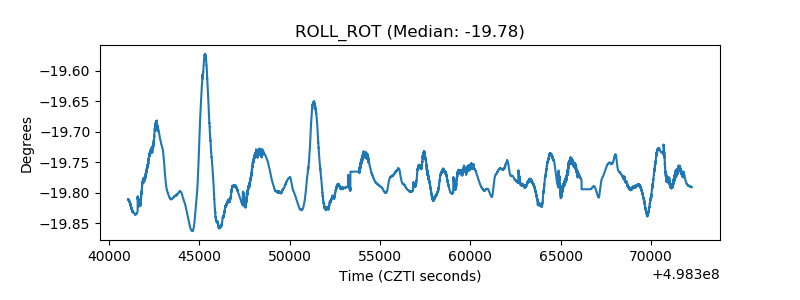 |
| _Roll_DEC | 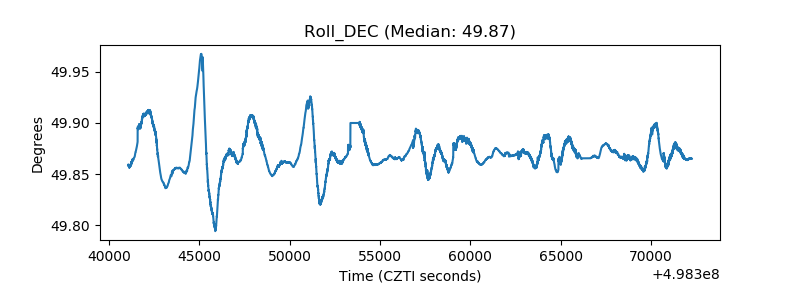 |
| _Roll_RA | 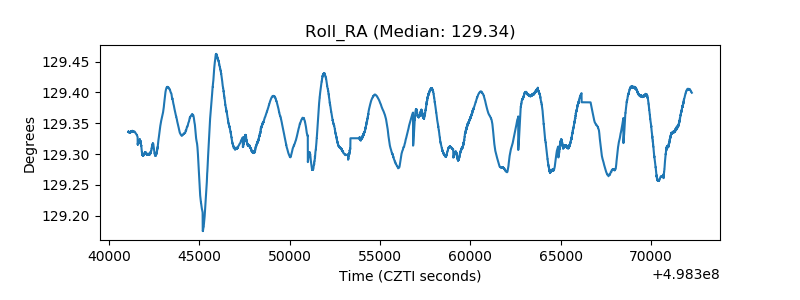 |
| Veto Counter | 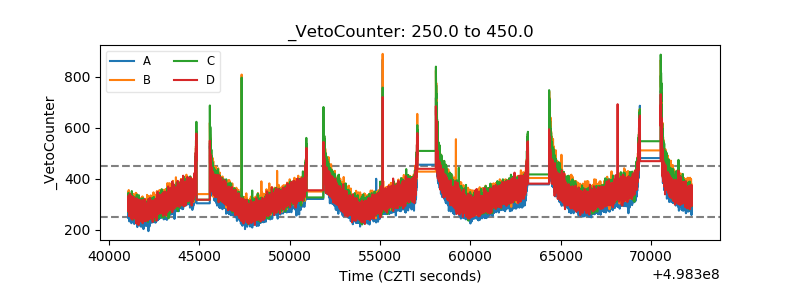 |