| Param | Original file | Final file |
|---|---|---|
| Filename | modeM0/AS1A14_126T19_9000006518_54388cztM0_level2.fits | modeM0/AS1A14_126T19_9000006518_54388cztM0_level2_quad_clean.evt |
| Size (bytes) | 683,432,640 | 80,881,920 |
| Size | 651.8 MB | 77.1 MB |
| Events in quadrant A | 2,746,226 | 602,841 |
| Events in quadrant B | 5,032,481 | 559,051 |
| Events in quadrant C | 4,029,421 | 558,375 |
| Events in quadrant D | 12,991,149 | 279,604 |
| Mode SS | |||
|---|---|---|---|
| Quadrant | BADHDUFLAG | Total packets | Discarded packets |
| A | 0 | 132 | 0 |
| B | 0 | 132 | 0 |
| C | 0 | 132 | 0 |
| D | 0 | 132 | 0 |
| Mode M0 | |||
|---|---|---|---|
| Quadrant | BADHDUFLAG | Total packets | Discarded packets |
| A | 0 | 13154 | 5 |
| B | 0 | 19665 | 1 |
| C | 0 | 16642 | 1 |
| D | 0 | 43049 | 29 |
| Mode M9 | |||
|---|---|---|---|
| Quadrant | BADHDUFLAG | Total packets | Discarded packets |
| A | 0 | 7 | 0 |
| B | 0 | 7 | 0 |
| C | 0 | 7 | 0 |
| D | 0 | 7 | 0 |
| Quadrant | Total seconds | Saturated seconds | Saturation percentage |
|---|---|---|---|
| A | 6428 | 108 | 1.680149% |
| B | 6432 | 1011 | 15.718284% |
| C | 6433 | 334 | 5.191979% |
| D | 6428 | 3494 | 54.355943% |
Noise dominated data is calculated using 1-second bins in cleaned event files. If a bin has >2000 counts, and if more than 50% of those come from <1% of pixels, then it is considered to be noise-dominated and hence unusable.
| Quadrant | # 1 sec bins | Bins with >0 counts | Bins with >2000 counts | High rate bins dominated by noise | Noise dominated (total time) | Noise dominated (detector-on time) | Marked lightcurve |
|---|---|---|---|---|---|---|---|
| A | 7147 | 6433 | 1 | 1 | 0.01% | 0.02% | 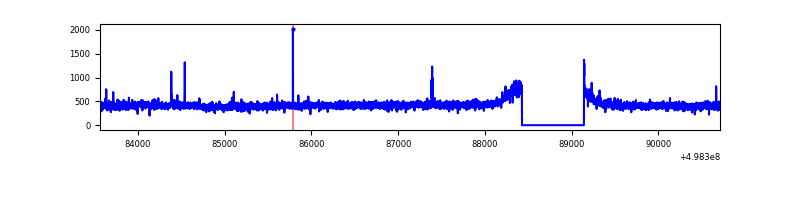 |
| B | 7147 | 6433 | 697 | 697 | 9.75% | 10.83% | 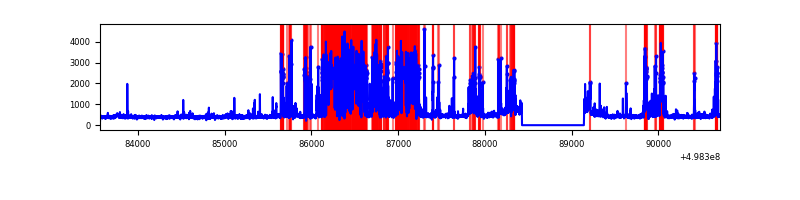 |
| C | 7148 | 6434 | 259 | 259 | 3.62% | 4.03% | 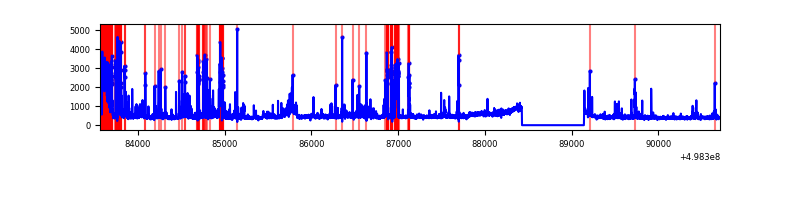 |
| D | 7147 | 6431 | 3382 | 3382 | 47.32% | 52.59% | 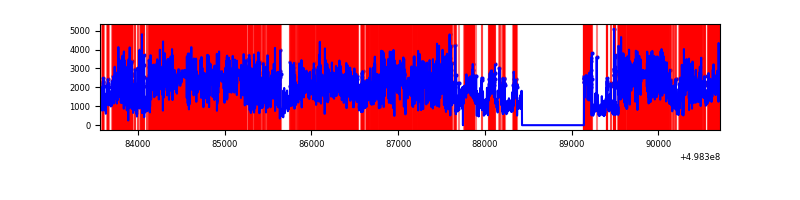 |
Top three noisy pixels from each quadrant. If the there are fewer than three noisy pixels in the level2.evt file, extra rows are filled as -1
| Pixel properties | Quadrant properties | ||||||
|---|---|---|---|---|---|---|---|
| Quadrant | DetID | PixID | Counts | Sigma | Mean | Median | Sigma |
| A | 4 | 3 | 22056 | 125.57 | 690 | 670 | 170.3 |
| A | 6 | 161 | 16936 | 95.51 | 690 | 670 | 170.3 |
| A | 13 | 254 | 14183 | 79.35 | 690 | 670 | 170.3 |
| B | 10 | 14 | 2351637 | 17262.06 | 627 | 604 | 136.2 |
| B | 0 | 171 | 64723 | 470.78 | 627 | 604 | 136.2 |
| B | 0 | 213 | 26476 | 189.96 | 627 | 604 | 136.2 |
| C | 1 | 241 | 403608 | 2280.27 | 651 | 644 | 176.7 |
| C | 14 | 254 | 396452 | 2239.77 | 651 | 644 | 176.7 |
| C | 13 | 16 | 290083 | 1637.86 | 651 | 644 | 176.7 |
| D | 8 | 176 | 9045708 | 62354.74 | 506 | 480 | 145.1 |
| D | 2 | 172 | 1363494 | 9396.16 | 506 | 480 | 145.1 |
| D | 2 | 252 | 224164 | 1542.0 | 506 | 480 | 145.1 |
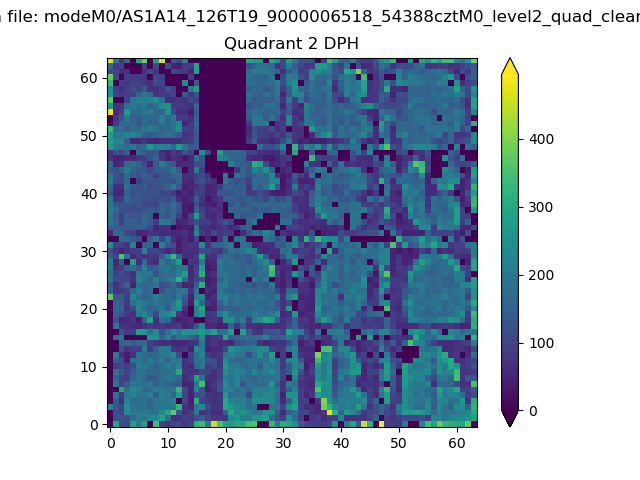
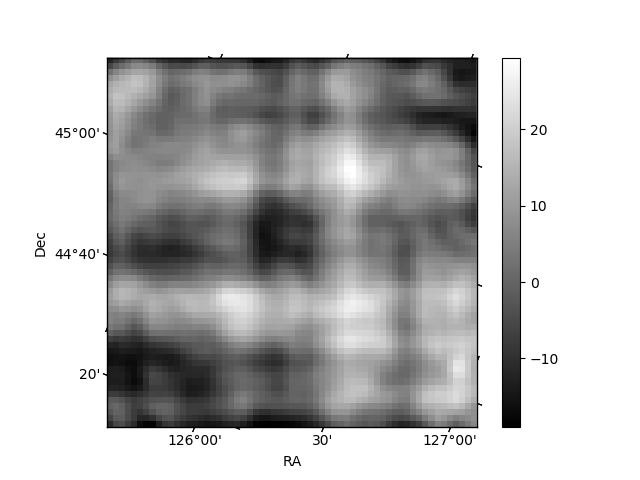
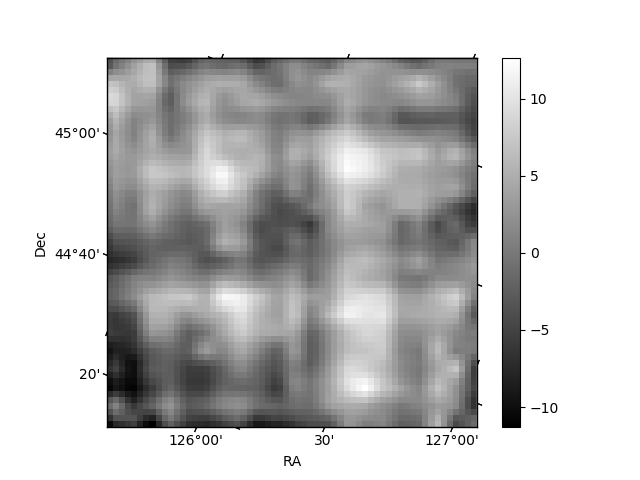
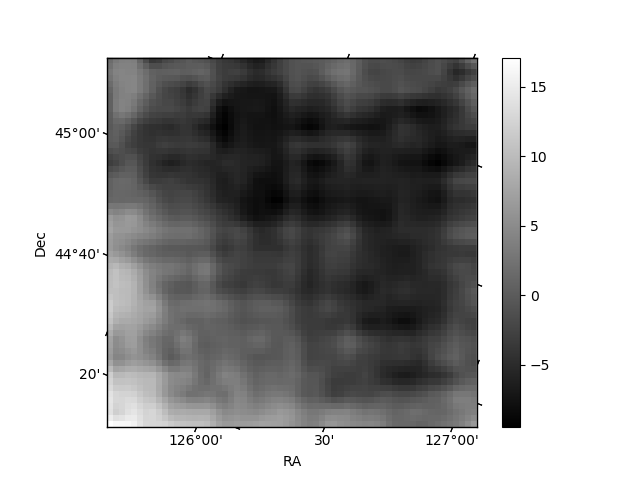
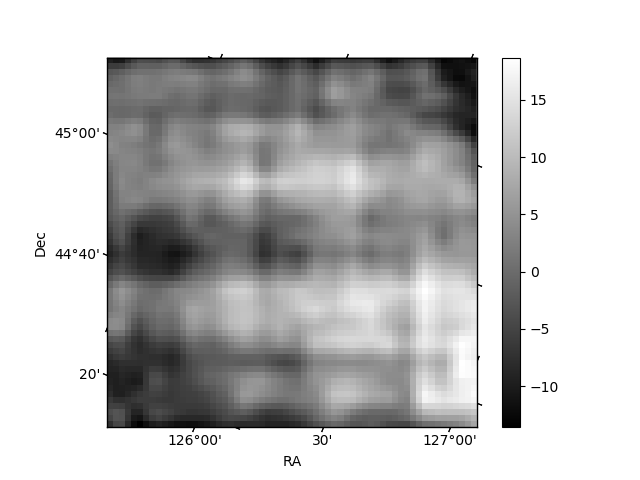
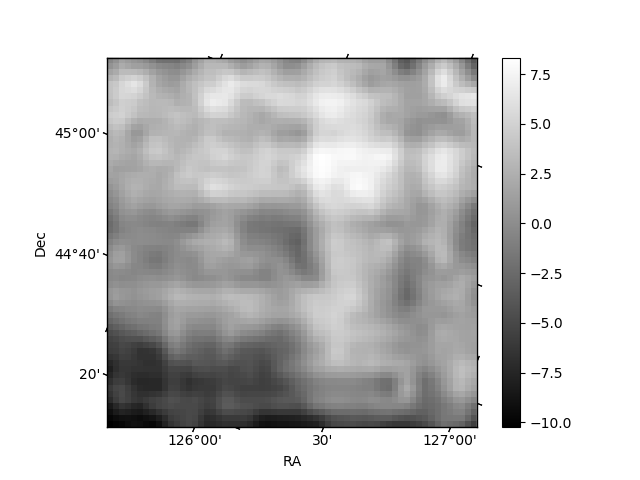
Histogram calculated using DETX and DETY for each event in the final _common_clean file
| Quadrant A | 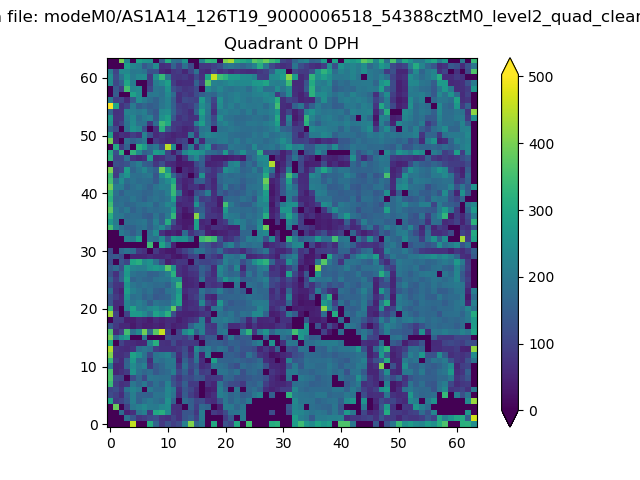 |
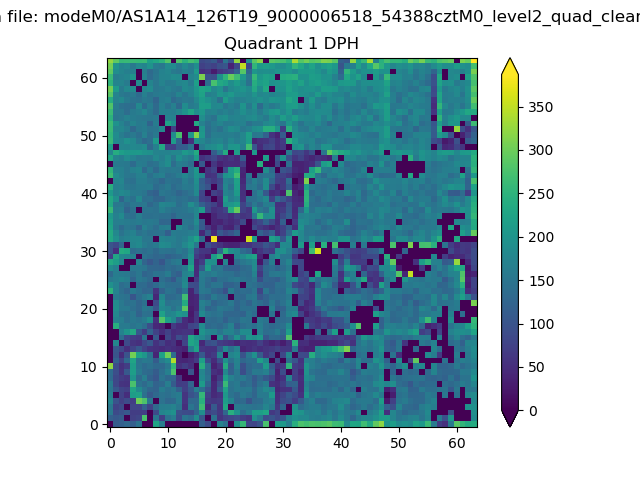 |
Quadrant B |
|---|---|---|---|
| Quadrant D | 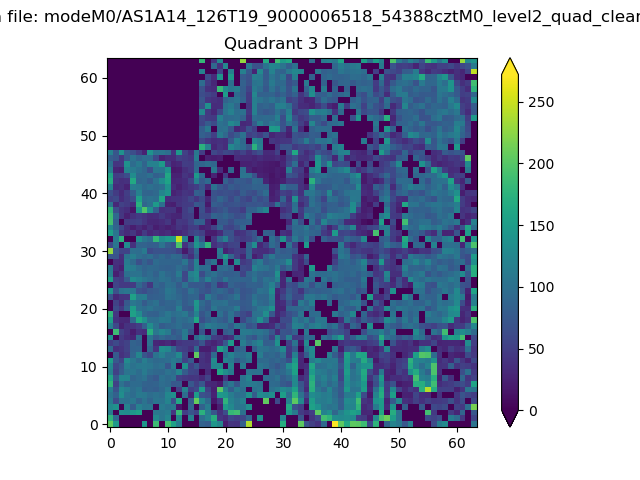 |
 |
Quadrant C |
| Plot type | Count rate plots | Images |
|---|---|---|
| Comparison with Poisson distribution Blue bars denote a histogram of data divided into 1 sec bins. Red curve is a Poisson curve with rate = median count rate of data. |
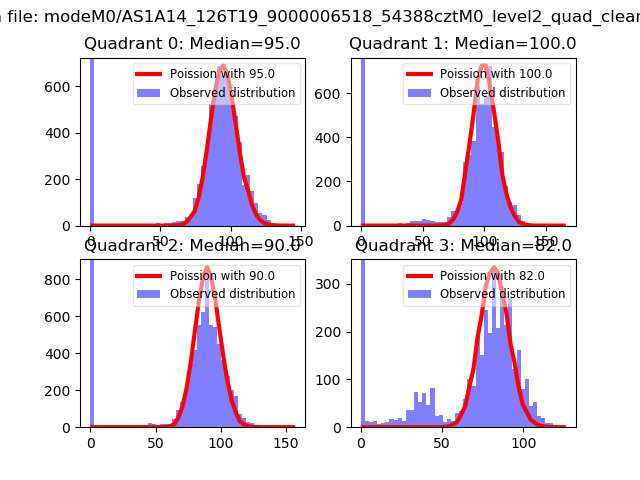 |
 |
| Quadrant-wise count rates Data is divided into 100 sec bins |
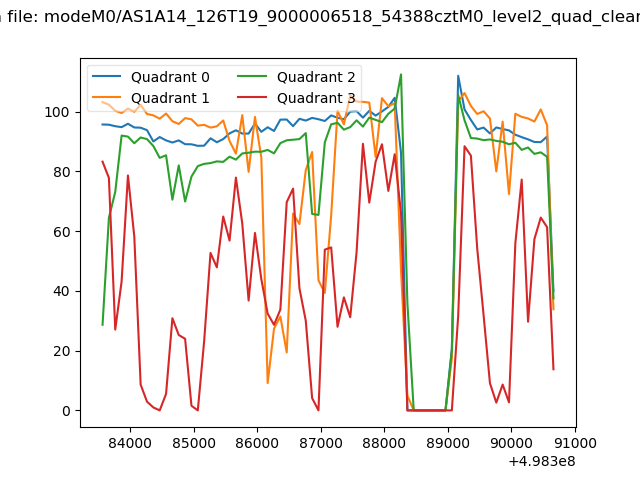 |
|
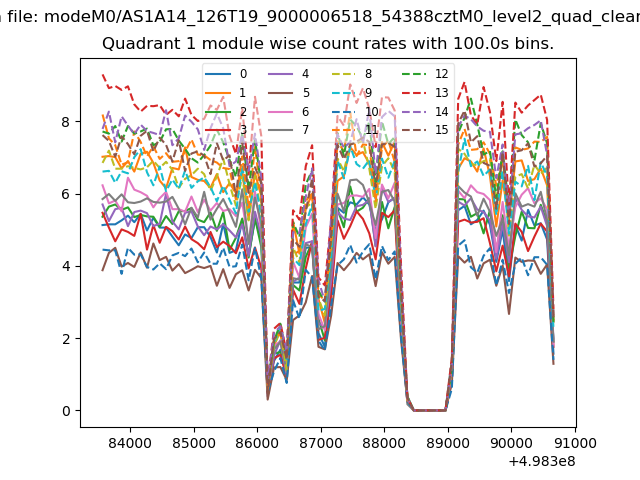
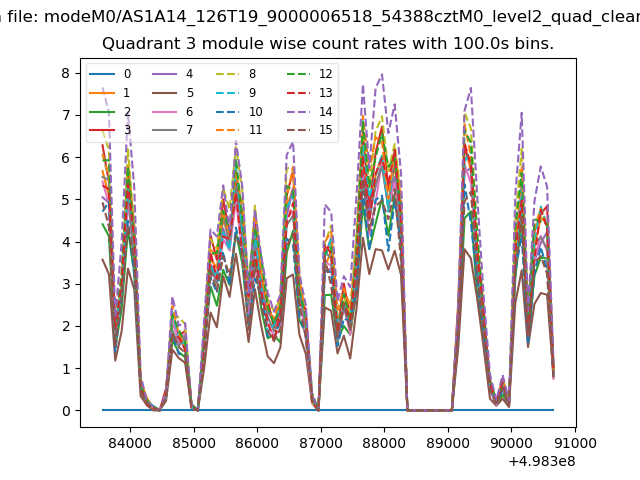
| Module-wise count rates for Quadrant A Data is divided into 100 sec bins |
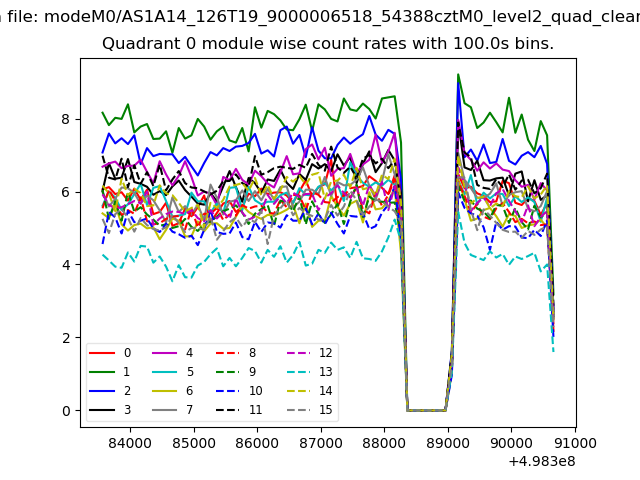 |
 |
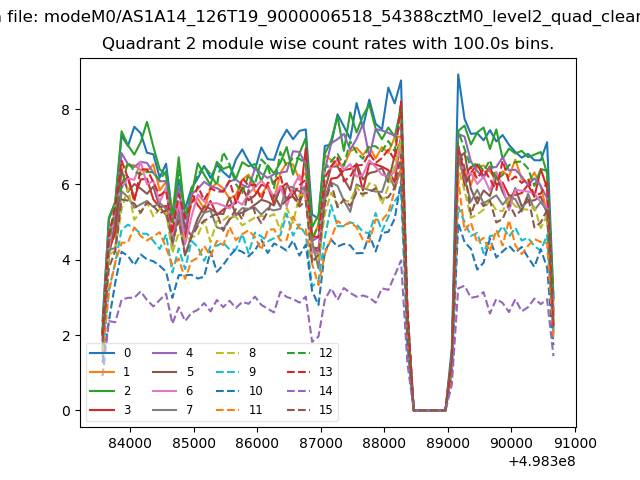
| Module-wise count rates for Quadrant B Data is divided into 100 sec bins |
 |
 |
| Module-wise count rates for Quadrant C Data is divided into 100 sec bins |
 |
 |
| Module-wise count rates for Quadrant D Data is divided into 100 sec bins |
 |
 |
| Parameter | Plot |
|---|---|
| CZT HV Monitor | 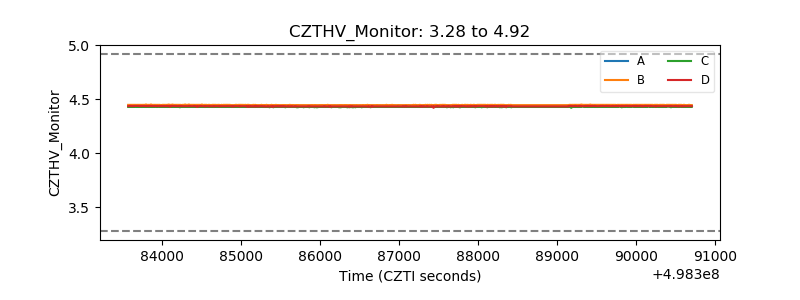 |
| D_VDD | 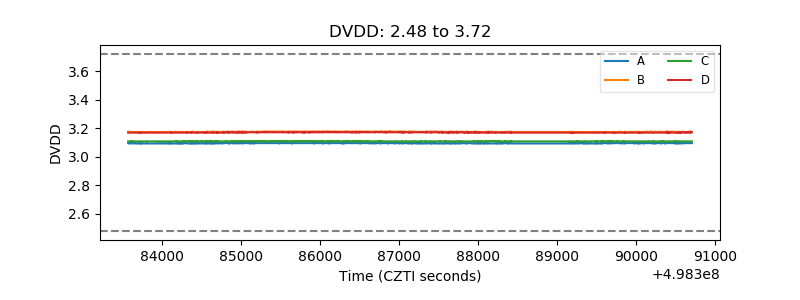 |
| Temperature 1 | 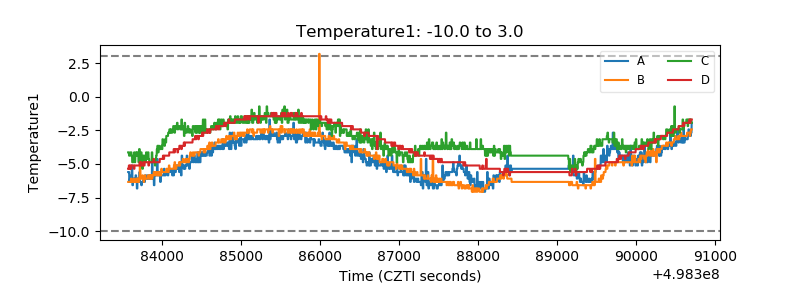 |
| Veto HV Monitor | 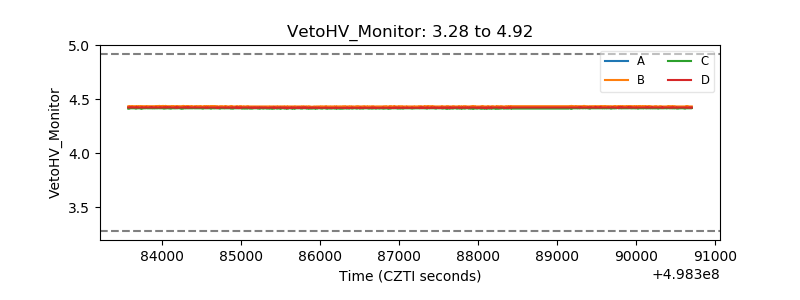 |
| Veto LLD | 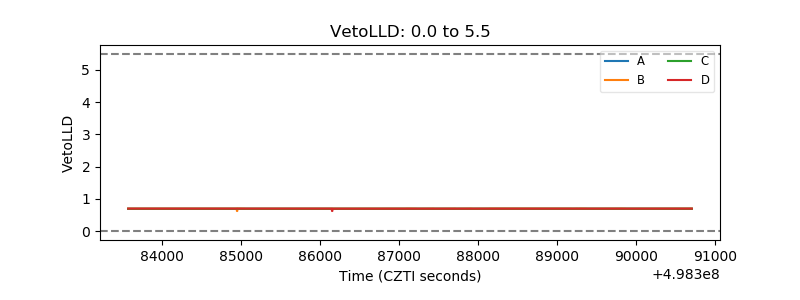 |
| Alpha Counter | 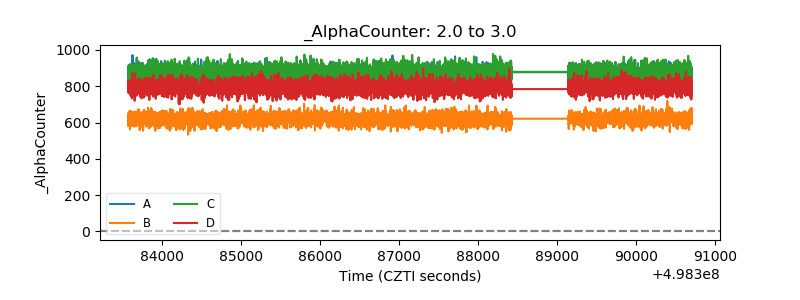 |
| _CPM_Rate | 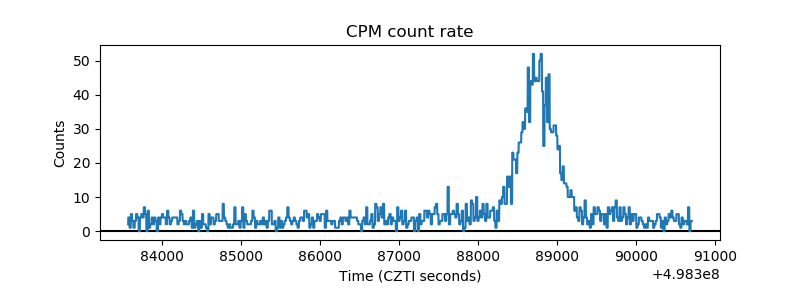 |
| CZT Counter | 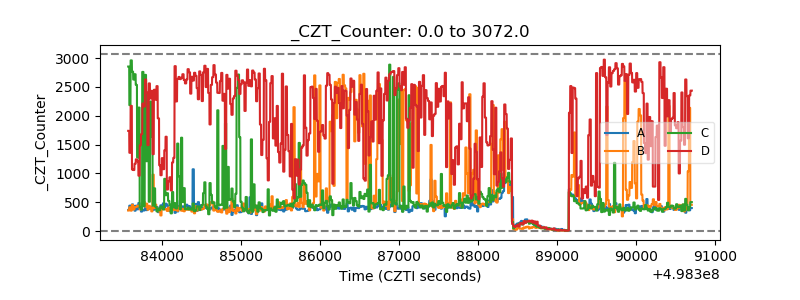 |
| +2.5 Volts monitor | 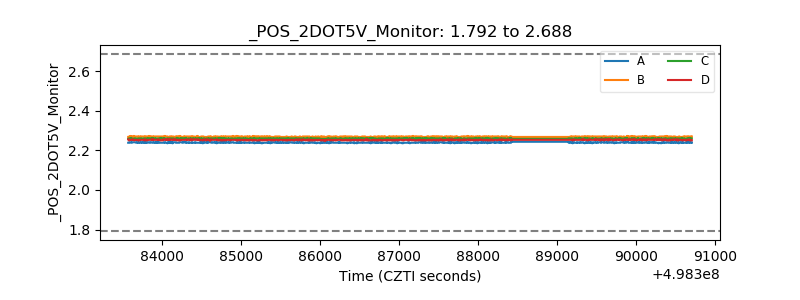 |
| +5 Volts monitor | 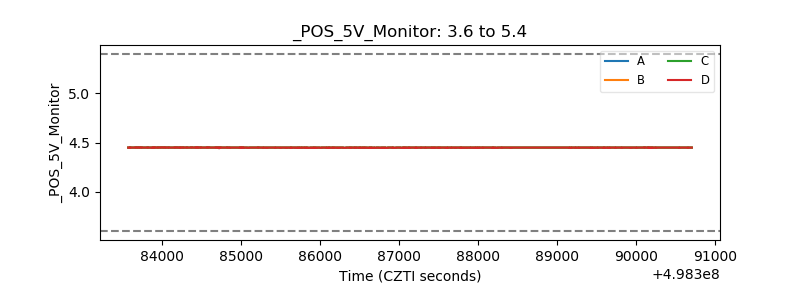 |
| _ROLL_ROT | 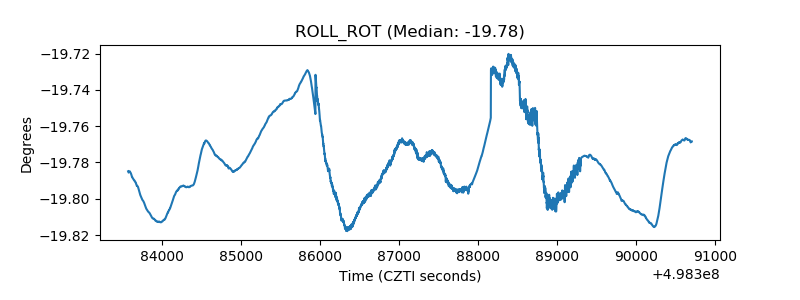 |
| _Roll_DEC | 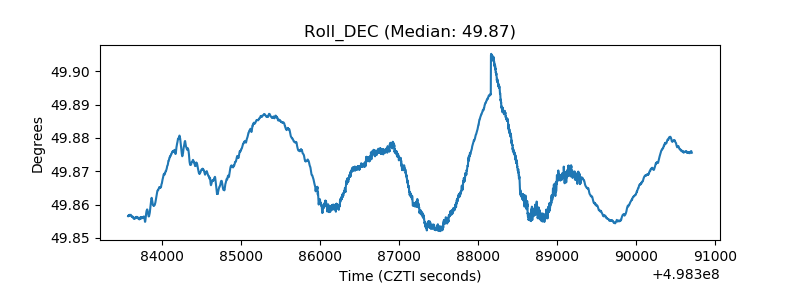 |
| _Roll_RA | 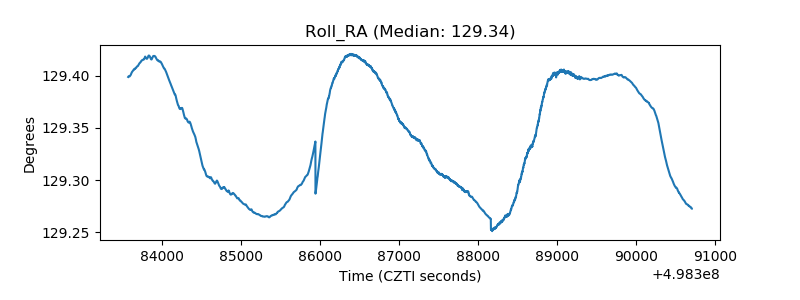 |
| Veto Counter | 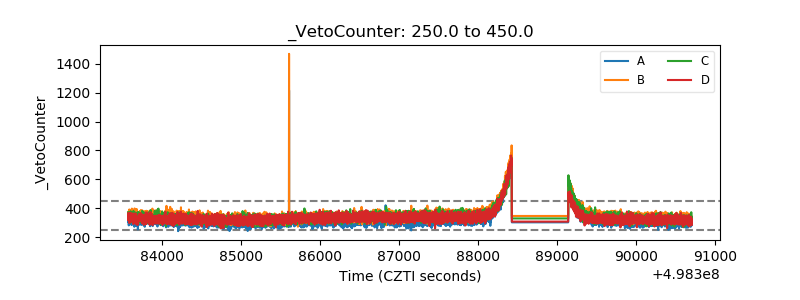 |