| Param | Original file | Final file |
|---|---|---|
| Filename | modeM0/AS1A14_126T19_9000006518_54389cztM0_level2.fits | modeM0/AS1A14_126T19_9000006518_54389cztM0_level2_quad_clean.evt |
| Size (bytes) | 798,600,960 | 93,977,280 |
| Size | 761.6 MB | 89.6 MB |
| Events in quadrant A | 3,257,775 | 703,173 |
| Events in quadrant B | 6,359,455 | 668,976 |
| Events in quadrant C | 4,351,466 | 671,309 |
| Events in quadrant D | 15,008,382 | 277,458 |
| Mode SS | |||
|---|---|---|---|
| Quadrant | BADHDUFLAG | Total packets | Discarded packets |
| A | 0 | 150 | 0 |
| B | 0 | 150 | 0 |
| C | 0 | 150 | 0 |
| D | 0 | 150 | 0 |
| Mode M0 | |||
|---|---|---|---|
| Quadrant | BADHDUFLAG | Total packets | Discarded packets |
| A | 0 | 15562 | 0 |
| B | 0 | 24256 | 0 |
| C | 0 | 18379 | 0 |
| D | 0 | 49826 | 0 |
| Quadrant | Total seconds | Saturated seconds | Saturation percentage |
|---|---|---|---|
| A | 7537 | 164 | 2.175932% |
| B | 7538 | 1158 | 15.362165% |
| C | 7537 | 186 | 2.467825% |
| D | 7537 | 4457 | 59.134934% |
Noise dominated data is calculated using 1-second bins in cleaned event files. If a bin has >2000 counts, and if more than 50% of those come from <1% of pixels, then it is considered to be noise-dominated and hence unusable.
| Quadrant | # 1 sec bins | Bins with >0 counts | Bins with >2000 counts | High rate bins dominated by noise | Noise dominated (total time) | Noise dominated (detector-on time) | Marked lightcurve |
|---|---|---|---|---|---|---|---|
| A | 7537 | 7537 | 0 | 0 | 0.00% | 0.00% | 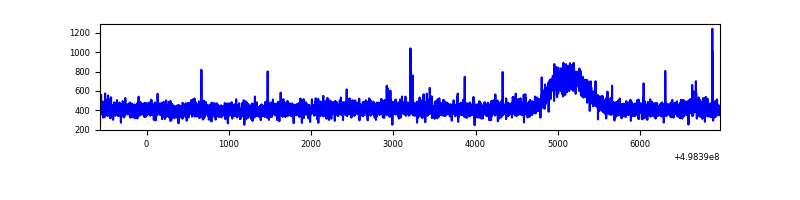 |
| B | 7538 | 7538 | 737 | 737 | 9.78% | 9.78% | 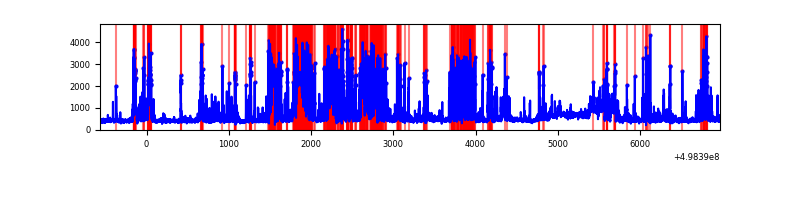 |
| C | 7537 | 7537 | 79 | 79 | 1.05% | 1.05% | 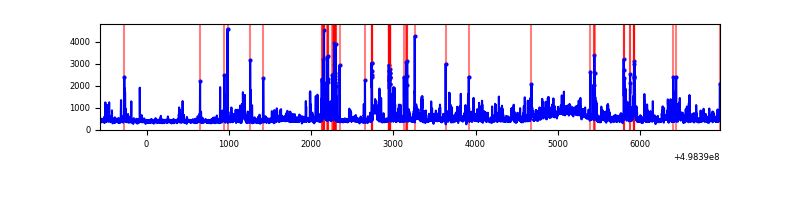 |
| D | 7537 | 7537 | 4028 | 4028 | 53.44% | 53.44% | 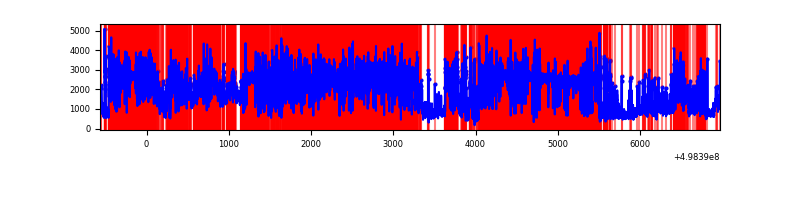 |
Top three noisy pixels from each quadrant. If the there are fewer than three noisy pixels in the level2.evt file, extra rows are filled as -1
| Pixel properties | Quadrant properties | ||||||
|---|---|---|---|---|---|---|---|
| Quadrant | DetID | PixID | Counts | Sigma | Mean | Median | Sigma |
| A | 4 | 3 | 22147 | 106.15 | 823 | 801 | 201.1 |
| A | 7 | 221 | 20907 | 99.98 | 823 | 801 | 201.1 |
| A | 13 | 254 | 16251 | 76.83 | 823 | 801 | 201.1 |
| B | 10 | 14 | 2703774 | 16571.58 | 759 | 732 | 163.1 |
| B | 4 | 81 | 297528 | 1819.57 | 759 | 732 | 163.1 |
| B | 0 | 171 | 153479 | 936.45 | 759 | 732 | 163.1 |
| C | 9 | 38 | 464560 | 2164.5 | 791 | 785 | 214.3 |
| C | 14 | 254 | 138147 | 641.09 | 791 | 785 | 214.3 |
| C | 1 | 241 | 117733 | 545.81 | 791 | 785 | 214.3 |
| D | 8 | 176 | 12307388 | 84249.51 | 513 | 489 | 146.1 |
| D | 15 | 108 | 182604 | 1246.7 | 513 | 489 | 146.1 |
| D | 10 | 181 | 147074 | 1003.48 | 513 | 489 | 146.1 |
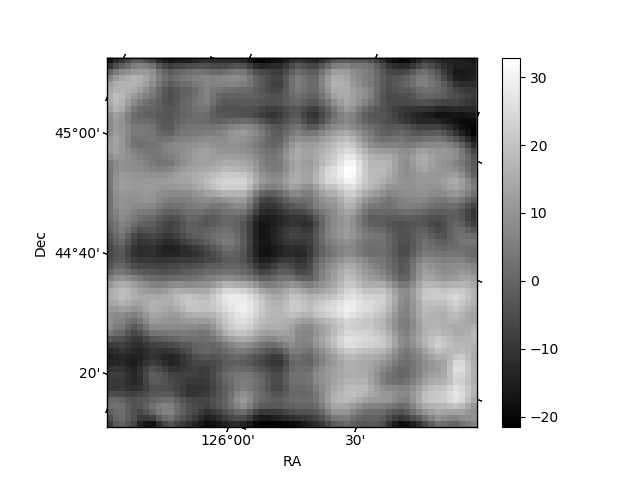
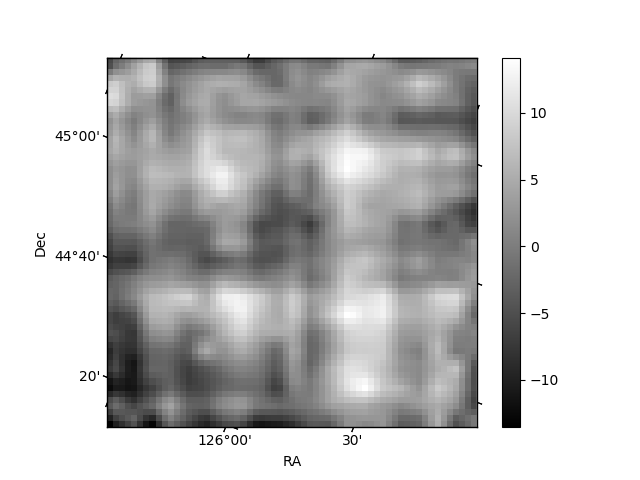
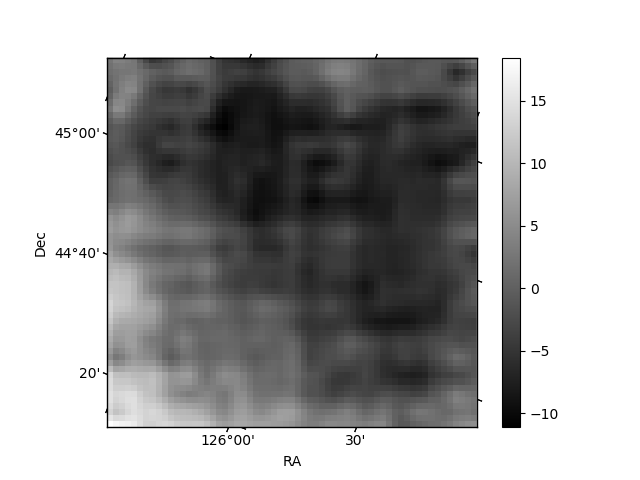
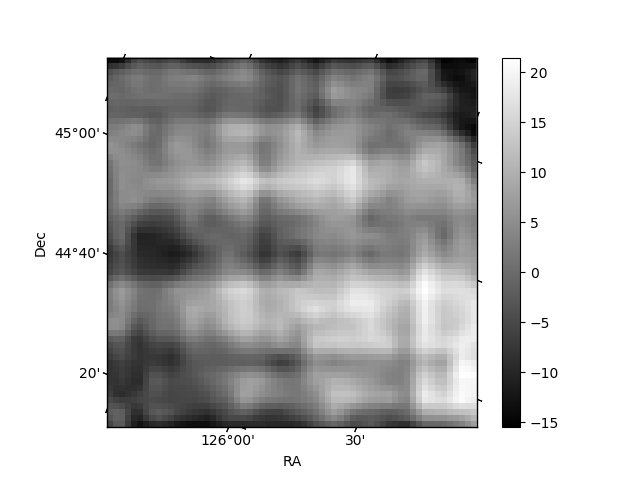
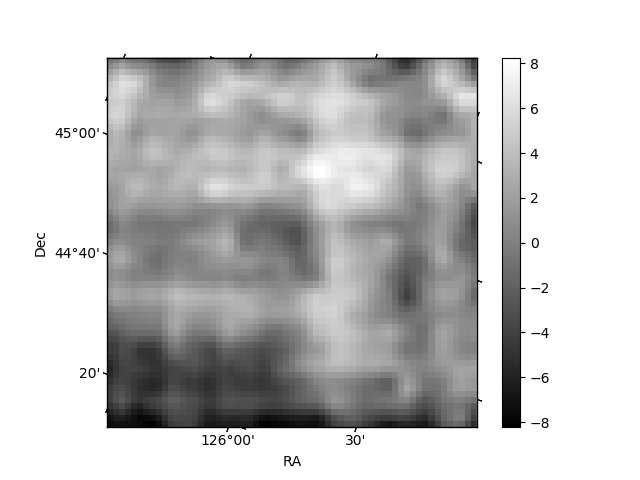
Histogram calculated using DETX and DETY for each event in the final _common_clean file
| Quadrant A | 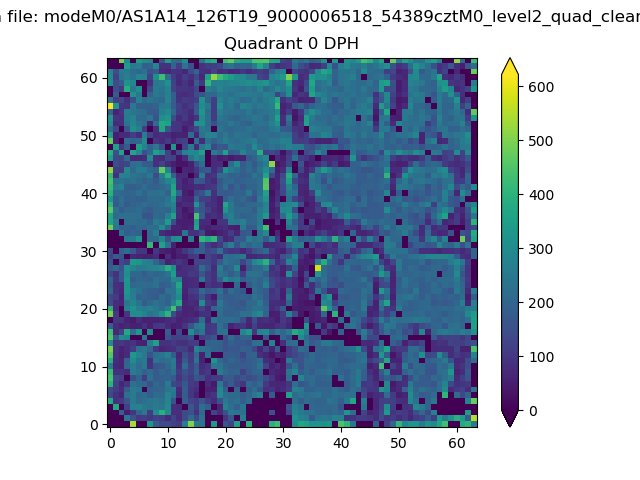 |
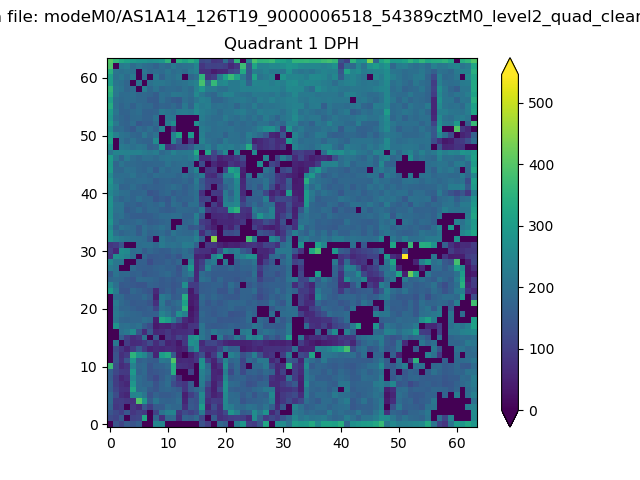 |
Quadrant B |
|---|---|---|---|
| Quadrant D | 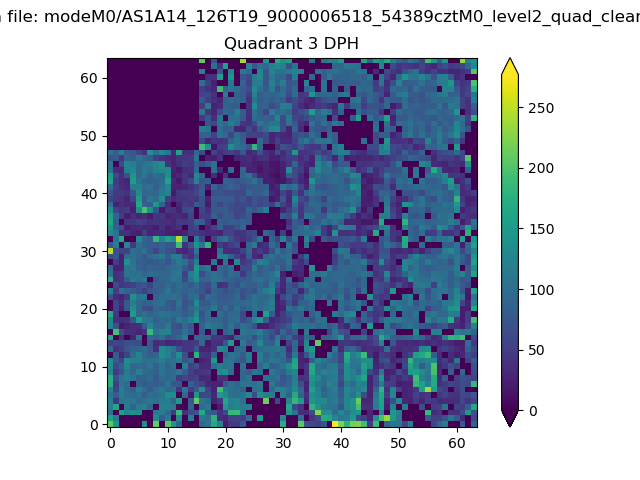 |
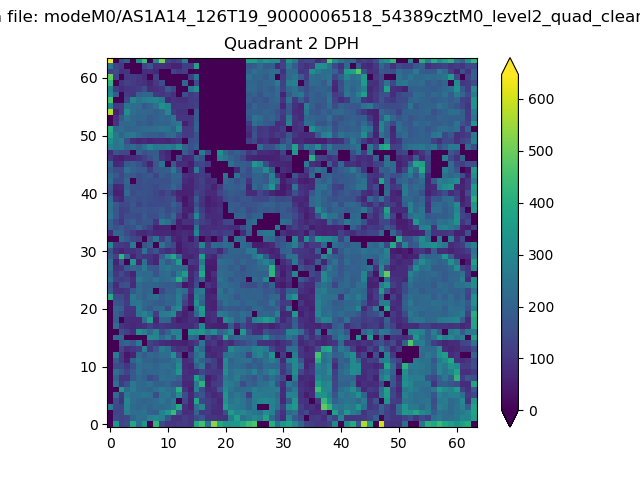 |
Quadrant C |
| Plot type | Count rate plots | Images |
|---|---|---|
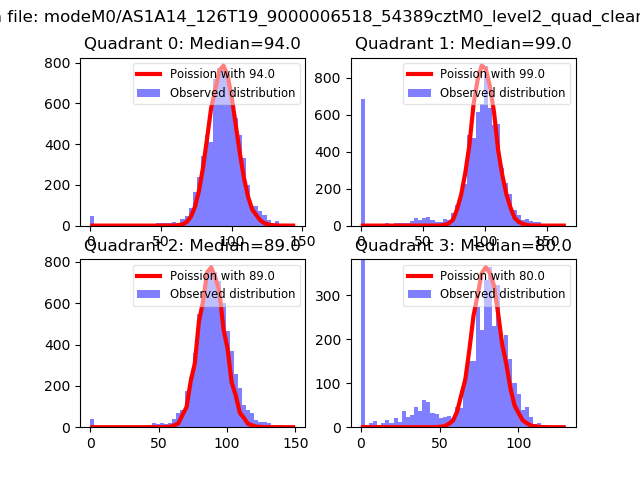
| Comparison with Poisson distribution Blue bars denote a histogram of data divided into 1 sec bins. Red curve is a Poisson curve with rate = median count rate of data. |
 |
 |
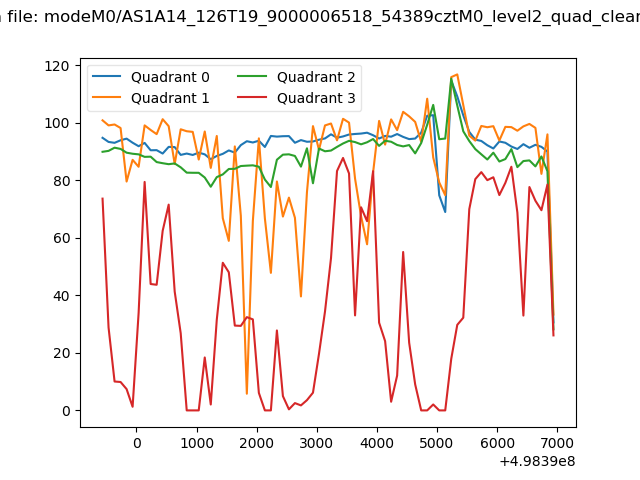
| Quadrant-wise count rates Data is divided into 100 sec bins |
 |
|
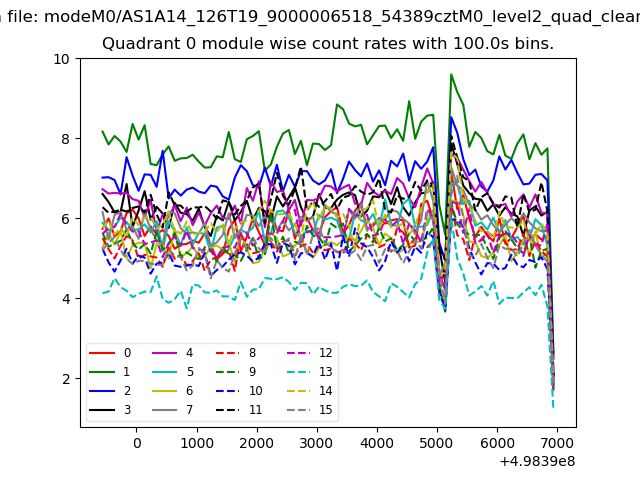
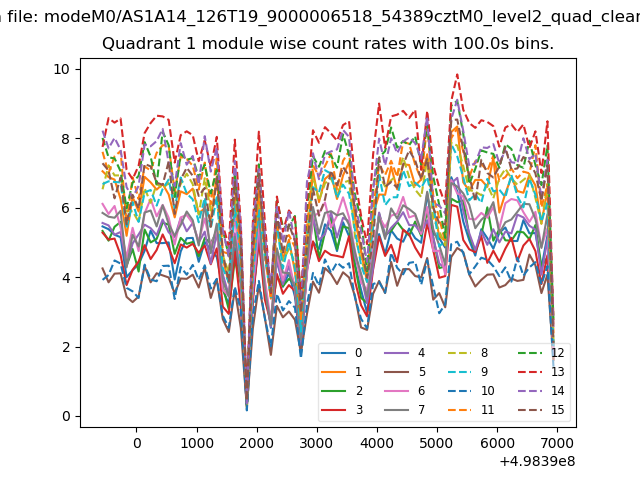
| Module-wise count rates for Quadrant A Data is divided into 100 sec bins |
 |
 |
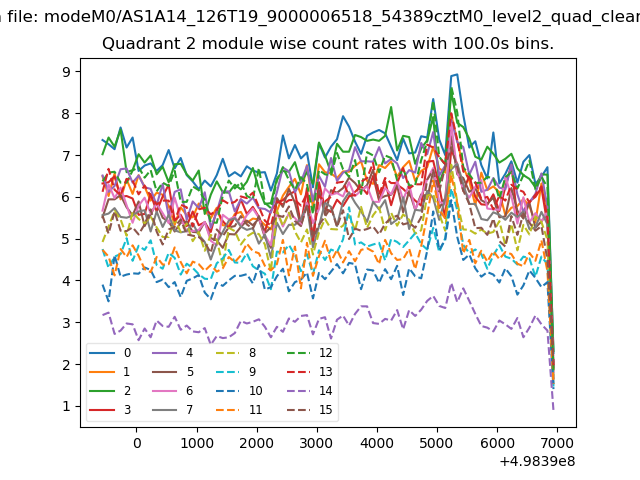
| Module-wise count rates for Quadrant B Data is divided into 100 sec bins |
 |
 |
| Module-wise count rates for Quadrant C Data is divided into 100 sec bins |
 |
 |
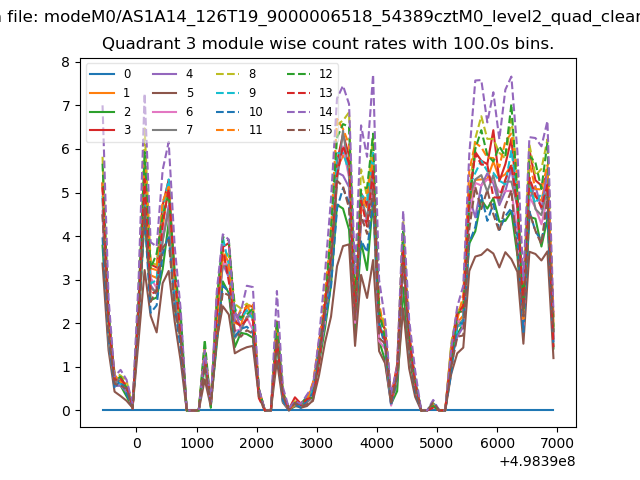
| Module-wise count rates for Quadrant D Data is divided into 100 sec bins |
 |
 |
| Parameter | Plot |
|---|---|
| CZT HV Monitor | 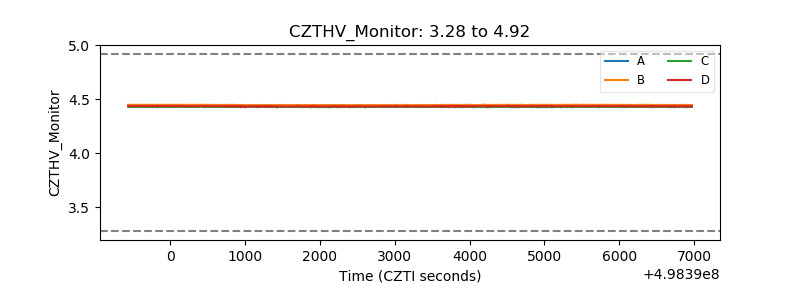 |
| D_VDD | 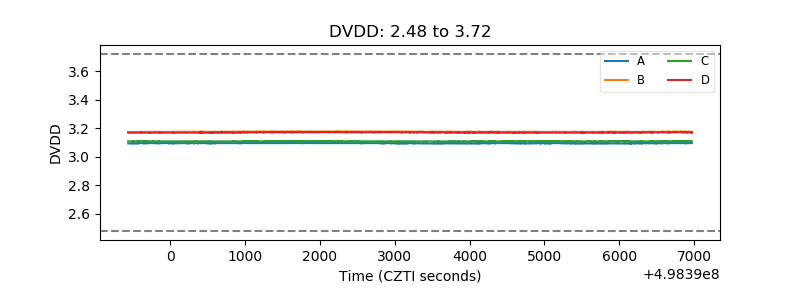 |
| Temperature 1 | 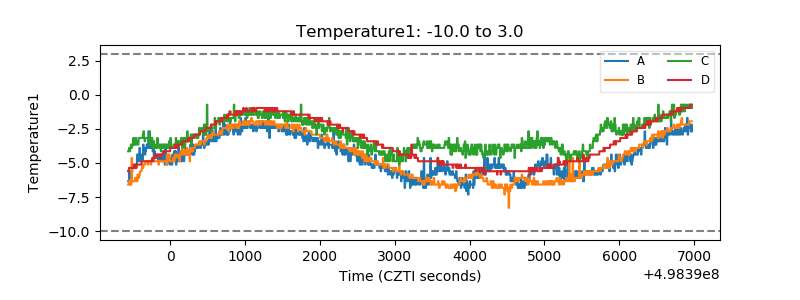 |
| Veto HV Monitor | 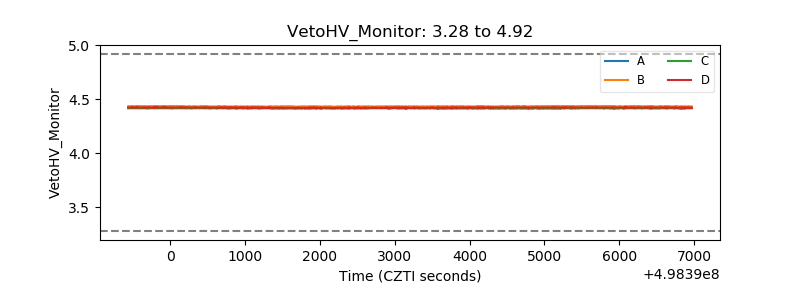 |
| Veto LLD | 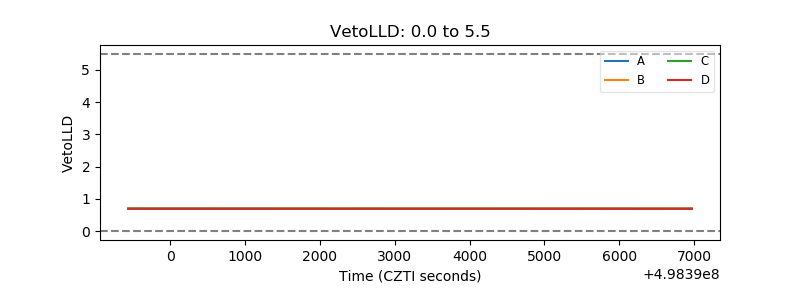 |
| Alpha Counter | 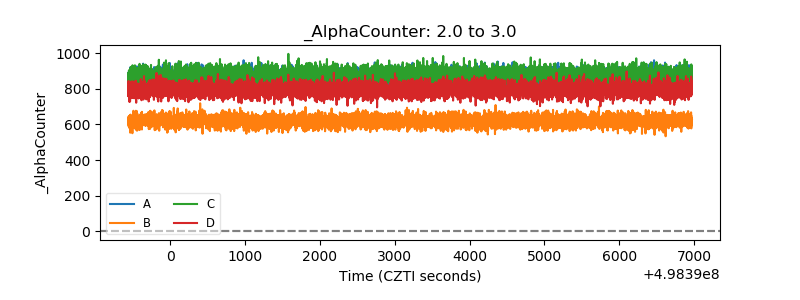 |
| _CPM_Rate | 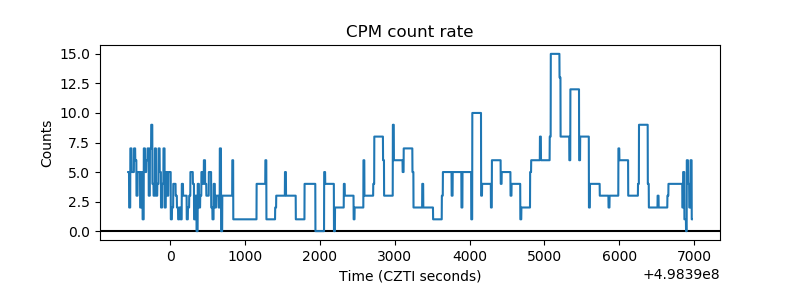 |
| CZT Counter | 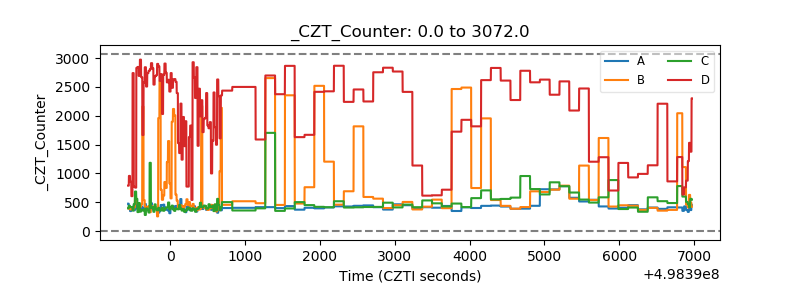 |
| +2.5 Volts monitor | 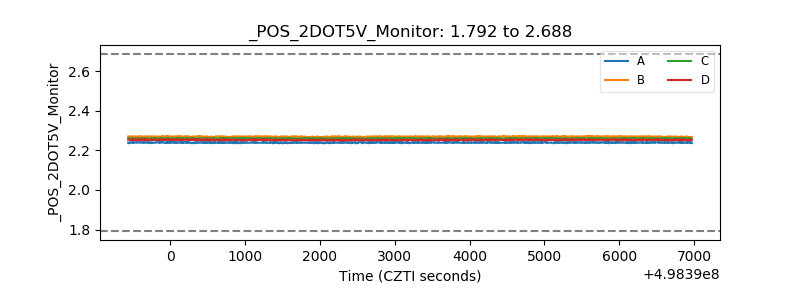 |
| +5 Volts monitor | 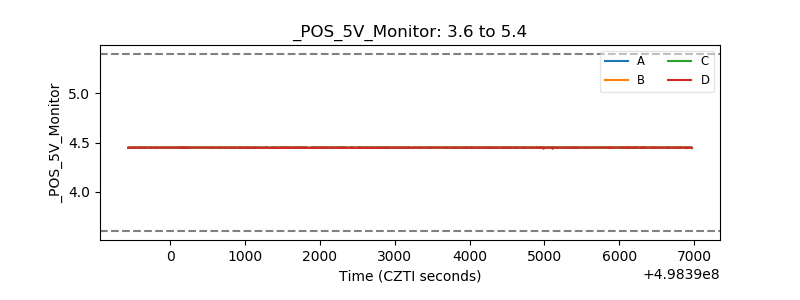 |
| _ROLL_ROT | 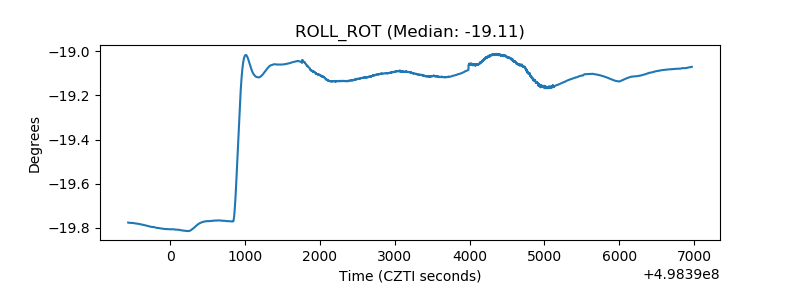 |
| _Roll_DEC | 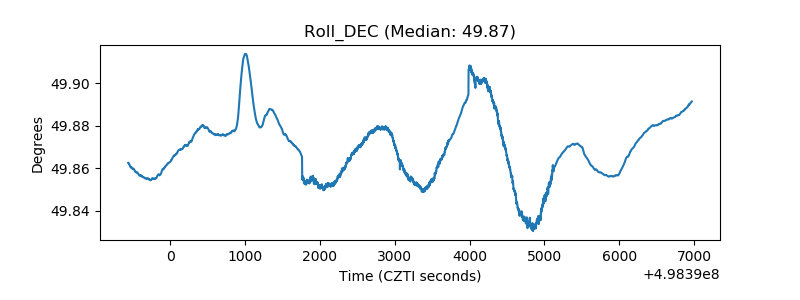 |
| _Roll_RA | 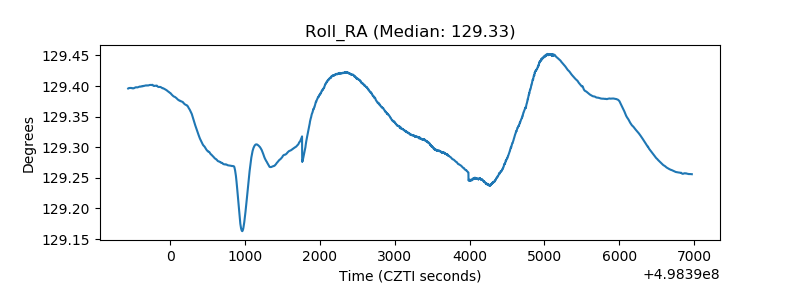 |
| Veto Counter | 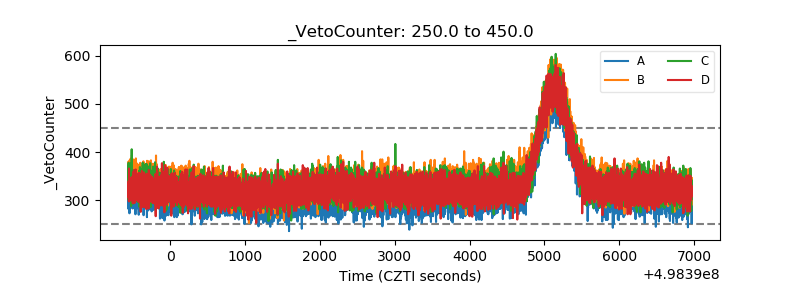 |