| Param | Original file | Final file |
|---|---|---|
| Filename | modeM0/AS1A14_126T19_9000006518_54390cztM0_level2.fits | modeM0/AS1A14_126T19_9000006518_54390cztM0_level2_quad_clean.evt |
| Size (bytes) | 647,956,800 | 100,892,160 |
| Size | 617.9 MB | 96.2 MB |
| Events in quadrant A | 3,315,867 | 697,629 |
| Events in quadrant B | 4,567,481 | 726,296 |
| Events in quadrant C | 4,071,884 | 655,264 |
| Events in quadrant D | 11,449,873 | 454,851 |
| Mode SS | |||
|---|---|---|---|
| Quadrant | BADHDUFLAG | Total packets | Discarded packets |
| A | 0 | 150 | 0 |
| B | 0 | 150 | 0 |
| C | 0 | 150 | 0 |
| D | 0 | 150 | 0 |
| Mode M0 | |||
|---|---|---|---|
| Quadrant | BADHDUFLAG | Total packets | Discarded packets |
| A | 0 | 15385 | 1 |
| B | 0 | 18786 | 0 |
| C | 0 | 17418 | 0 |
| D | 0 | 39269 | 0 |
| Quadrant | Total seconds | Saturated seconds | Saturation percentage |
|---|---|---|---|
| A | 7481 | 7 | 0.093570% |
| B | 7481 | 272 | 3.635878% |
| C | 7482 | 111 | 1.483561% |
| D | 7482 | 2285 | 30.539963% |
Noise dominated data is calculated using 1-second bins in cleaned event files. If a bin has >2000 counts, and if more than 50% of those come from <1% of pixels, then it is considered to be noise-dominated and hence unusable.
| Quadrant | # 1 sec bins | Bins with >0 counts | Bins with >2000 counts | High rate bins dominated by noise | Noise dominated (total time) | Noise dominated (detector-on time) | Marked lightcurve |
|---|---|---|---|---|---|---|---|
| A | 7481 | 7481 | 0 | 0 | 0.00% | 0.00% | 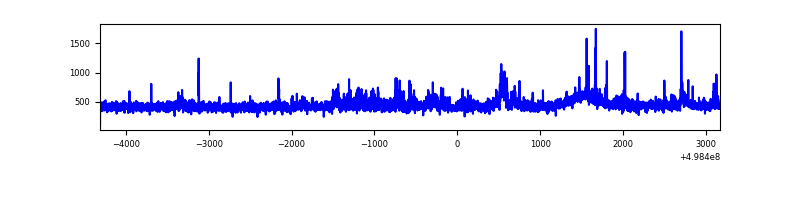 |
| B | 7481 | 7481 | 210 | 210 | 2.81% | 2.81% | 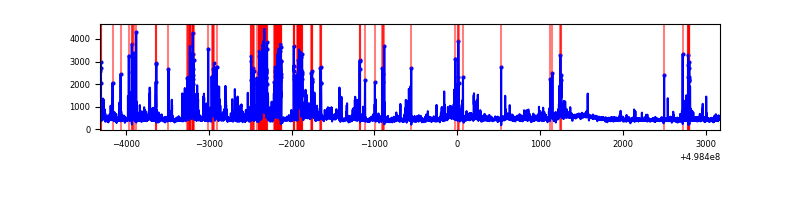 |
| C | 7482 | 7482 | 105 | 105 | 1.40% | 1.40% | 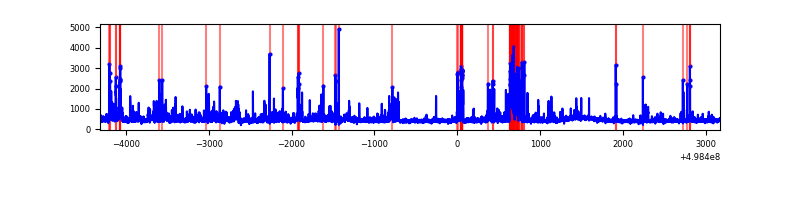 |
| D | 7482 | 7482 | 2161 | 2161 | 28.88% | 28.88% | 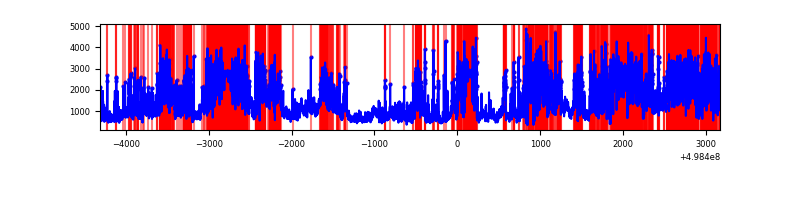 |
Top three noisy pixels from each quadrant. If the there are fewer than three noisy pixels in the level2.evt file, extra rows are filled as -1
| Pixel properties | Quadrant properties | ||||||
|---|---|---|---|---|---|---|---|
| Quadrant | DetID | PixID | Counts | Sigma | Mean | Median | Sigma |
| A | 8 | 6 | 115125 | 583.24 | 791 | 770 | 196.1 |
| A | 7 | 206 | 63195 | 318.38 | 791 | 770 | 196.1 |
| A | 7 | 221 | 26991 | 133.73 | 791 | 770 | 196.1 |
| B | 10 | 14 | 910301 | 5542.66 | 766 | 738 | 164.1 |
| B | 7 | 0 | 241493 | 1467.1 | 766 | 738 | 164.1 |
| B | 0 | 213 | 121056 | 733.19 | 766 | 738 | 164.1 |
| C | 10 | 22 | 194491 | 941.27 | 758 | 752 | 205.8 |
| C | 9 | 38 | 193917 | 938.48 | 758 | 752 | 205.8 |
| C | 14 | 254 | 159534 | 771.44 | 758 | 752 | 205.8 |
| D | 8 | 176 | 7770746 | 40766.65 | 662 | 632 | 190.6 |
| D | 2 | 62 | 560423 | 2937.0 | 662 | 632 | 190.6 |
| D | 15 | 108 | 161212 | 842.5 | 662 | 632 | 190.6 |
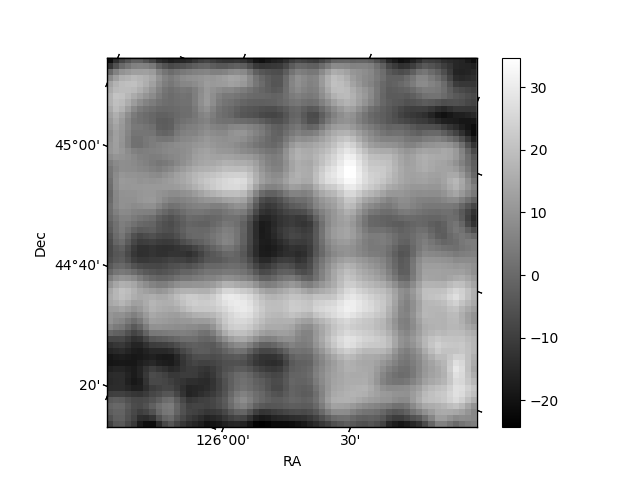
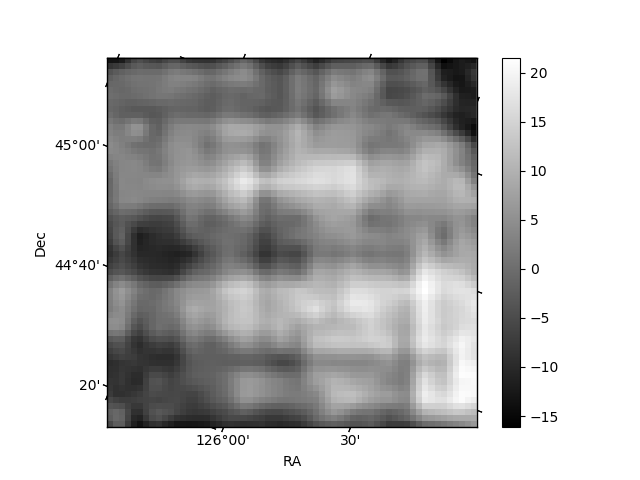
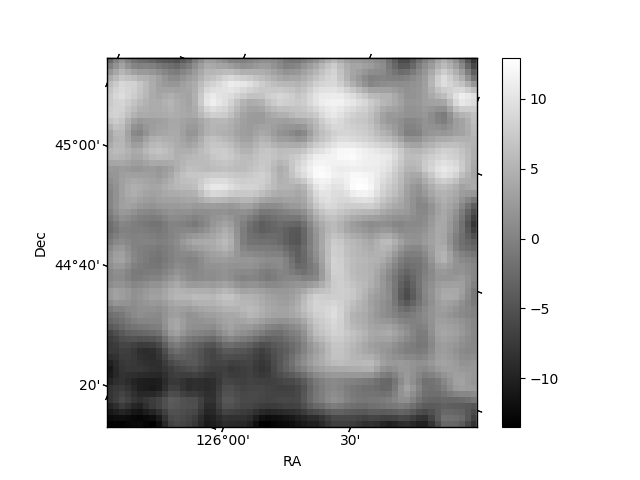
Histogram calculated using DETX and DETY for each event in the final _common_clean file
| Quadrant A | 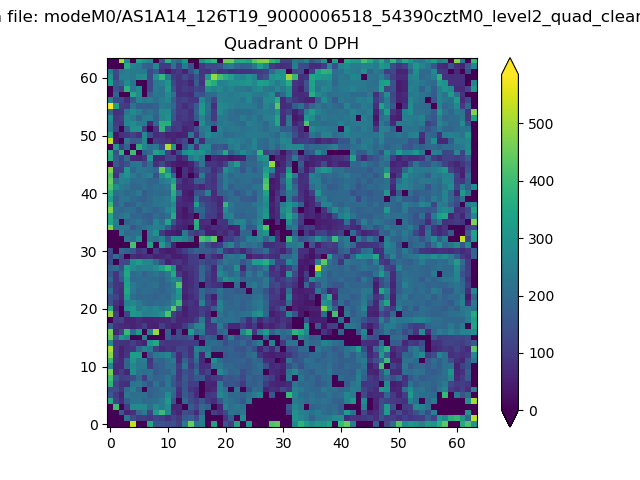 |
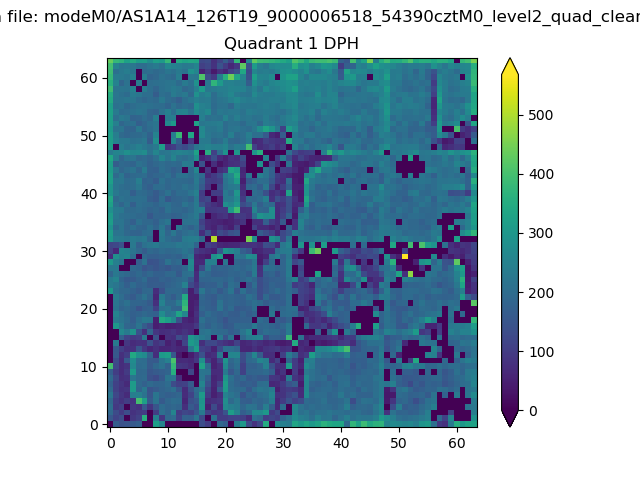 |
Quadrant B |
|---|---|---|---|
| Quadrant D | 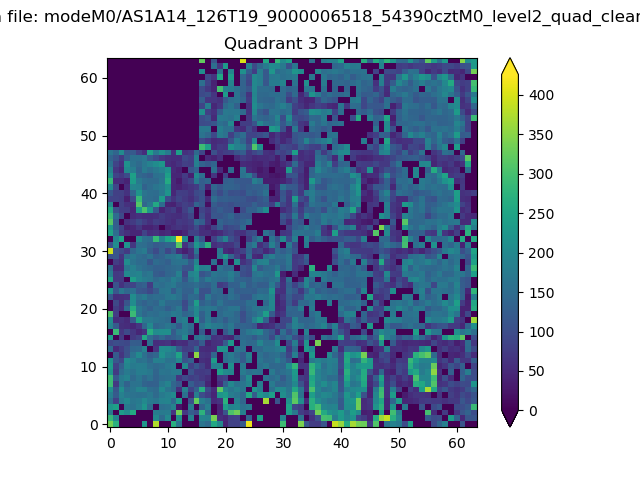 |
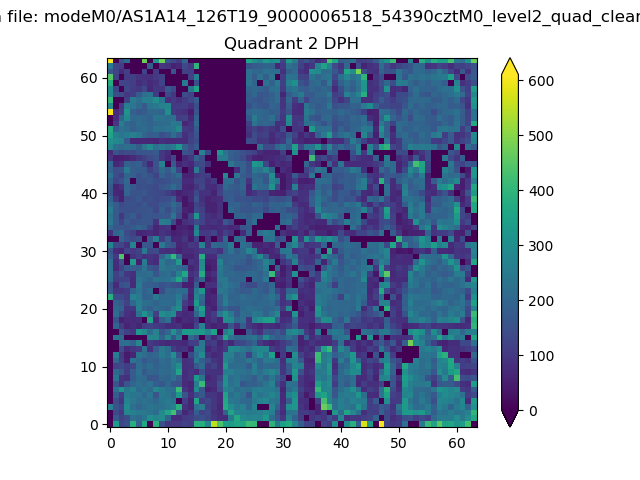 |
Quadrant C |
| Plot type | Count rate plots | Images |
|---|---|---|
| Comparison with Poisson distribution Blue bars denote a histogram of data divided into 1 sec bins. Red curve is a Poisson curve with rate = median count rate of data. |
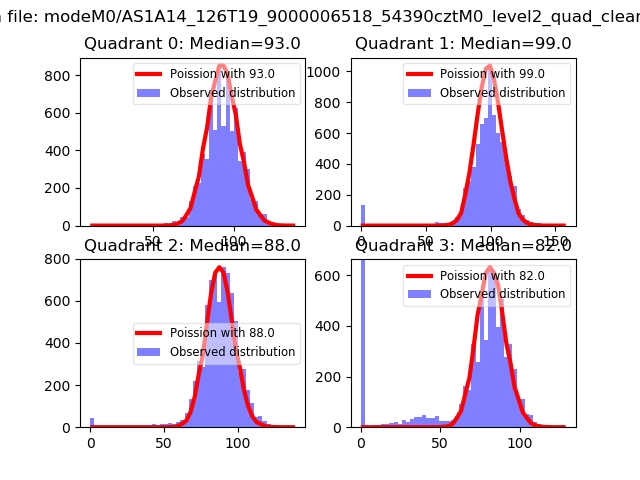 |
 |
| Quadrant-wise count rates Data is divided into 100 sec bins |
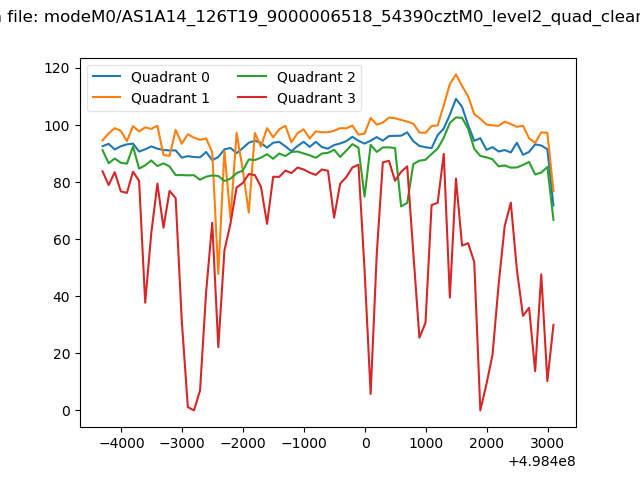 |
|
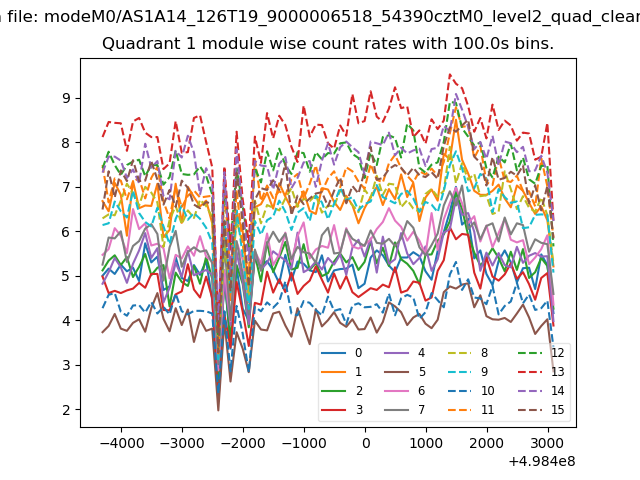
| Module-wise count rates for Quadrant A Data is divided into 100 sec bins |
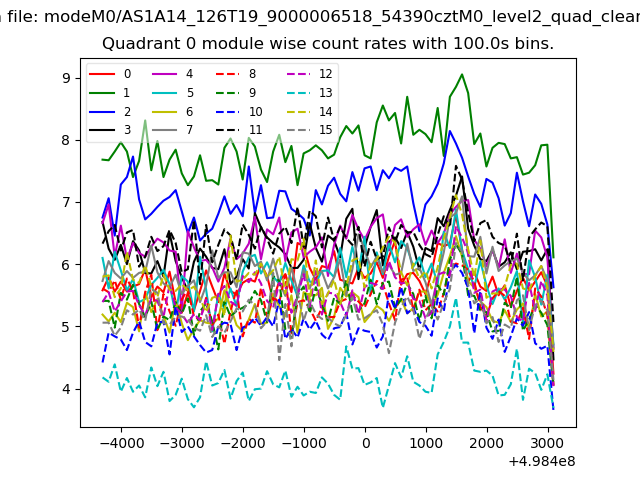 |
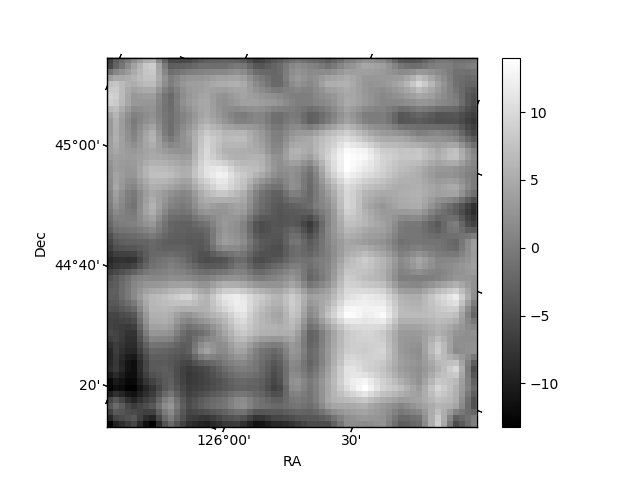 |
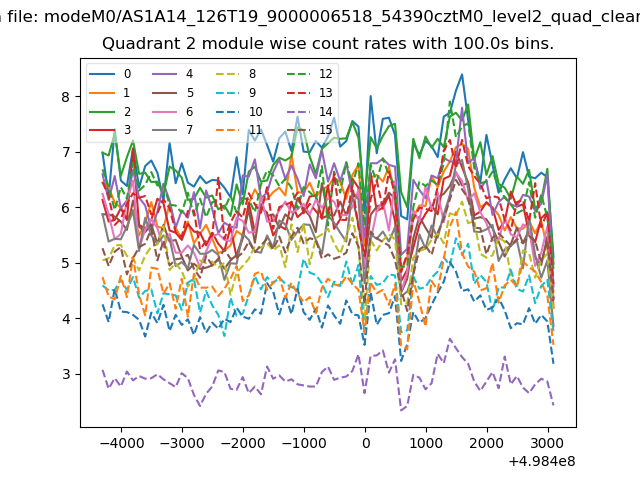
| Module-wise count rates for Quadrant B Data is divided into 100 sec bins |
 |
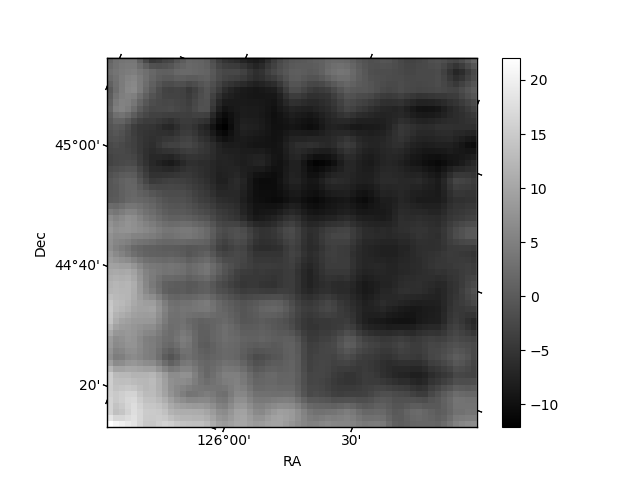 |
| Module-wise count rates for Quadrant C Data is divided into 100 sec bins |
 |
 |
| Module-wise count rates for Quadrant D Data is divided into 100 sec bins |
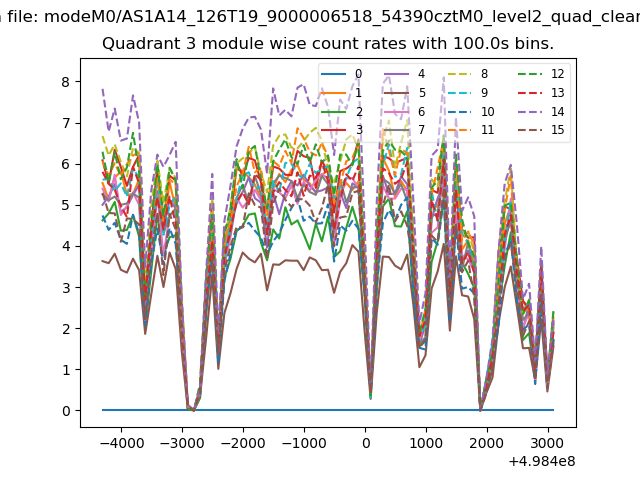 |
 |
| Parameter | Plot |
|---|---|
| CZT HV Monitor |  |
| D_VDD | 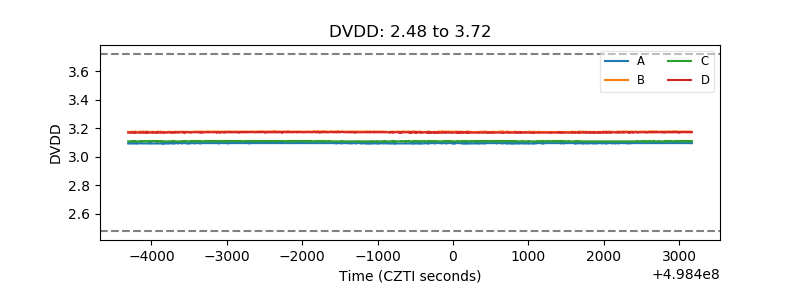 |
| Temperature 1 | 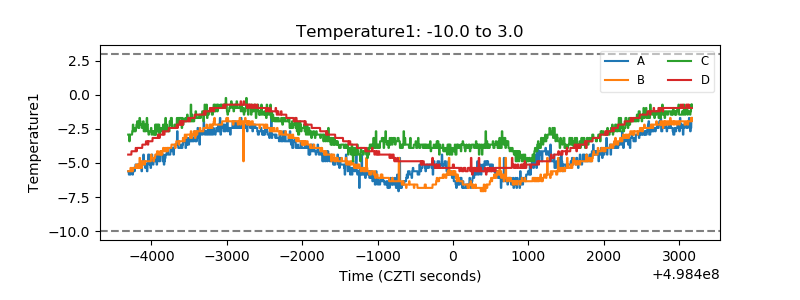 |
| Veto HV Monitor | 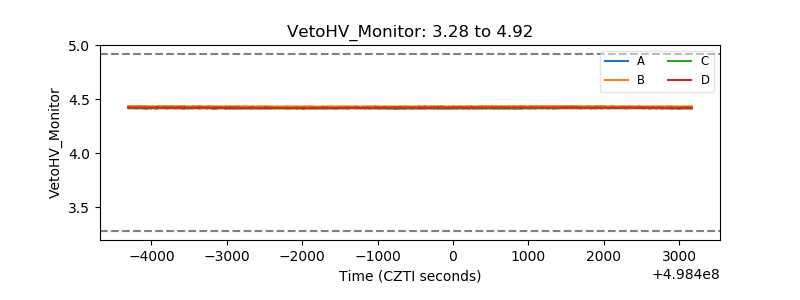 |
| Veto LLD | 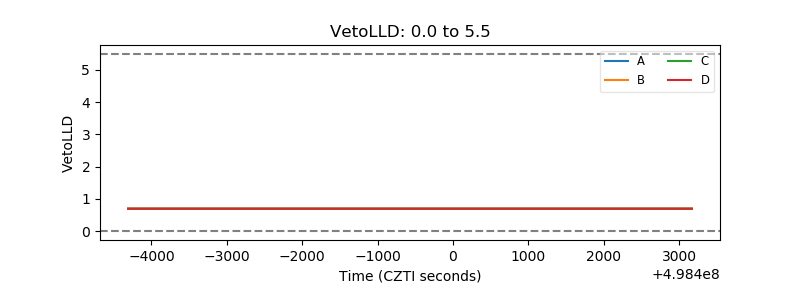 |
| Alpha Counter | 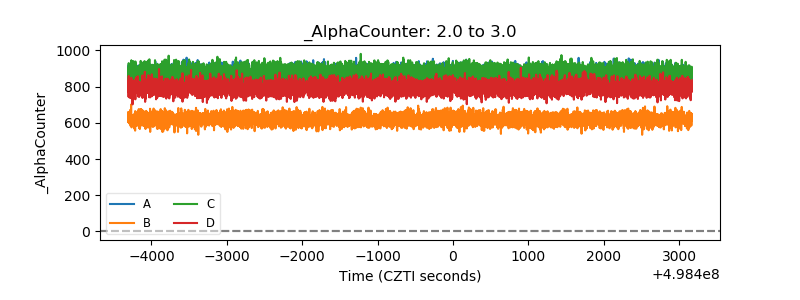 |
| _CPM_Rate | 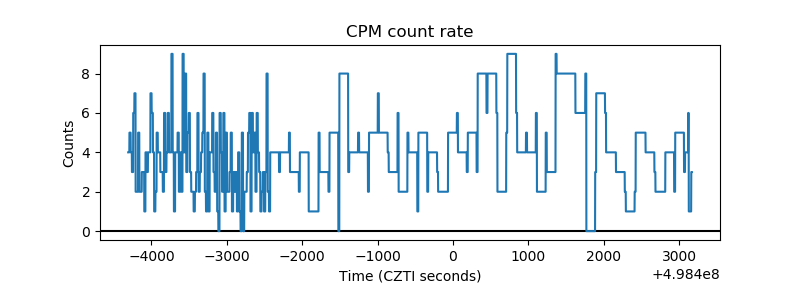 |
| CZT Counter | 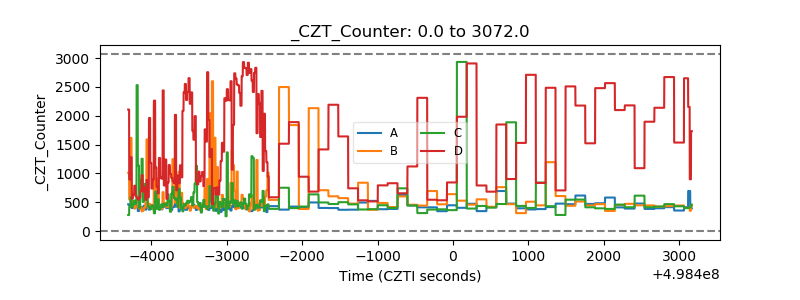 |
| +2.5 Volts monitor | 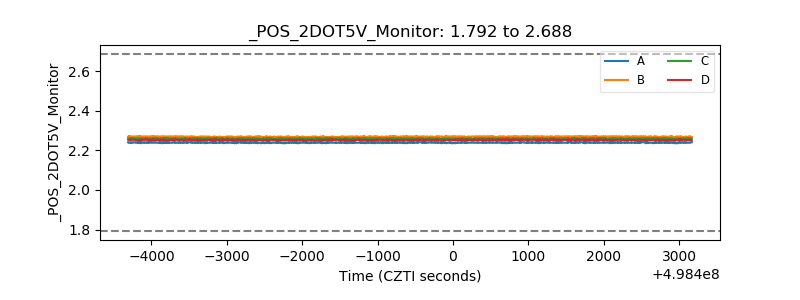 |
| +5 Volts monitor | 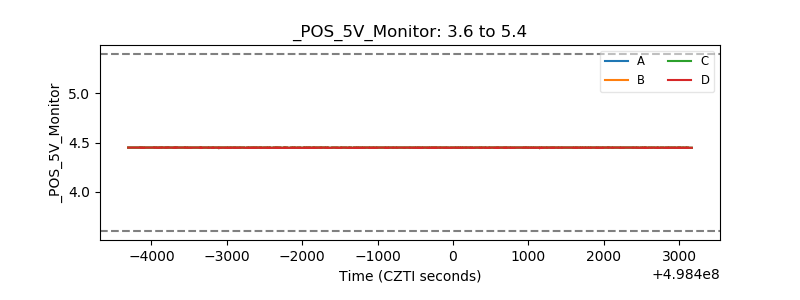 |
| _ROLL_ROT | 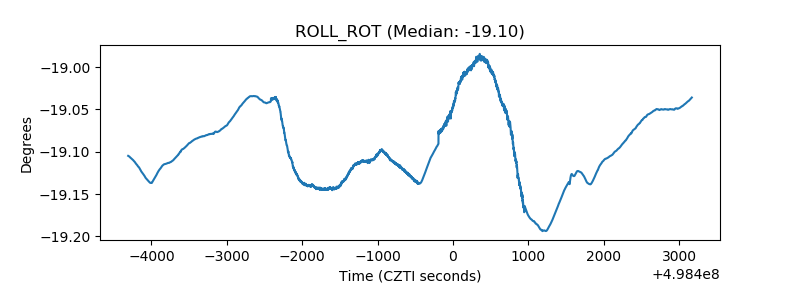 |
| _Roll_DEC | 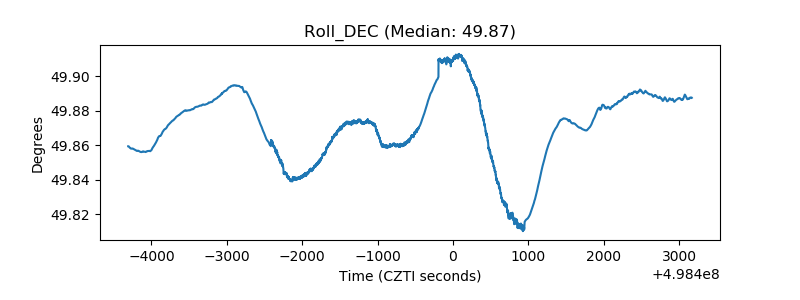 |
| _Roll_RA | 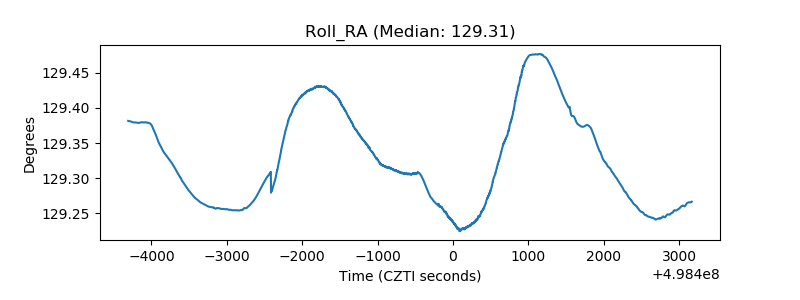 |
| Veto Counter | 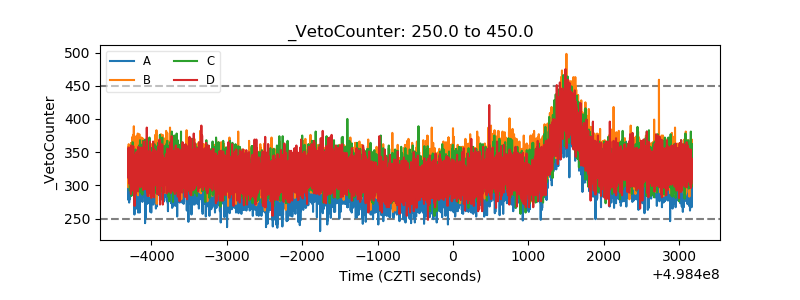 |