| Param | Original file | Final file |
|---|---|---|
| Filename | modeM0/AS1A14_126T19_9000006518_54391cztM0_level2.fits | modeM0/AS1A14_126T19_9000006518_54391cztM0_level2_quad_clean.evt |
| Size (bytes) | 872,945,280 | 97,551,360 |
| Size | 832.5 MB | 93.0 MB |
| Events in quadrant A | 3,493,598 | 743,978 |
| Events in quadrant B | 4,253,564 | 781,139 |
| Events in quadrant C | 7,199,094 | 595,371 |
| Events in quadrant D | 16,748,586 | 278,110 |
| Mode SS | |||
|---|---|---|---|
| Quadrant | BADHDUFLAG | Total packets | Discarded packets |
| A | 0 | 160 | 0 |
| B | 0 | 160 | 0 |
| C | 0 | 160 | 0 |
| D | 0 | 160 | 0 |
| Mode M0 | |||
|---|---|---|---|
| Quadrant | BADHDUFLAG | Total packets | Discarded packets |
| A | 0 | 16342 | 0 |
| B | 0 | 18380 | 0 |
| C | 0 | 27110 | 0 |
| D | 0 | 55212 | 0 |
| Quadrant | Total seconds | Saturated seconds | Saturation percentage |
|---|---|---|---|
| A | 7980 | 19 | 0.238095% |
| B | 7981 | 195 | 2.443303% |
| C | 7981 | 1294 | 16.213507% |
| D | 7981 | 4899 | 61.383285% |
Noise dominated data is calculated using 1-second bins in cleaned event files. If a bin has >2000 counts, and if more than 50% of those come from <1% of pixels, then it is considered to be noise-dominated and hence unusable.
| Quadrant | # 1 sec bins | Bins with >0 counts | Bins with >2000 counts | High rate bins dominated by noise | Noise dominated (total time) | Noise dominated (detector-on time) | Marked lightcurve |
|---|---|---|---|---|---|---|---|
| A | 7980 | 7980 | 6 | 6 | 0.08% | 0.08% | 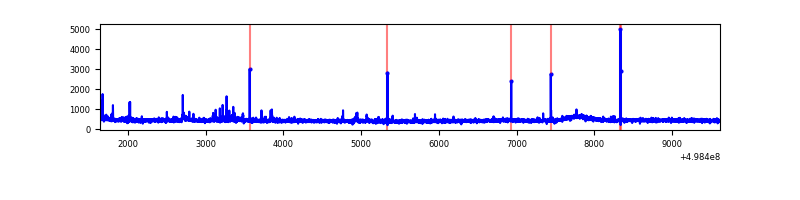 |
| B | 7981 | 7981 | 156 | 156 | 1.95% | 1.95% | 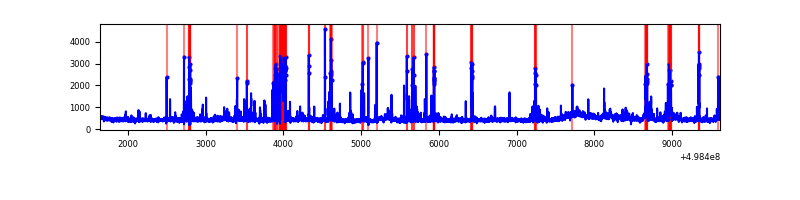 |
| C | 7981 | 7981 | 1187 | 1187 | 14.87% | 14.87% | 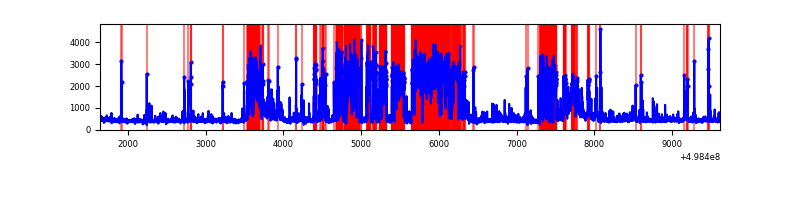 |
| D | 7980 | 7980 | 4740 | 4740 | 59.40% | 59.40% | 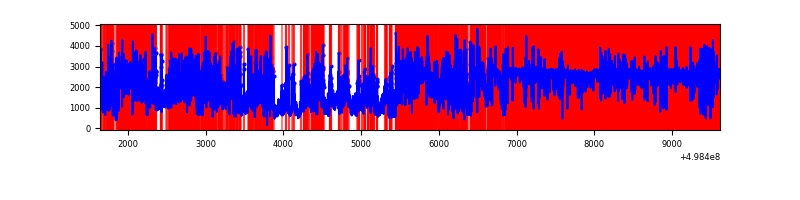 |
Top three noisy pixels from each quadrant. If the there are fewer than three noisy pixels in the level2.evt file, extra rows are filled as -1
| Pixel properties | Quadrant properties | ||||||
|---|---|---|---|---|---|---|---|
| Quadrant | DetID | PixID | Counts | Sigma | Mean | Median | Sigma |
| A | 7 | 206 | 52455 | 243.91 | 857 | 833 | 211.6 |
| A | 8 | 6 | 37099 | 171.35 | 857 | 833 | 211.6 |
| A | 4 | 3 | 28698 | 131.66 | 857 | 833 | 211.6 |
| B | 10 | 14 | 314872 | 1745.88 | 834 | 803 | 179.9 |
| B | 5 | 185 | 169594 | 938.29 | 834 | 803 | 179.9 |
| B | 9 | 251 | 117228 | 647.19 | 834 | 803 | 179.9 |
| C | 1 | 241 | 3495993 | 16296.64 | 779 | 770 | 214.5 |
| C | 15 | 147 | 191641 | 889.94 | 779 | 770 | 214.5 |
| C | 14 | 254 | 166844 | 774.33 | 779 | 770 | 214.5 |
| D | 8 | 176 | 13195548 | 86799.26 | 524 | 500 | 152.0 |
| D | 2 | 62 | 492525 | 3236.62 | 524 | 500 | 152.0 |
| D | 3 | 12 | 489081 | 3213.97 | 524 | 500 | 152.0 |
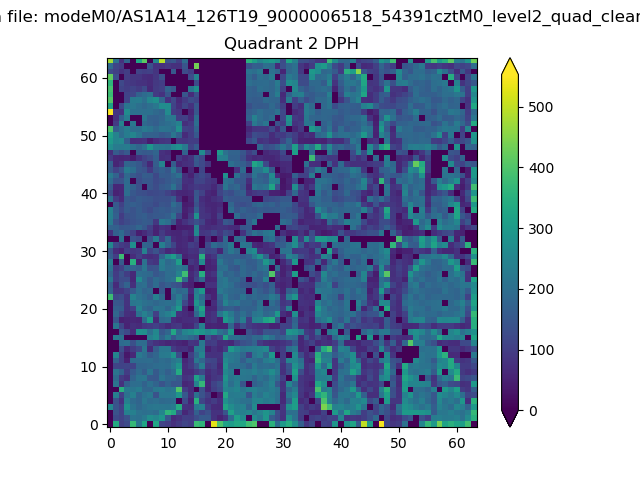
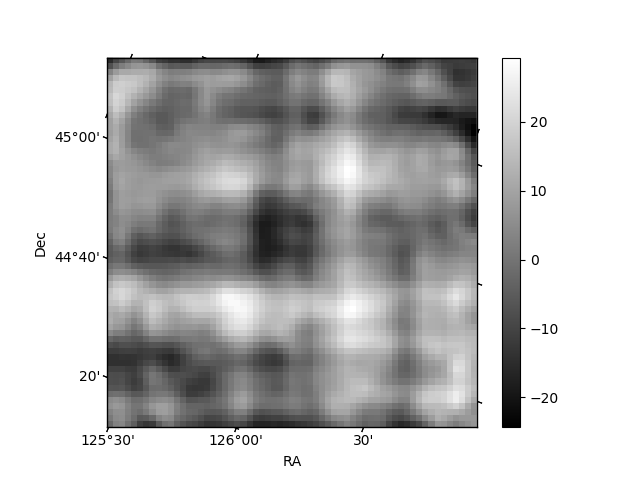
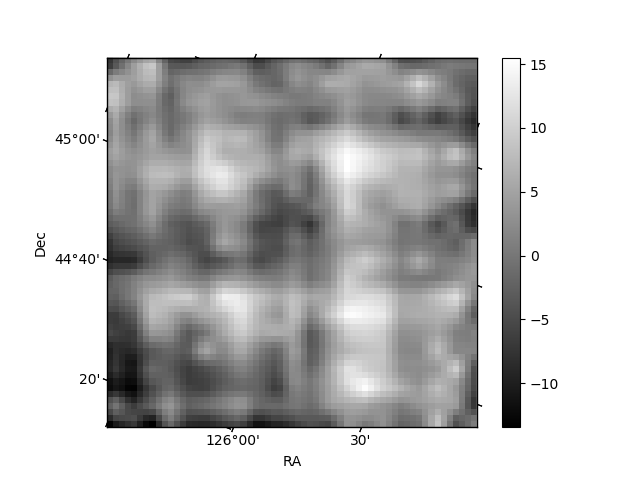
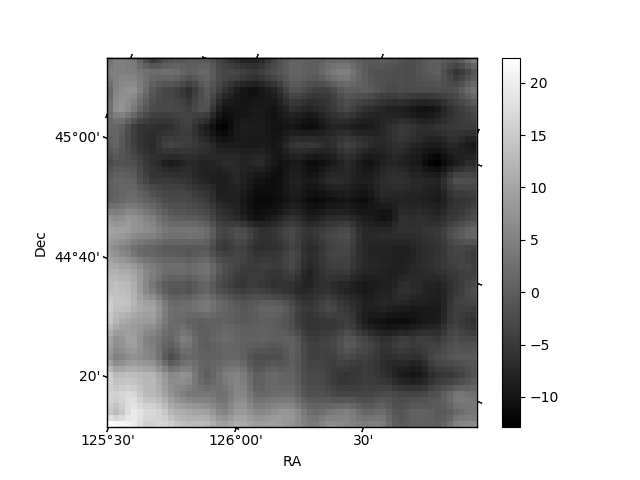
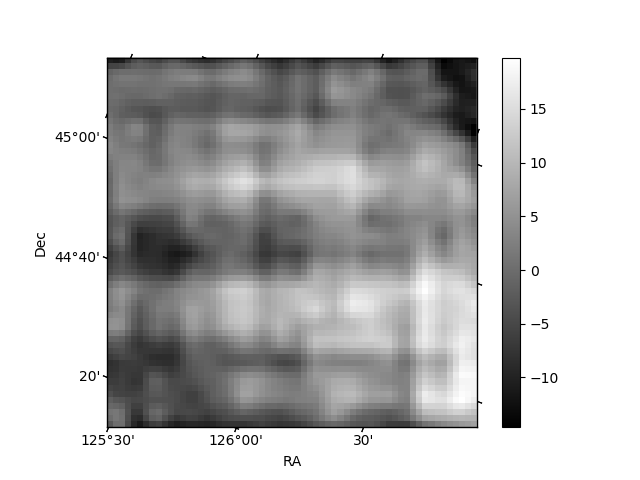
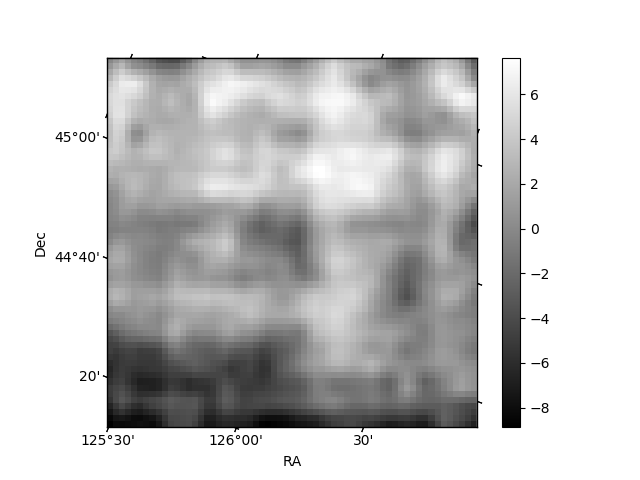
Histogram calculated using DETX and DETY for each event in the final _common_clean file
| Quadrant A | 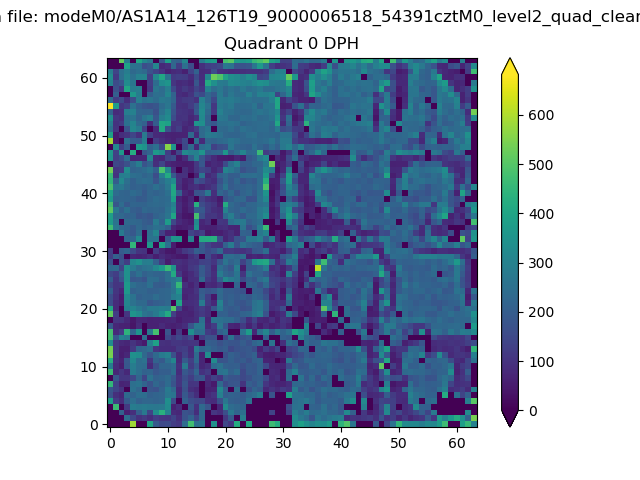 |
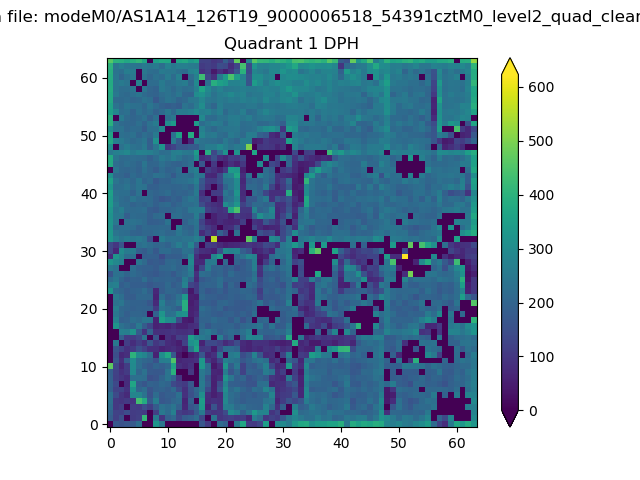 |
Quadrant B |
|---|---|---|---|
| Quadrant D | 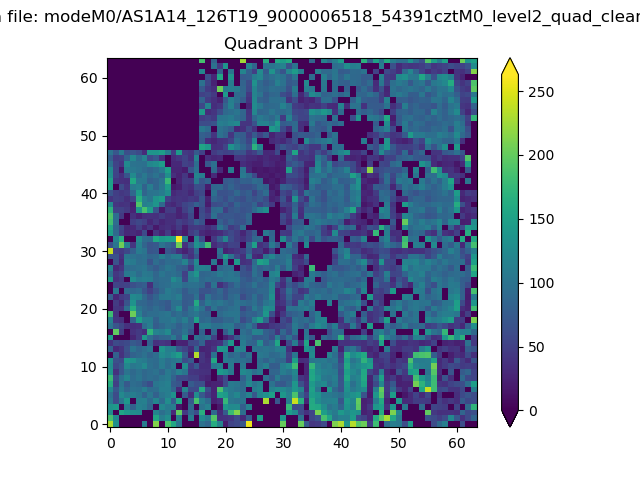 |
 |
Quadrant C |
| Plot type | Count rate plots | Images |
|---|---|---|
| Comparison with Poisson distribution Blue bars denote a histogram of data divided into 1 sec bins. Red curve is a Poisson curve with rate = median count rate of data. |
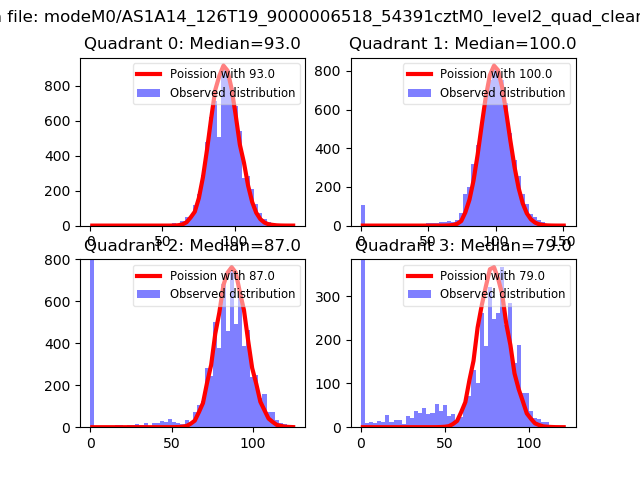 |
 |
| Quadrant-wise count rates Data is divided into 100 sec bins |
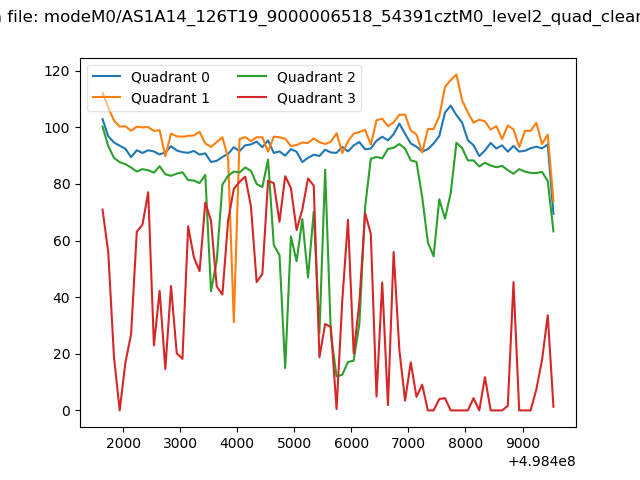 |
|
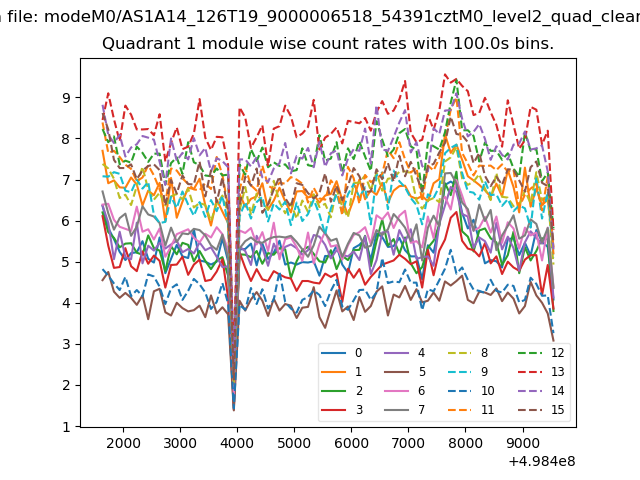
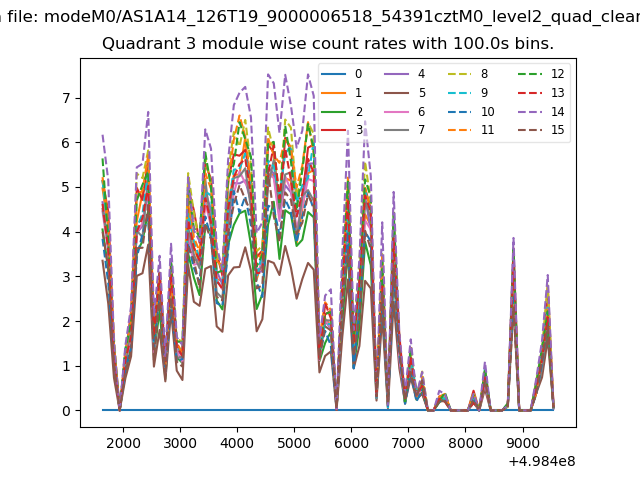
| Module-wise count rates for Quadrant A Data is divided into 100 sec bins |
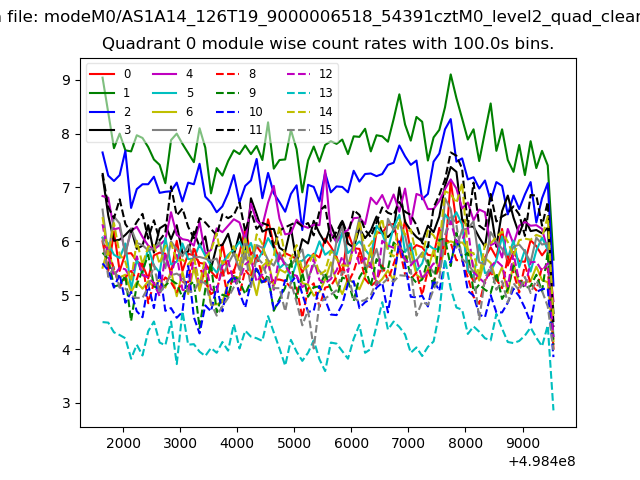 |
 |
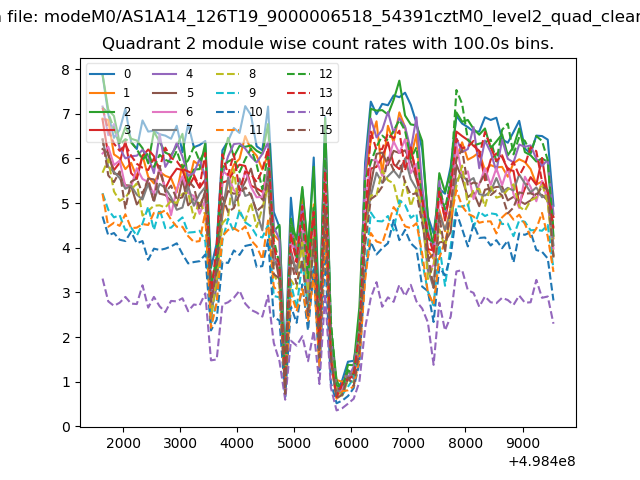
| Module-wise count rates for Quadrant B Data is divided into 100 sec bins |
 |
 |
| Module-wise count rates for Quadrant C Data is divided into 100 sec bins |
 |
 |
| Module-wise count rates for Quadrant D Data is divided into 100 sec bins |
 |
 |
| Parameter | Plot |
|---|---|
| CZT HV Monitor | 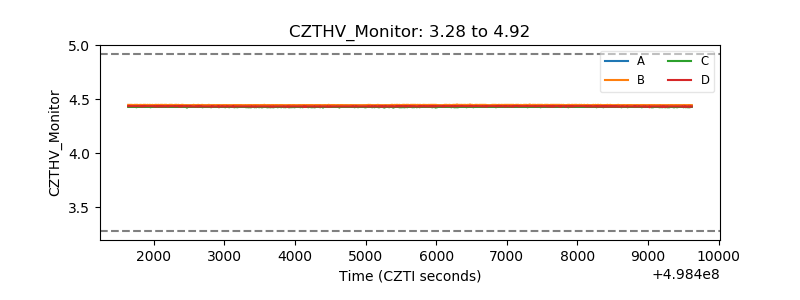 |
| D_VDD | 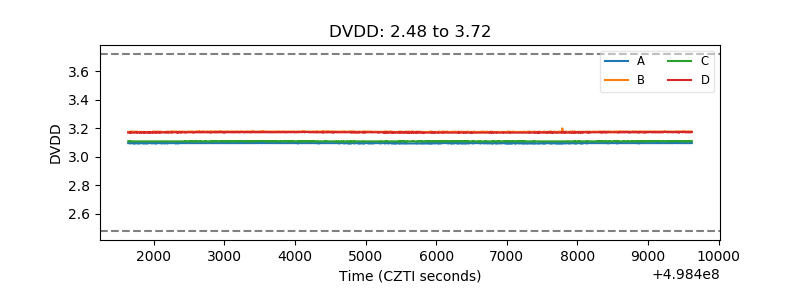 |
| Temperature 1 | 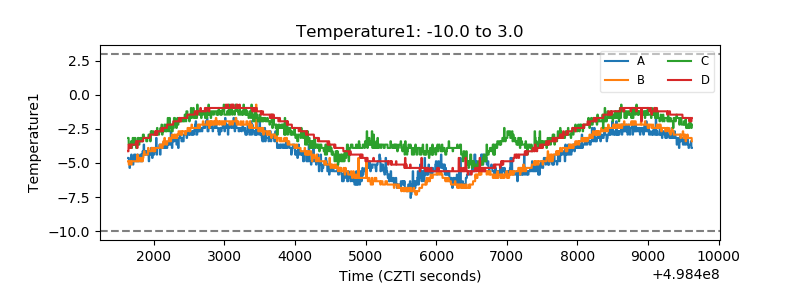 |
| Veto HV Monitor | 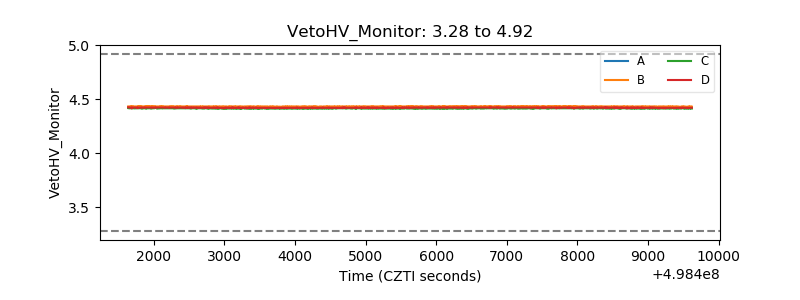 |
| Veto LLD | 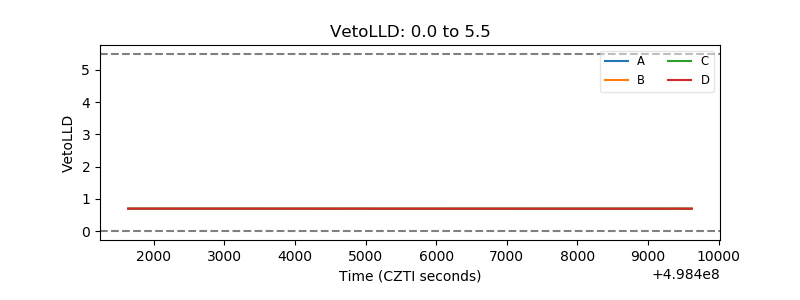 |
| Alpha Counter | 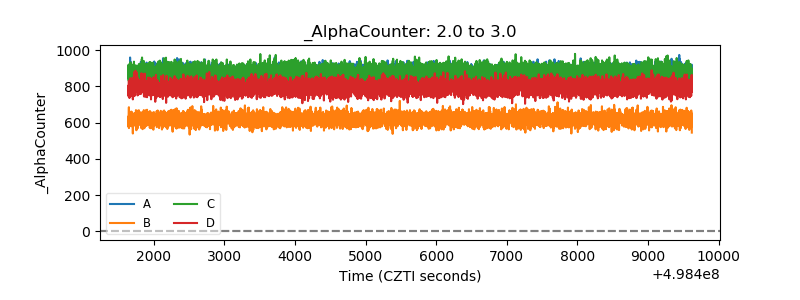 |
| _CPM_Rate | 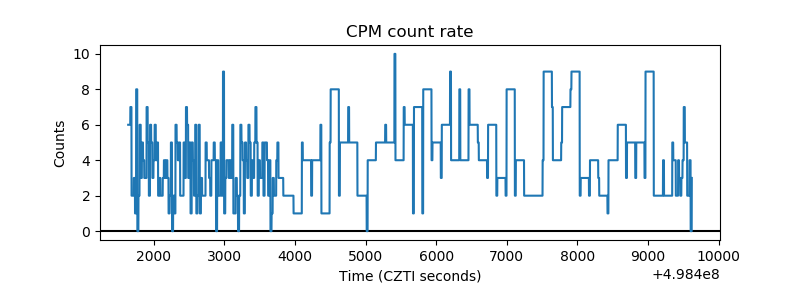 |
| CZT Counter | 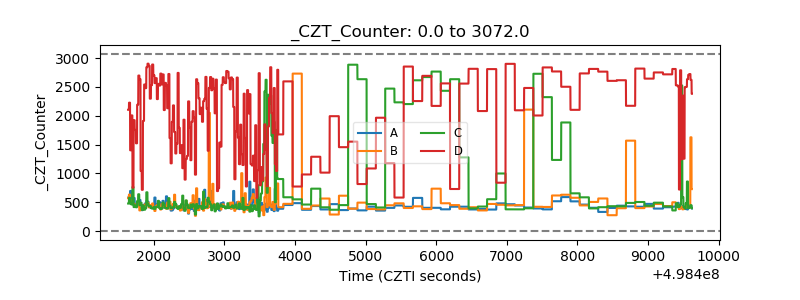 |
| +2.5 Volts monitor |  |
| +5 Volts monitor |  |
| _ROLL_ROT | 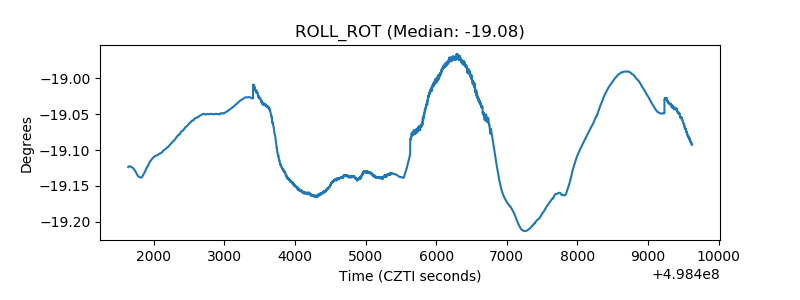 |
| _Roll_DEC | 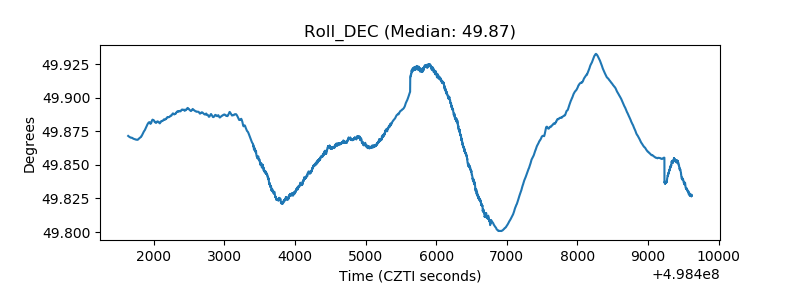 |
| _Roll_RA | 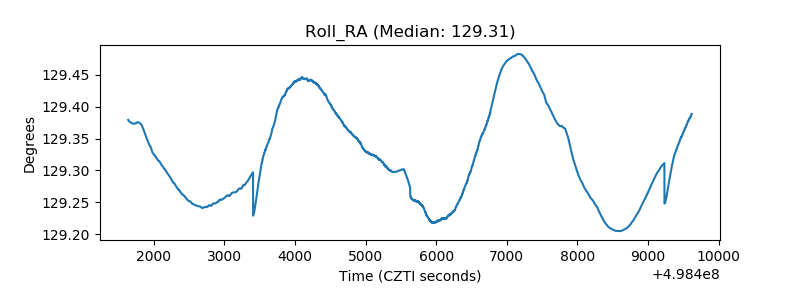 |
| Veto Counter | 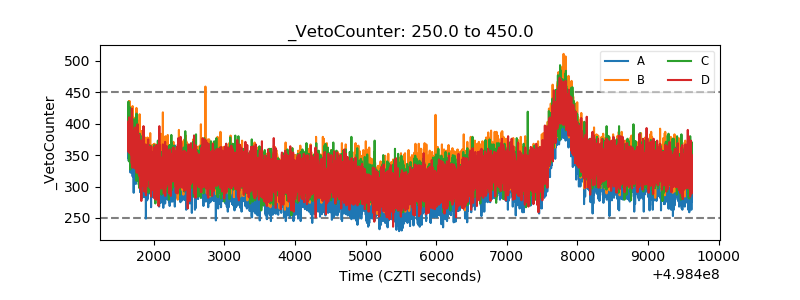 |