| Param | Original file | Final file |
|---|---|---|
| Filename | modeM0/AS1A14_126T19_9000006518_54394cztM0_level2.fits | modeM0/AS1A14_126T19_9000006518_54394cztM0_level2_quad_clean.evt |
| Size (bytes) | 2,062,100,160 | 231,822,720 |
| Size | 1.9 GB | 221.1 MB |
| Events in quadrant A | 9,323,677 | 1,770,608 |
| Events in quadrant B | 11,097,524 | 1,767,504 |
| Events in quadrant C | 12,905,089 | 1,625,238 |
| Events in quadrant D | 41,513,525 | 525,895 |
| Mode SS | |||
|---|---|---|---|
| Quadrant | BADHDUFLAG | Total packets | Discarded packets |
| A | 0 | 390 | 0 |
| B | 0 | 390 | 0 |
| C | 0 | 390 | 0 |
| D | 0 | 390 | 0 |
| Mode M0 | |||
|---|---|---|---|
| Quadrant | BADHDUFLAG | Total packets | Discarded packets |
| A | 0 | 42142 | 3 |
| B | 0 | 47142 | 3 |
| C | 0 | 52443 | 3 |
| D | 0 | 136655 | 10 |
| Mode M9 | |||
|---|---|---|---|
| Quadrant | BADHDUFLAG | Total packets | Discarded packets |
| A | 0 | 12 | 0 |
| B | 0 | 12 | 0 |
| C | 0 | 12 | 0 |
| D | 0 | 12 | 0 |
| Quadrant | Total seconds | Saturated seconds | Saturation percentage |
|---|---|---|---|
| A | 19295 | 389 | 2.016066% |
| B | 19295 | 1207 | 6.255507% |
| C | 19295 | 898 | 4.654055% |
| D | 19294 | 13516 | 70.052866% |
Noise dominated data is calculated using 1-second bins in cleaned event files. If a bin has >2000 counts, and if more than 50% of those come from <1% of pixels, then it is considered to be noise-dominated and hence unusable.
| Quadrant | # 1 sec bins | Bins with >0 counts | Bins with >2000 counts | High rate bins dominated by noise | Noise dominated (total time) | Noise dominated (detector-on time) | Marked lightcurve |
|---|---|---|---|---|---|---|---|
| A | 20450 | 19297 | 155 | 155 | 0.76% | 0.80% | 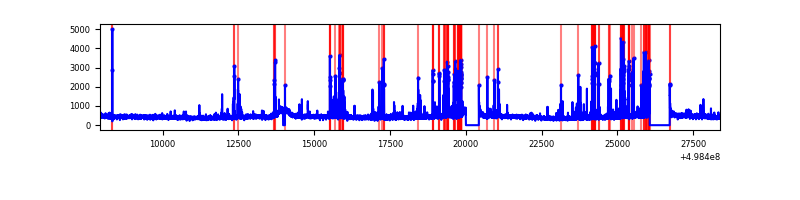 |
| B | 20450 | 19298 | 754 | 754 | 3.69% | 3.91% | 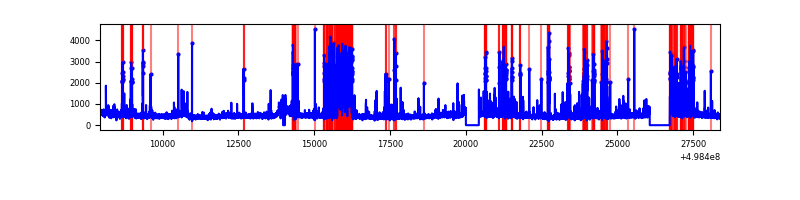 |
| C | 20450 | 19298 | 668 | 668 | 3.27% | 3.46% | 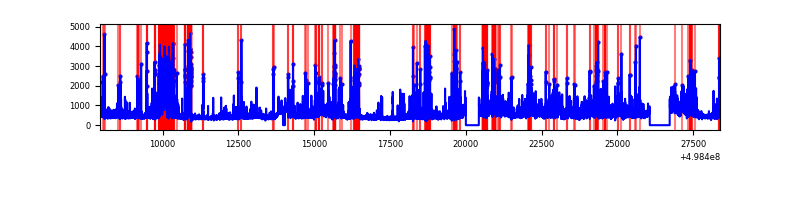 |
| D | 20448 | 19294 | 12608 | 12608 | 61.66% | 65.35% | 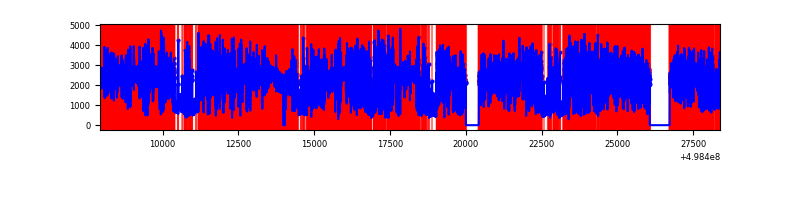 |
Top three noisy pixels from each quadrant. If the there are fewer than three noisy pixels in the level2.evt file, extra rows are filled as -1
| Pixel properties | Quadrant properties | ||||||
|---|---|---|---|---|---|---|---|
| Quadrant | DetID | PixID | Counts | Sigma | Mean | Median | Sigma |
| A | 12 | 15 | 1041652 | 2037.58 | 2067 | 2017 | 510.2 |
| A | 7 | 206 | 67272 | 127.89 | 2067 | 2017 | 510.2 |
| A | 4 | 3 | 58257 | 110.22 | 2067 | 2017 | 510.2 |
| B | 10 | 14 | 2386648 | 5645.54 | 1992 | 1919 | 422.4 |
| B | 5 | 172 | 183924 | 430.87 | 1992 | 1919 | 422.4 |
| B | 0 | 213 | 178556 | 418.16 | 1992 | 1919 | 422.4 |
| C | 9 | 38 | 1461656 | 2720.04 | 1983 | 1965 | 536.6 |
| C | 1 | 241 | 1461295 | 2719.37 | 1983 | 1965 | 536.6 |
| C | 14 | 254 | 447747 | 830.69 | 1983 | 1965 | 536.6 |
| D | 8 | 176 | 33974828 | 106394.44 | 1111 | 1058 | 319.3 |
| D | 2 | 62 | 1218239 | 3811.8 | 1111 | 1058 | 319.3 |
| D | 2 | 172 | 864864 | 2705.15 | 1111 | 1058 | 319.3 |
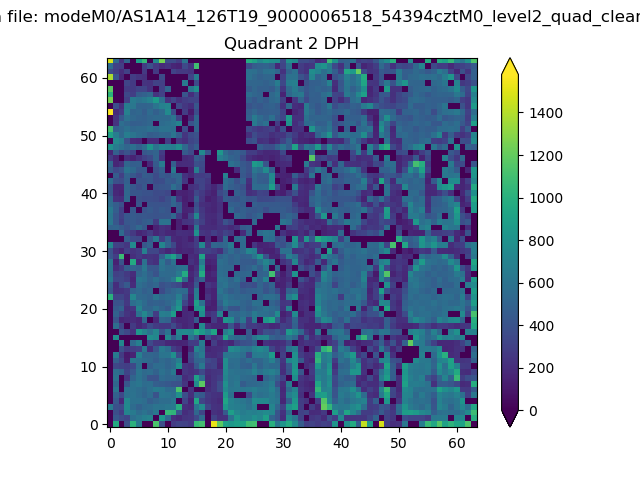
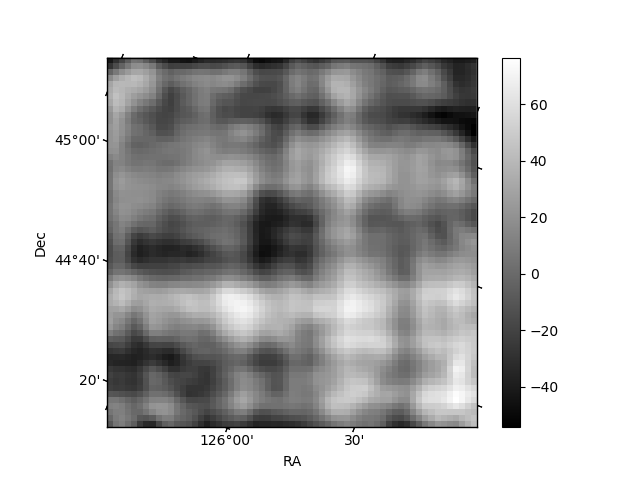
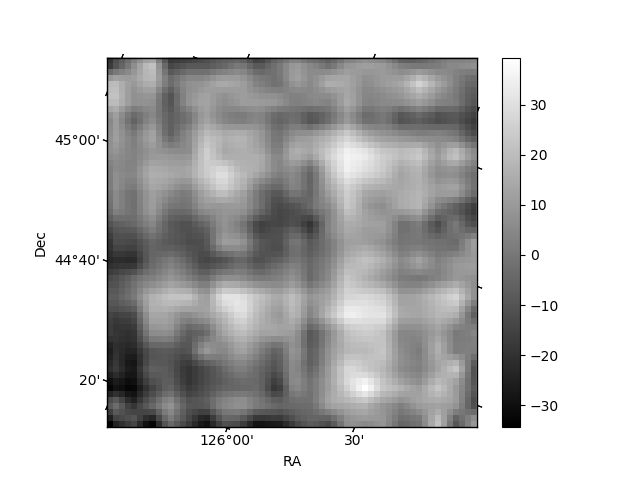
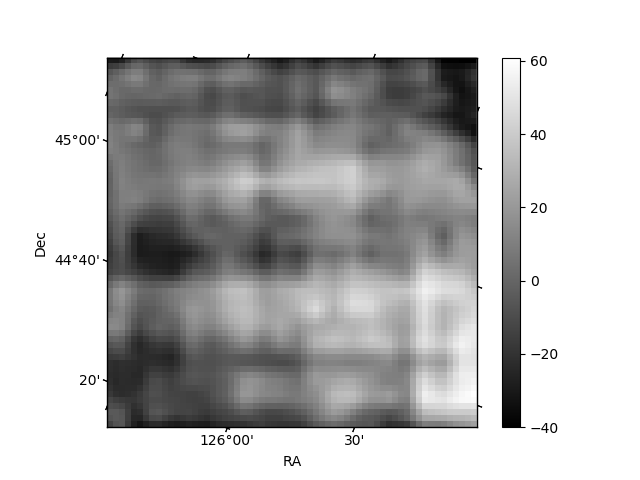
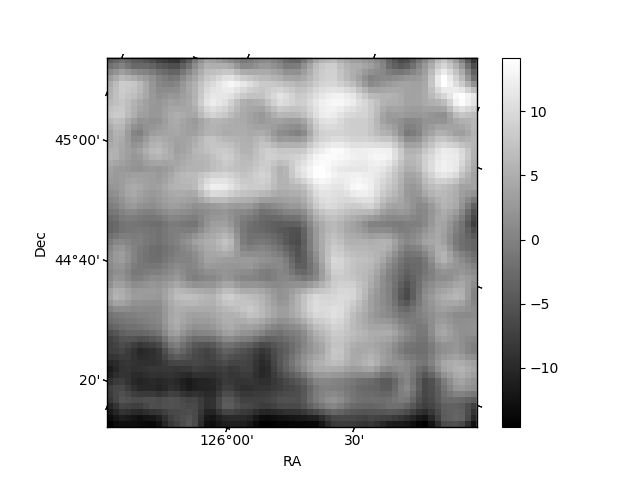
Histogram calculated using DETX and DETY for each event in the final _common_clean file
| Quadrant A | 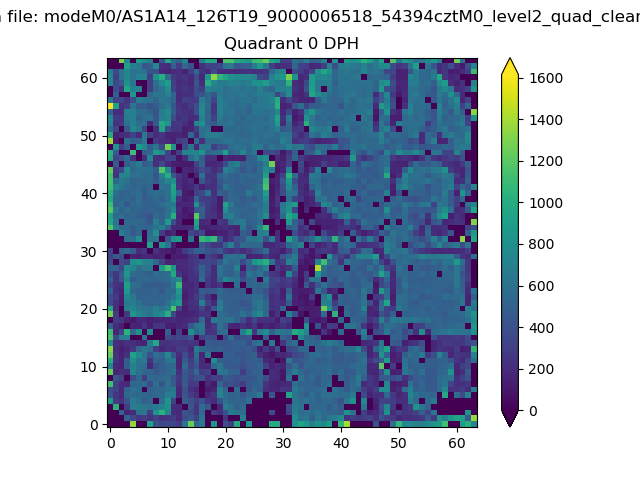 |
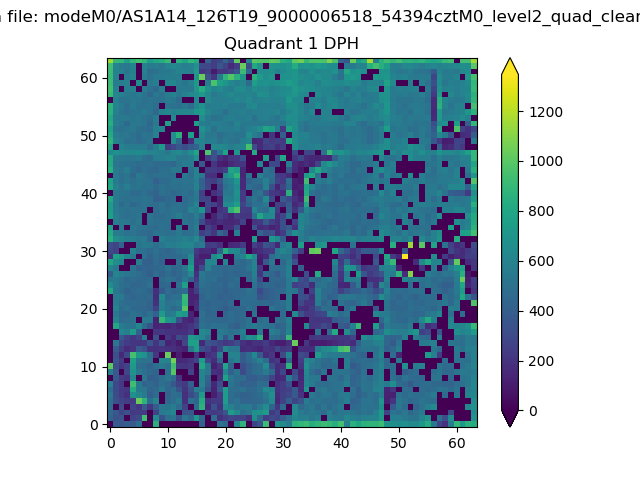 |
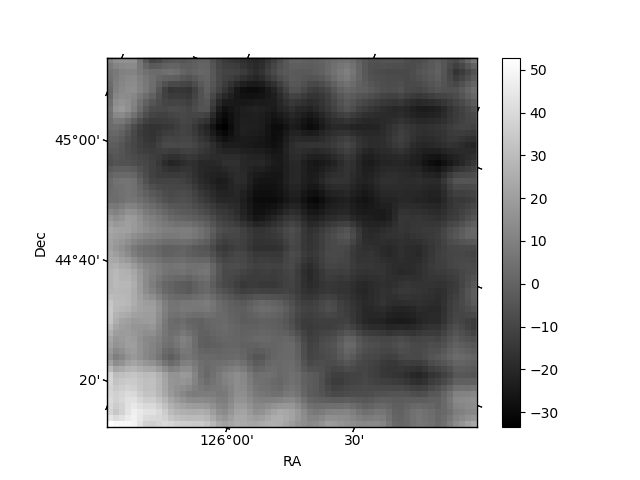
Quadrant B |
|---|---|---|---|
| Quadrant D | 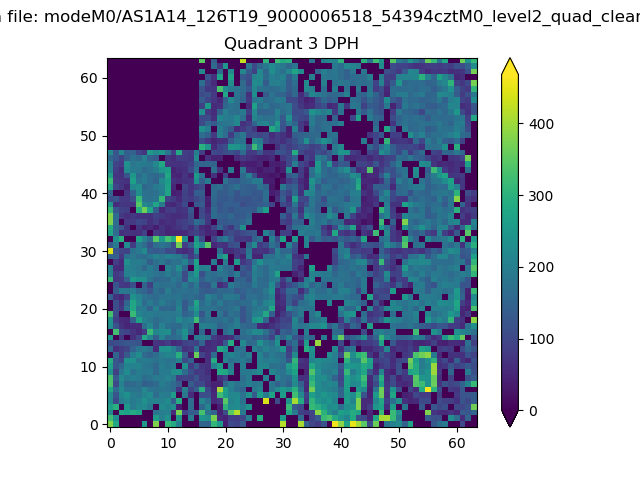 |
 |
Quadrant C |
| Plot type | Count rate plots | Images |
|---|---|---|
| Comparison with Poisson distribution Blue bars denote a histogram of data divided into 1 sec bins. Red curve is a Poisson curve with rate = median count rate of data. |
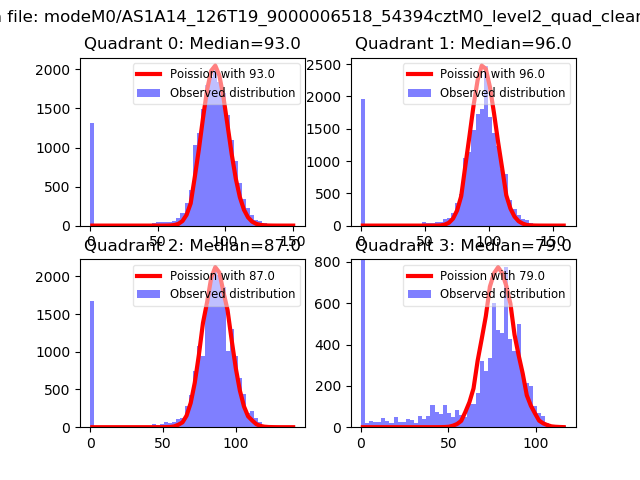 |
 |
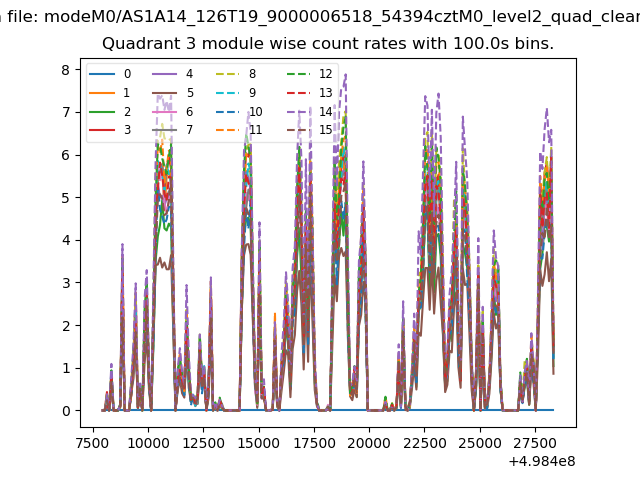
| Quadrant-wise count rates Data is divided into 100 sec bins |
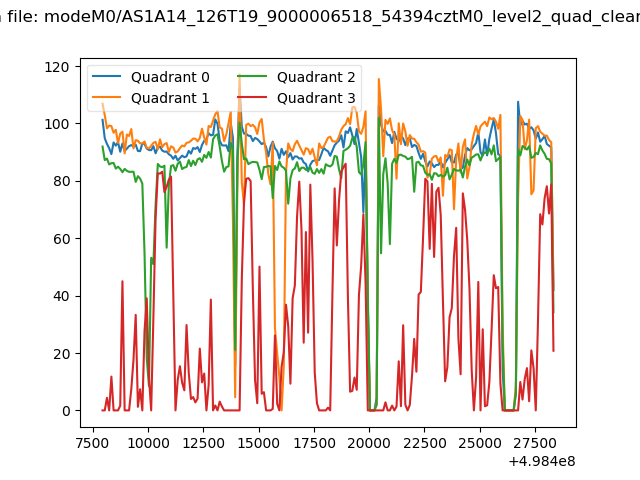 |
|
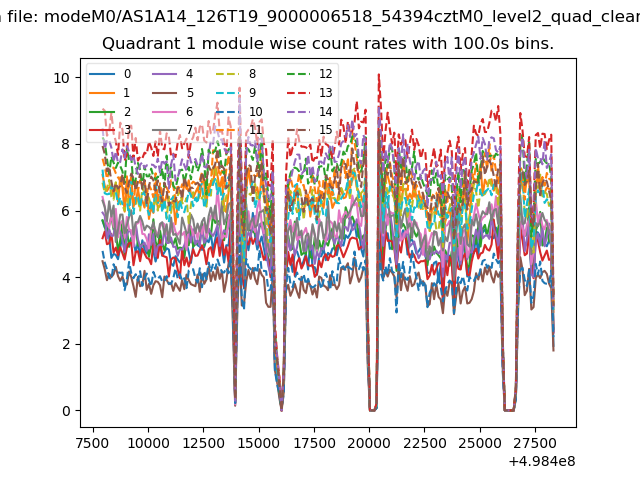
| Module-wise count rates for Quadrant A Data is divided into 100 sec bins |
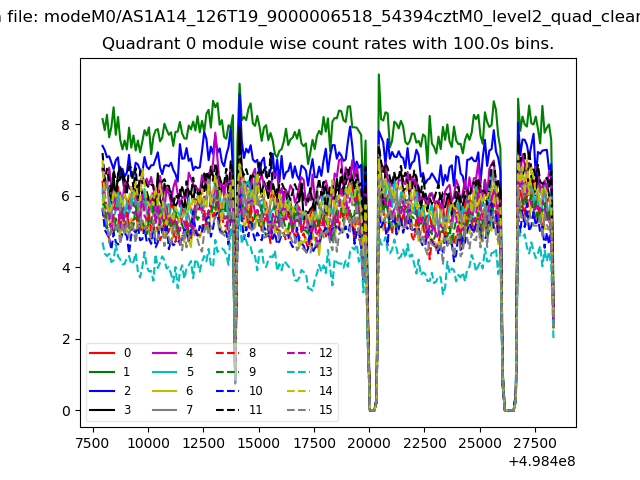 |
 |
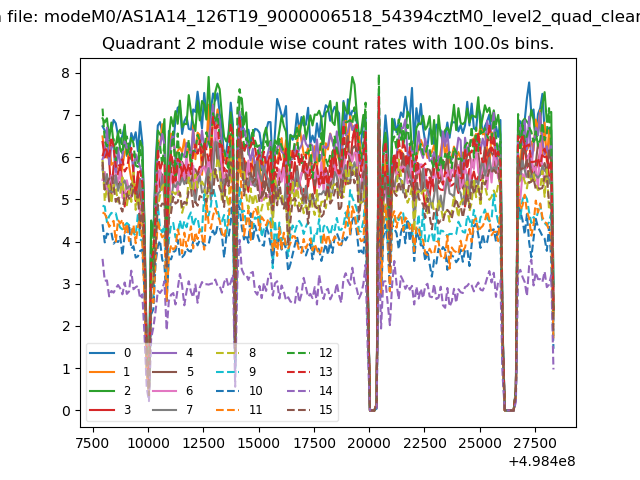
| Module-wise count rates for Quadrant B Data is divided into 100 sec bins |
 |
 |
| Module-wise count rates for Quadrant C Data is divided into 100 sec bins |
 |
 |
| Module-wise count rates for Quadrant D Data is divided into 100 sec bins |
 |
 |
| Parameter | Plot |
|---|---|
| CZT HV Monitor | 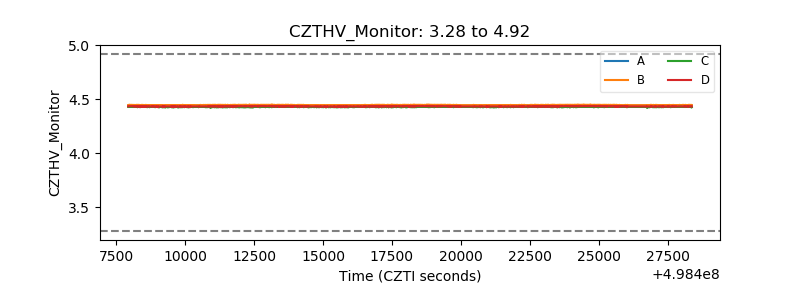 |
| D_VDD | 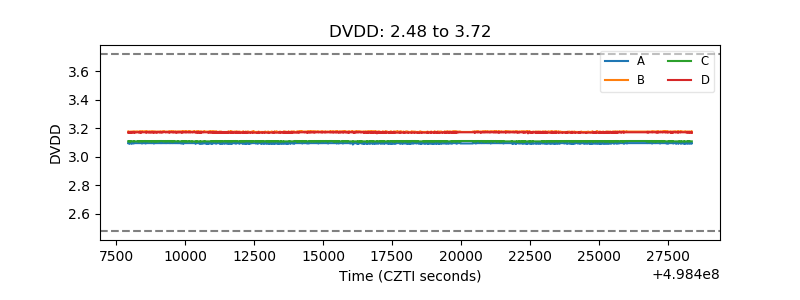 |
| Temperature 1 | 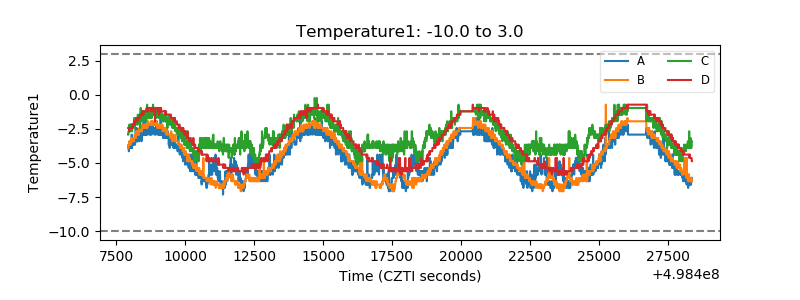 |
| Veto HV Monitor | 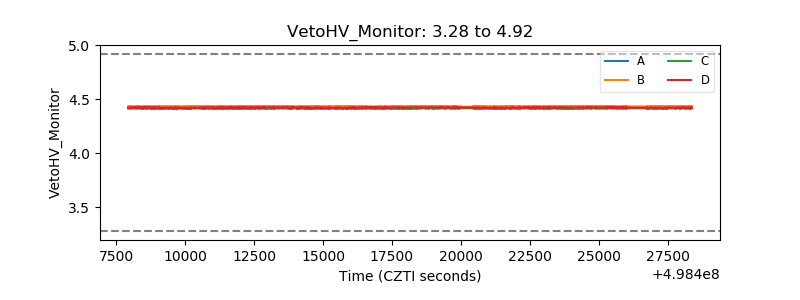 |
| Veto LLD | 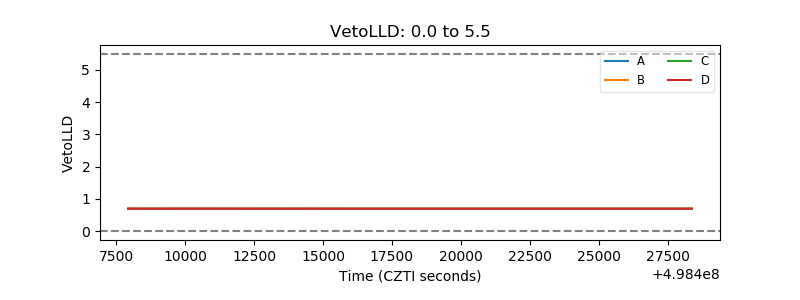 |
| Alpha Counter | 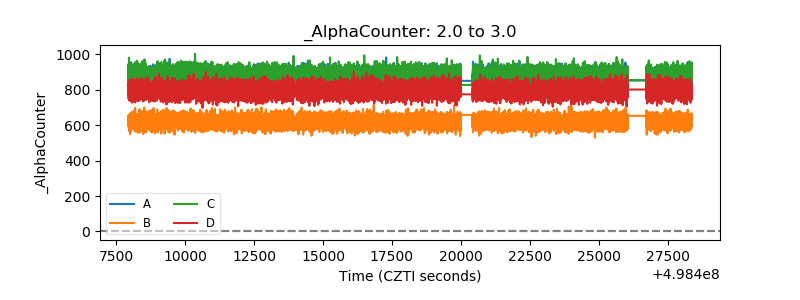 |
| _CPM_Rate | 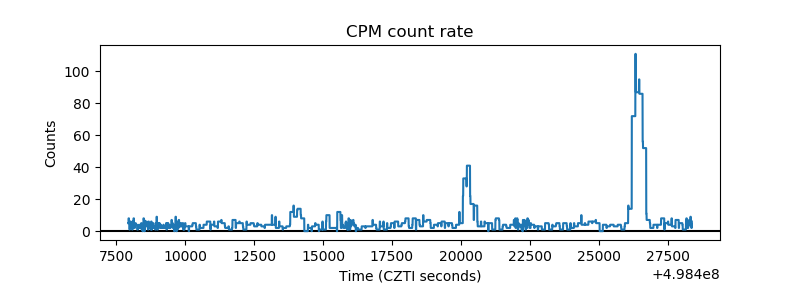 |
| CZT Counter | 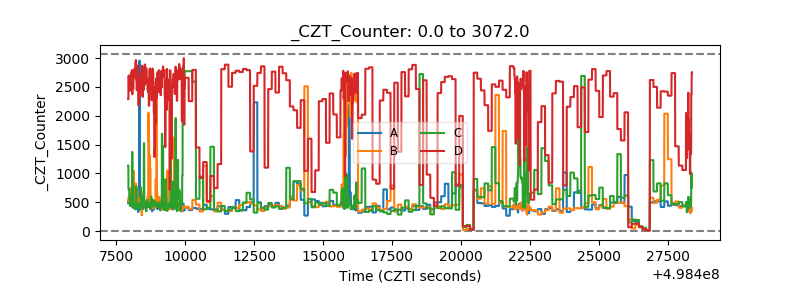 |
| +2.5 Volts monitor | 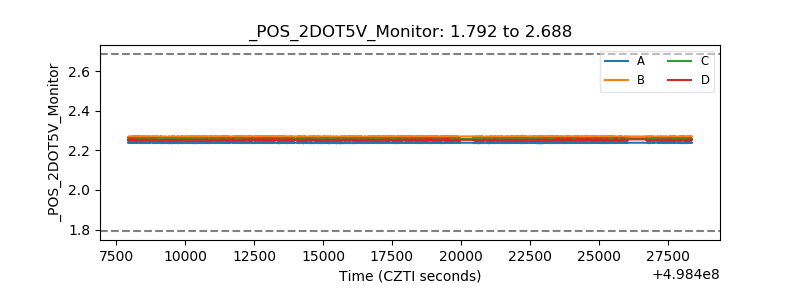 |
| +5 Volts monitor | 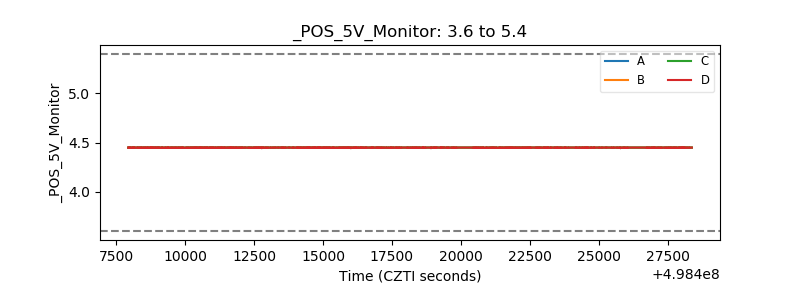 |
| _ROLL_ROT | 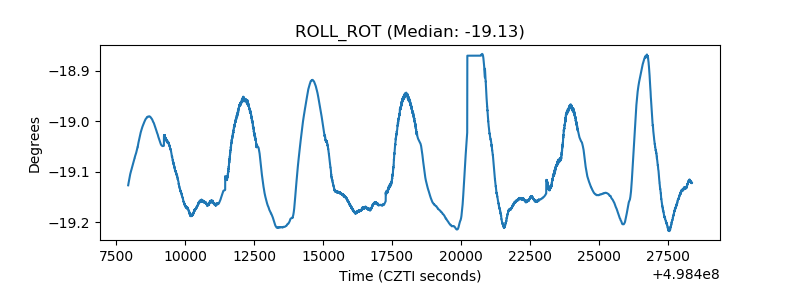 |
| _Roll_DEC | 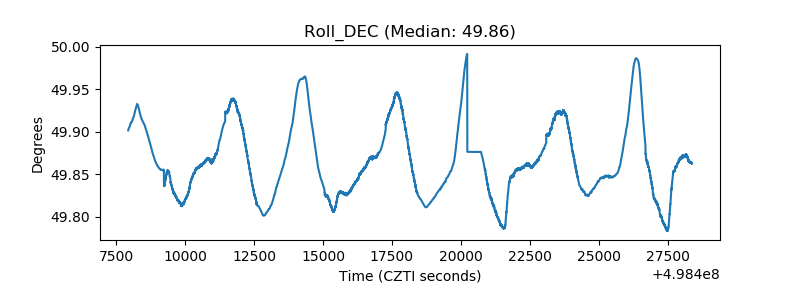 |
| _Roll_RA | 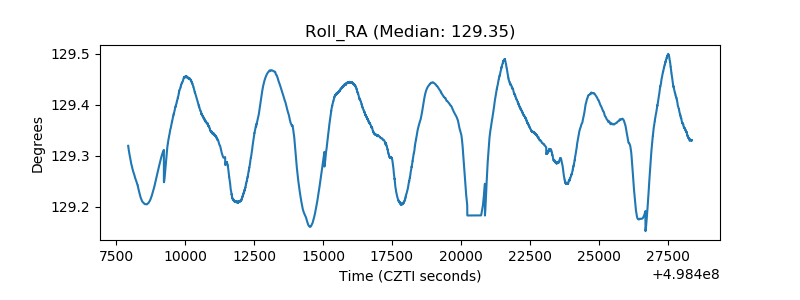 |
| Veto Counter | 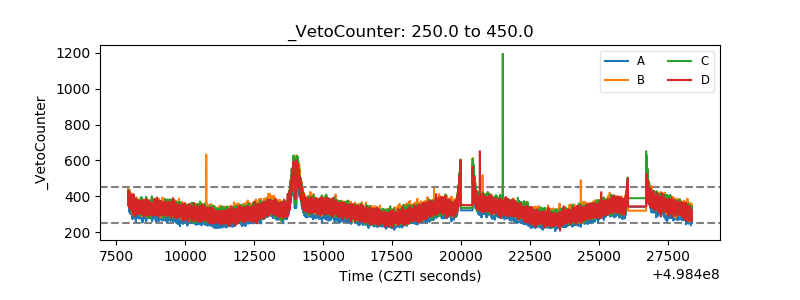 |