| Param | Original file | Final file |
|---|---|---|
| Filename | modeM0/AS1A14_126T19_9000006518_54397cztM0_level2.fits | modeM0/AS1A14_126T19_9000006518_54397cztM0_level2_quad_clean.evt |
| Size (bytes) | 719,352,000 | 80,723,520 |
| Size | 686.0 MB | 77.0 MB |
| Events in quadrant A | 2,854,116 | 603,697 |
| Events in quadrant B | 2,884,206 | 646,642 |
| Events in quadrant C | 7,952,841 | 419,458 |
| Events in quadrant D | 12,441,051 | 327,875 |
| Mode SS | |||
|---|---|---|---|
| Quadrant | BADHDUFLAG | Total packets | Discarded packets |
| A | 0 | 130 | 0 |
| B | 0 | 130 | 0 |
| C | 0 | 130 | 0 |
| D | 0 | 130 | 0 |
| Mode M0 | |||
|---|---|---|---|
| Quadrant | BADHDUFLAG | Total packets | Discarded packets |
| A | 0 | 13409 | 1 |
| B | 0 | 13512 | 1 |
| C | 0 | 28018 | 2 |
| D | 0 | 41401 | 1 |
| Mode M9 | |||
|---|---|---|---|
| Quadrant | BADHDUFLAG | Total packets | Discarded packets |
| A | 0 | 10 | 0 |
| B | 0 | 10 | 0 |
| C | 0 | 10 | 0 |
| D | 0 | 10 | 0 |
| Quadrant | Total seconds | Saturated seconds | Saturation percentage |
|---|---|---|---|
| A | 6396 | 35 | 0.547217% |
| B | 6397 | 43 | 0.672190% |
| C | 6396 | 1941 | 30.347092% |
| D | 6396 | 2888 | 45.153221% |
Noise dominated data is calculated using 1-second bins in cleaned event files. If a bin has >2000 counts, and if more than 50% of those come from <1% of pixels, then it is considered to be noise-dominated and hence unusable.
| Quadrant | # 1 sec bins | Bins with >0 counts | Bins with >2000 counts | High rate bins dominated by noise | Noise dominated (total time) | Noise dominated (detector-on time) | Marked lightcurve |
|---|---|---|---|---|---|---|---|
| A | 7391 | 6397 | 15 | 15 | 0.20% | 0.23% | 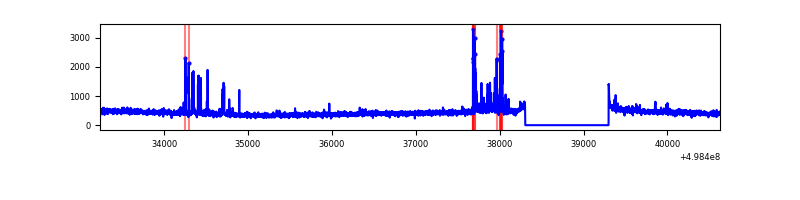 |
| B | 7392 | 6398 | 11 | 11 | 0.15% | 0.17% | 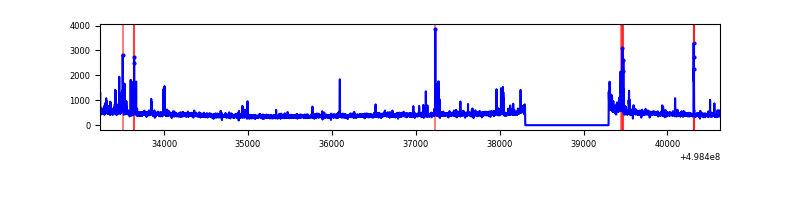 |
| C | 7390 | 6396 | 1841 | 1841 | 24.91% | 28.78% | 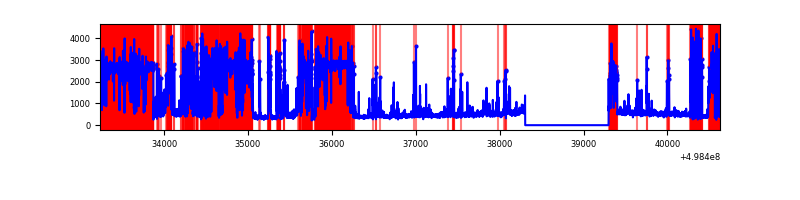 |
| D | 7391 | 6397 | 2934 | 2934 | 39.70% | 45.87% | 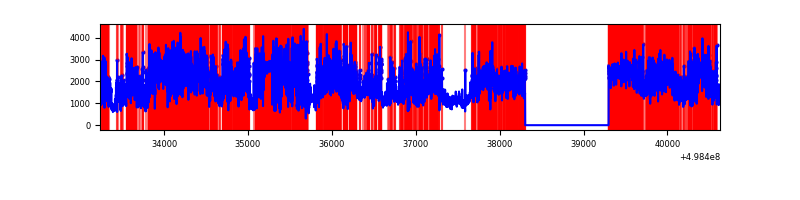 |
Top three noisy pixels from each quadrant. If the there are fewer than three noisy pixels in the level2.evt file, extra rows are filled as -1
| Pixel properties | Quadrant properties | ||||||
|---|---|---|---|---|---|---|---|
| Quadrant | DetID | PixID | Counts | Sigma | Mean | Median | Sigma |
| A | 12 | 15 | 103259 | 616.26 | 671 | 654 | 166.5 |
| A | 0 | 8 | 43611 | 258.01 | 671 | 654 | 166.5 |
| A | 8 | 246 | 27806 | 163.08 | 671 | 654 | 166.5 |
| B | 10 | 14 | 79656 | 550.49 | 666 | 640 | 143.5 |
| B | 10 | 247 | 33150 | 226.49 | 666 | 640 | 143.5 |
| B | 4 | 81 | 24824 | 168.49 | 666 | 640 | 143.5 |
| C | 1 | 241 | 4455753 | 29001.3 | 558 | 551 | 153.6 |
| C | 1 | 16 | 457124 | 2972.08 | 558 | 551 | 153.6 |
| C | 14 | 254 | 260152 | 1689.88 | 558 | 551 | 153.6 |
| D | 8 | 176 | 7288508 | 47158.79 | 530 | 504 | 154.5 |
| D | 2 | 172 | 1336554 | 8645.23 | 530 | 504 | 154.5 |
| D | 2 | 62 | 1260700 | 8154.4 | 530 | 504 | 154.5 |
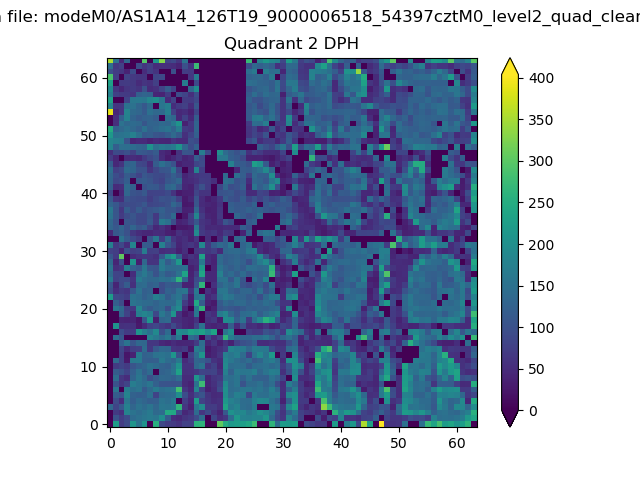
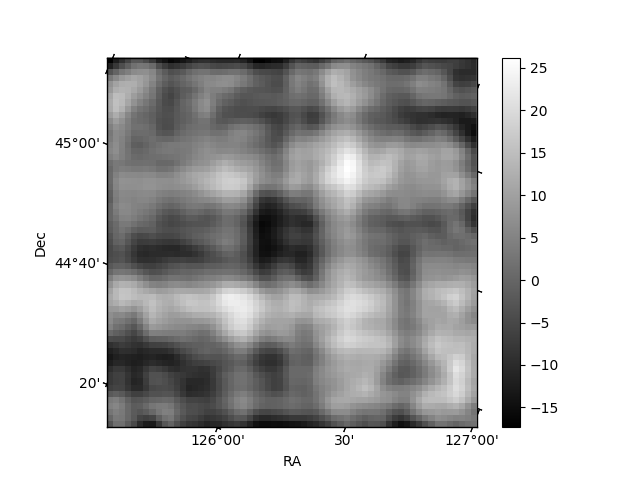
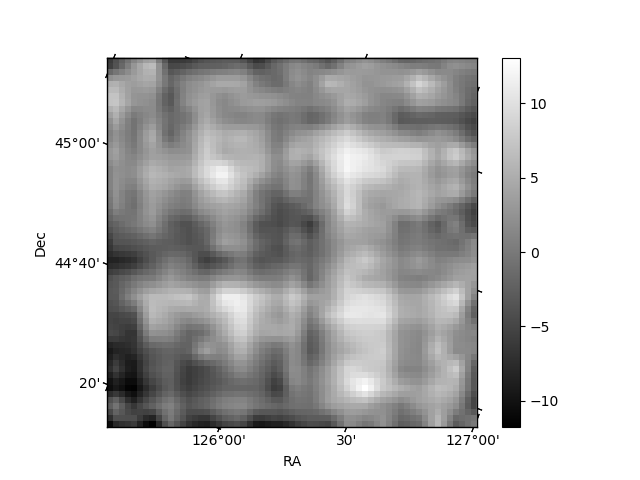
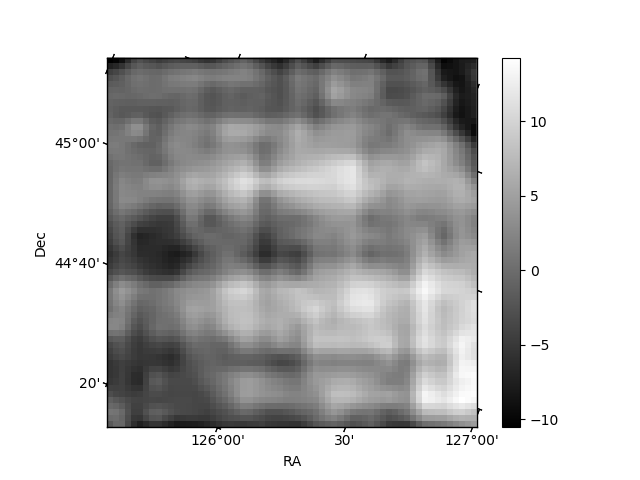
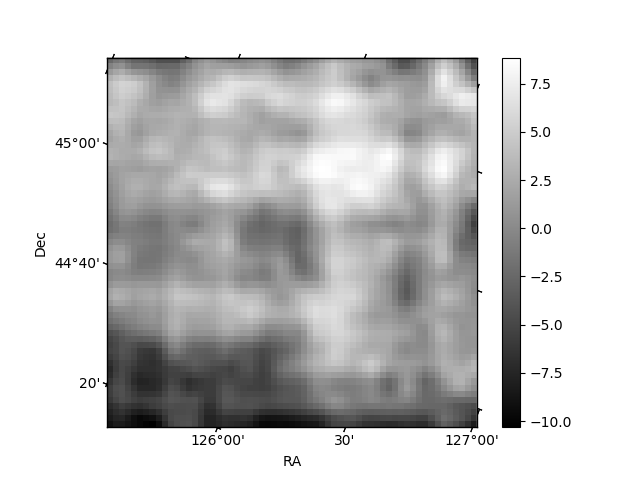
Histogram calculated using DETX and DETY for each event in the final _common_clean file
| Quadrant A | 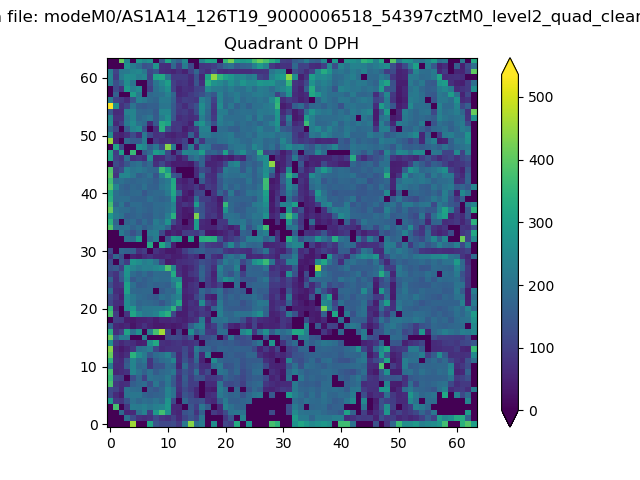 |
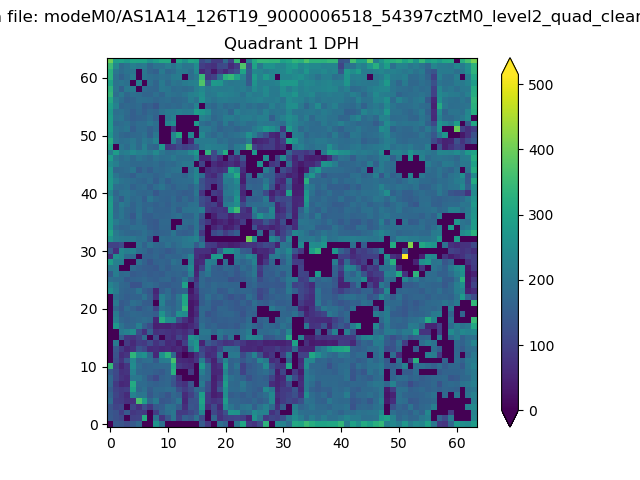 |
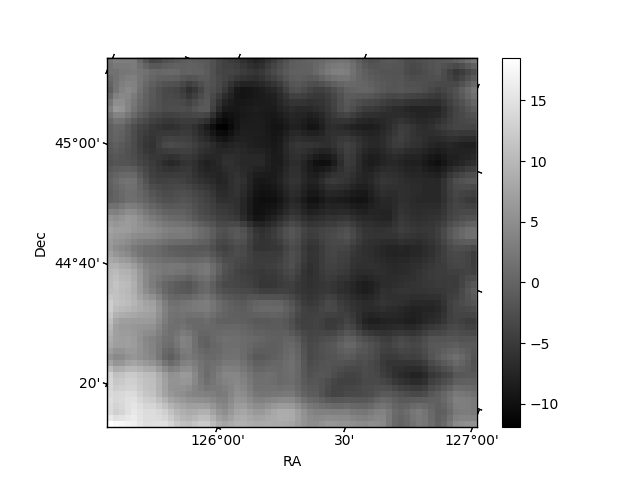
Quadrant B |
|---|---|---|---|
| Quadrant D | 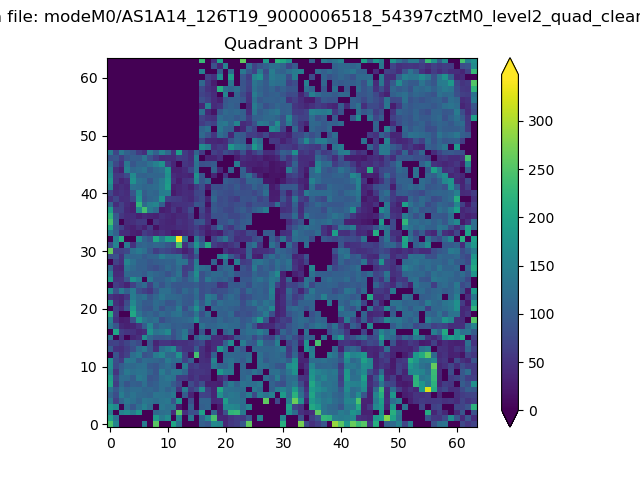 |
 |
Quadrant C |
| Plot type | Count rate plots | Images |
|---|---|---|
| Comparison with Poisson distribution Blue bars denote a histogram of data divided into 1 sec bins. Red curve is a Poisson curve with rate = median count rate of data. |
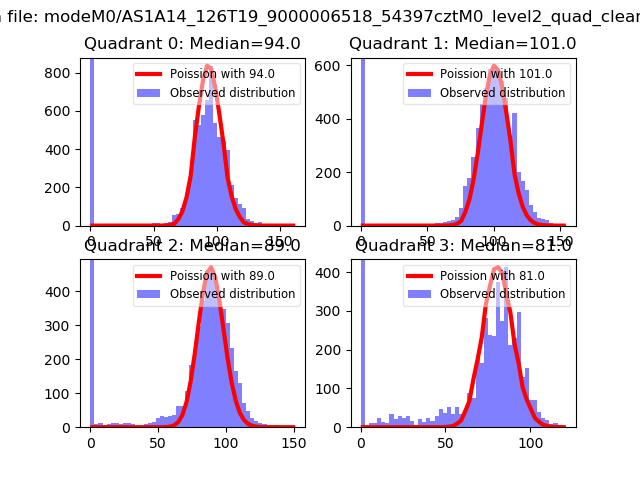 |
 |
| Quadrant-wise count rates Data is divided into 100 sec bins |
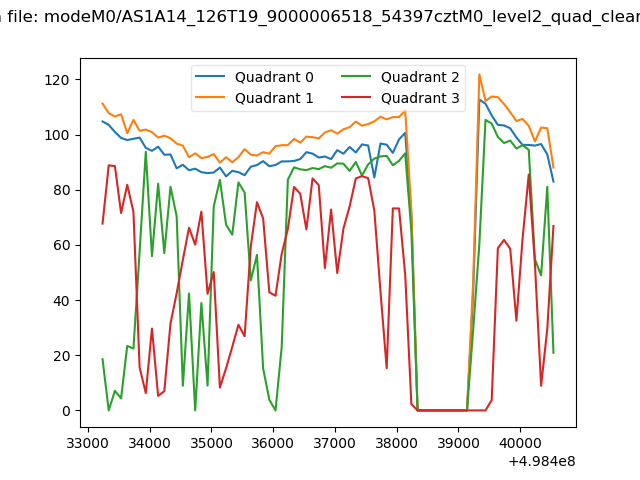 |
|
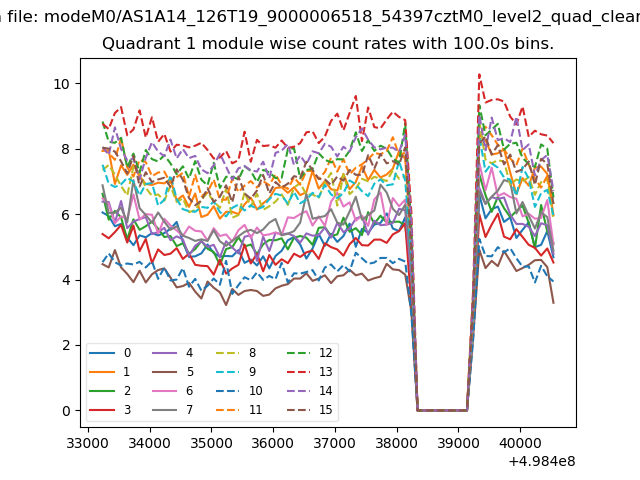
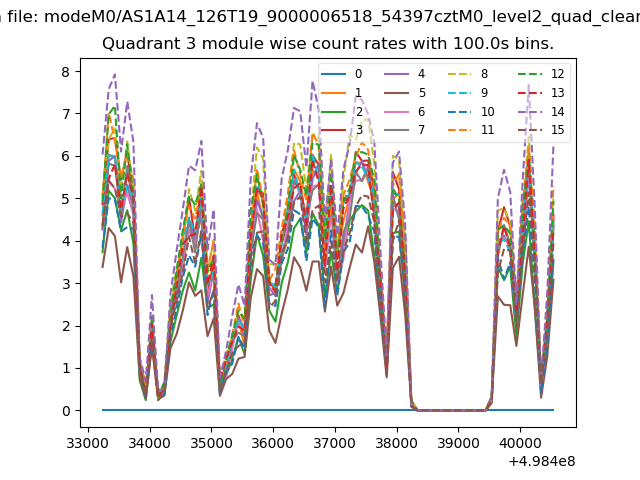
| Module-wise count rates for Quadrant A Data is divided into 100 sec bins |
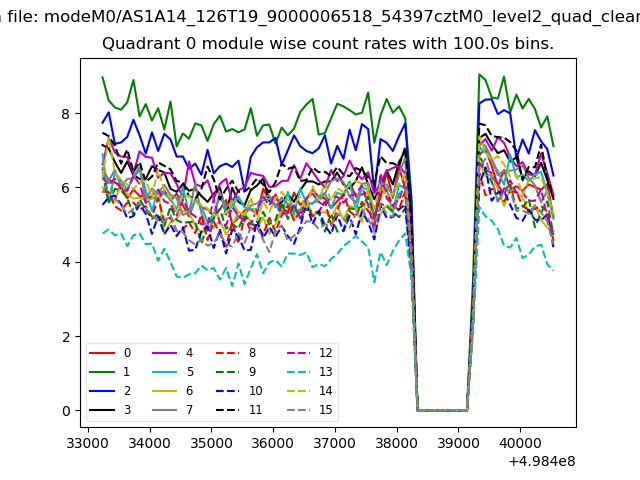 |
 |
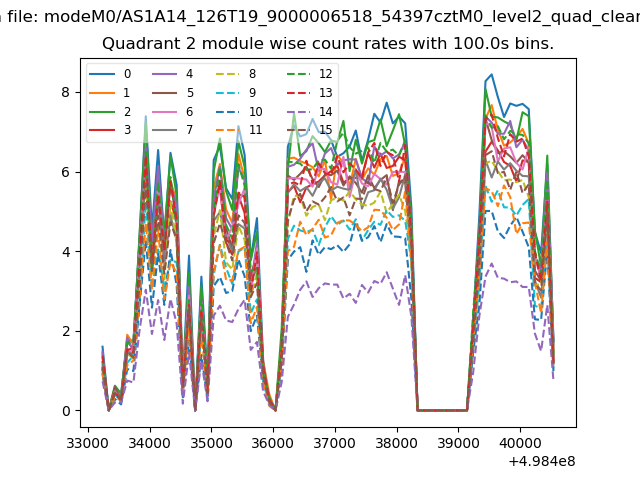
| Module-wise count rates for Quadrant B Data is divided into 100 sec bins |
 |
 |
| Module-wise count rates for Quadrant C Data is divided into 100 sec bins |
 |
 |
| Module-wise count rates for Quadrant D Data is divided into 100 sec bins |
 |
 |
| Parameter | Plot |
|---|---|
| CZT HV Monitor | 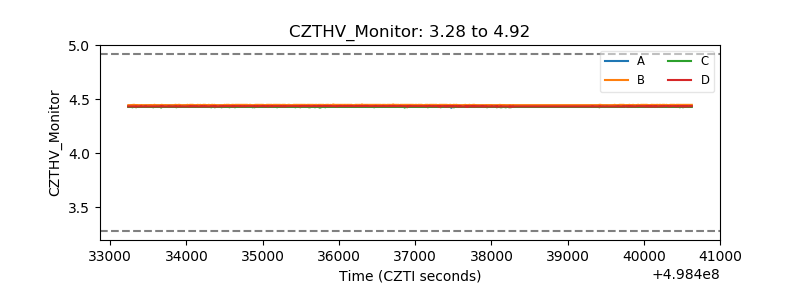 |
| D_VDD | 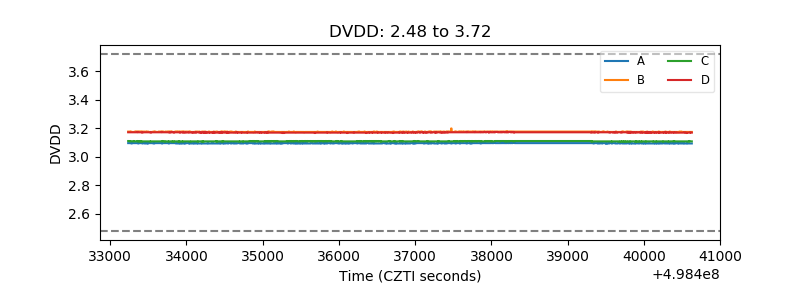 |
| Temperature 1 | 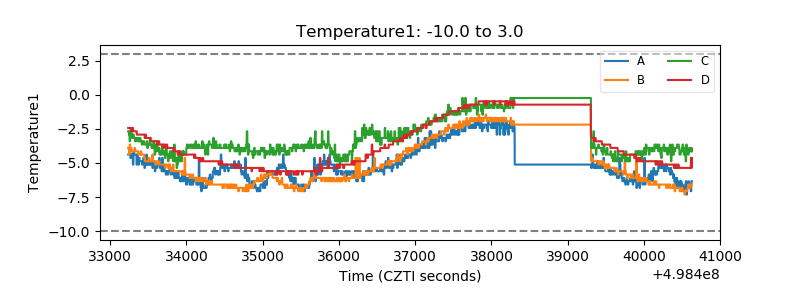 |
| Veto HV Monitor | 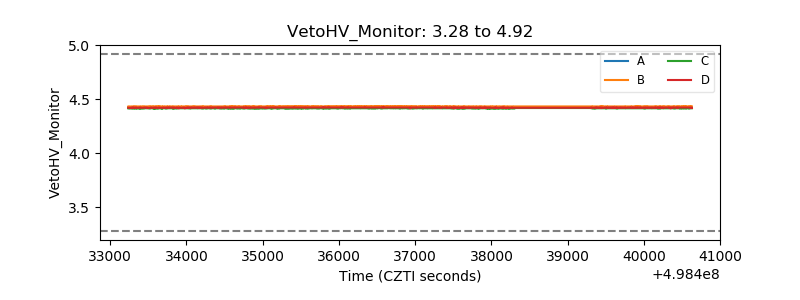 |
| Veto LLD | 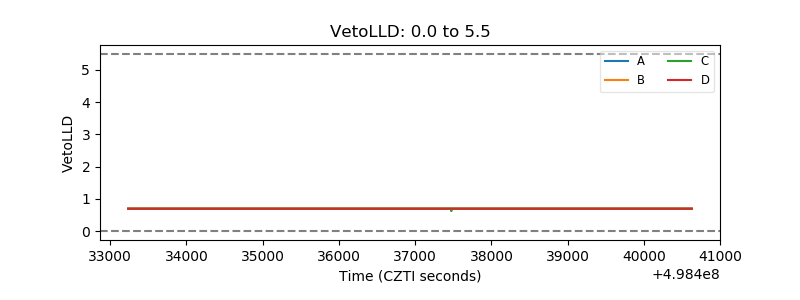 |
| Alpha Counter | 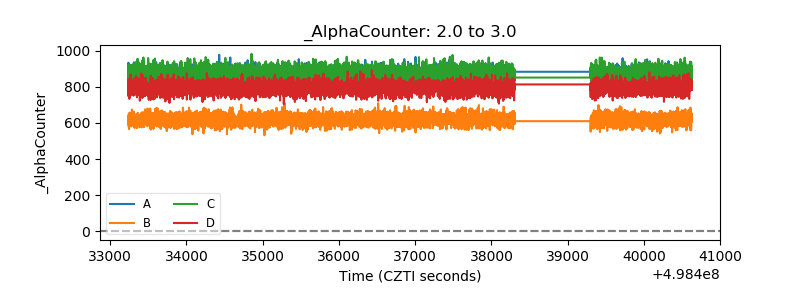 |
| _CPM_Rate | 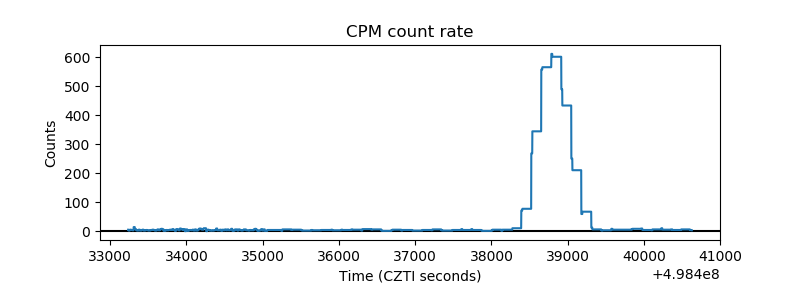 |
| CZT Counter | 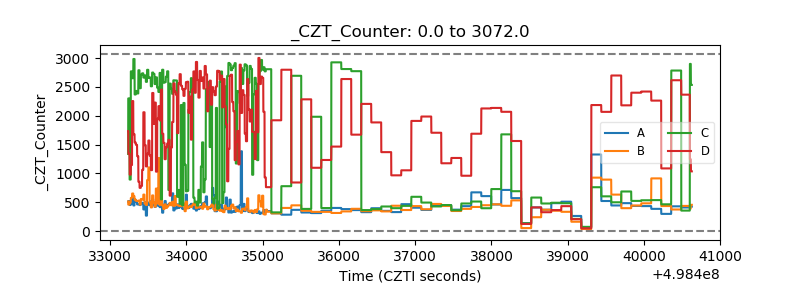 |
| +2.5 Volts monitor |  |
| +5 Volts monitor |  |
| _ROLL_ROT | 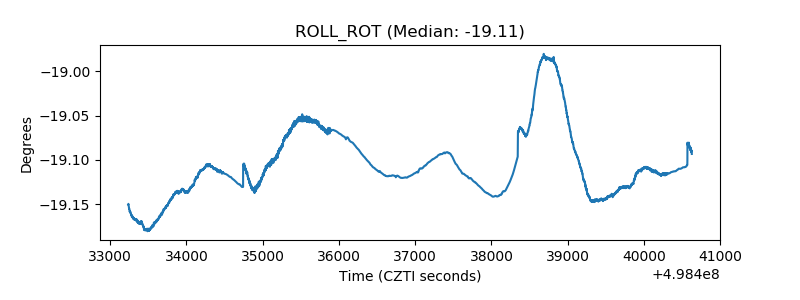 |
| _Roll_DEC | 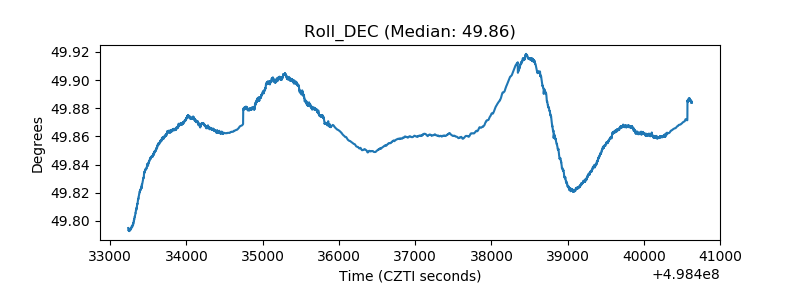 |
| _Roll_RA | 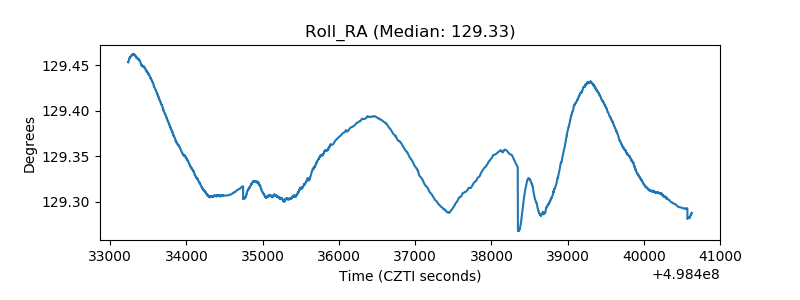 |
| Veto Counter | 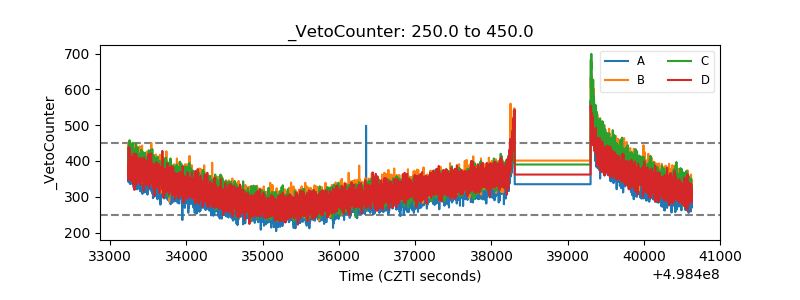 |