| Param | Original file | Final file |
|---|---|---|
| Filename | modeM0/AS1A14_126T19_9000006518_54399cztM0_level2.fits | modeM0/AS1A14_126T19_9000006518_54399cztM0_level2_quad_clean.evt |
| Size (bytes) | 600,747,840 | 87,716,160 |
| Size | 572.9 MB | 83.7 MB |
| Events in quadrant A | 2,865,503 | 628,211 |
| Events in quadrant B | 3,145,757 | 677,004 |
| Events in quadrant C | 4,303,726 | 570,860 |
| Events in quadrant D | 11,425,326 | 333,009 |
| Mode SS | |||
|---|---|---|---|
| Quadrant | BADHDUFLAG | Total packets | Discarded packets |
| A | 0 | 130 | 0 |
| B | 0 | 130 | 0 |
| C | 0 | 130 | 0 |
| D | 0 | 130 | 0 |
| Mode M0 | |||
|---|---|---|---|
| Quadrant | BADHDUFLAG | Total packets | Discarded packets |
| A | 0 | 13505 | 2 |
| B | 0 | 14058 | 2 |
| C | 0 | 17552 | 2 |
| D | 0 | 38387 | 2 |
| Mode M9 | |||
|---|---|---|---|
| Quadrant | BADHDUFLAG | Total packets | Discarded packets |
| A | 0 | 20 | 0 |
| B | 0 | 20 | 0 |
| C | 0 | 21 | 0 |
| D | 0 | 21 | 0 |
| Quadrant | Total seconds | Saturated seconds | Saturation percentage |
|---|---|---|---|
| A | 6405 | 47 | 0.733802% |
| B | 6405 | 98 | 1.530055% |
| C | 6405 | 449 | 7.010148% |
| D | 6405 | 2851 | 44.512100% |
Noise dominated data is calculated using 1-second bins in cleaned event files. If a bin has >2000 counts, and if more than 50% of those come from <1% of pixels, then it is considered to be noise-dominated and hence unusable.
| Quadrant | # 1 sec bins | Bins with >0 counts | Bins with >2000 counts | High rate bins dominated by noise | Noise dominated (total time) | Noise dominated (detector-on time) | Marked lightcurve |
|---|---|---|---|---|---|---|---|
| A | 7570 | 6406 | 31 | 31 | 0.41% | 0.48% | 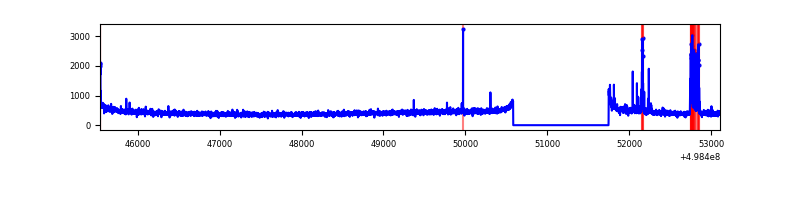 |
| B | 7570 | 6406 | 59 | 59 | 0.78% | 0.92% | 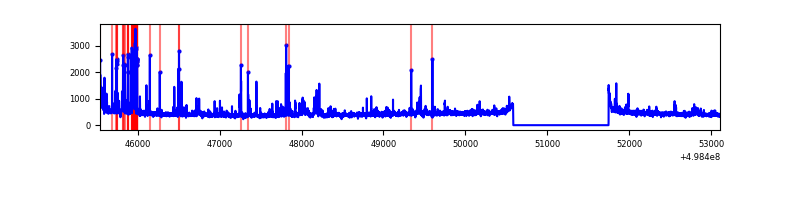 |
| C | 7570 | 6405 | 397 | 397 | 5.24% | 6.20% | 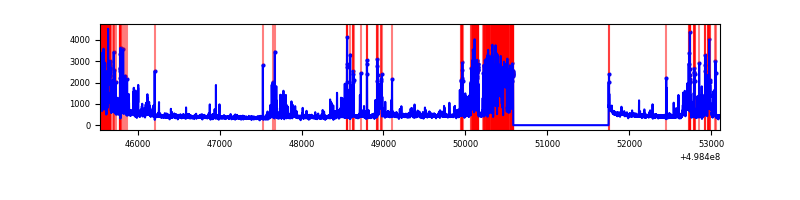 |
| D | 7570 | 6405 | 2473 | 2473 | 32.67% | 38.61% | 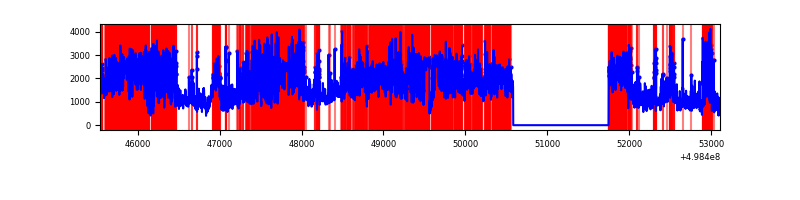 |
Top three noisy pixels from each quadrant. If the there are fewer than three noisy pixels in the level2.evt file, extra rows are filled as -1
| Pixel properties | Quadrant properties | ||||||
|---|---|---|---|---|---|---|---|
| Quadrant | DetID | PixID | Counts | Sigma | Mean | Median | Sigma |
| A | 12 | 15 | 152328 | 890.5 | 682 | 664 | 170.3 |
| A | 3 | 62 | 19218 | 108.94 | 682 | 664 | 170.3 |
| A | 3 | 14 | 14383 | 80.55 | 682 | 664 | 170.3 |
| B | 10 | 14 | 229607 | 1577.74 | 679 | 655 | 145.1 |
| B | 4 | 81 | 90225 | 617.24 | 679 | 655 | 145.1 |
| B | 4 | 171 | 43240 | 293.46 | 679 | 655 | 145.1 |
| C | 1 | 241 | 1064949 | 5951.89 | 641 | 633 | 178.8 |
| C | 4 | 5 | 440856 | 2461.82 | 641 | 633 | 178.8 |
| C | 14 | 254 | 84863 | 471.03 | 641 | 633 | 178.8 |
| D | 8 | 176 | 3681564 | 23413.99 | 543 | 518 | 157.2 |
| D | 2 | 172 | 2639447 | 16785.41 | 543 | 518 | 157.2 |
| D | 2 | 62 | 2420483 | 15392.65 | 543 | 518 | 157.2 |
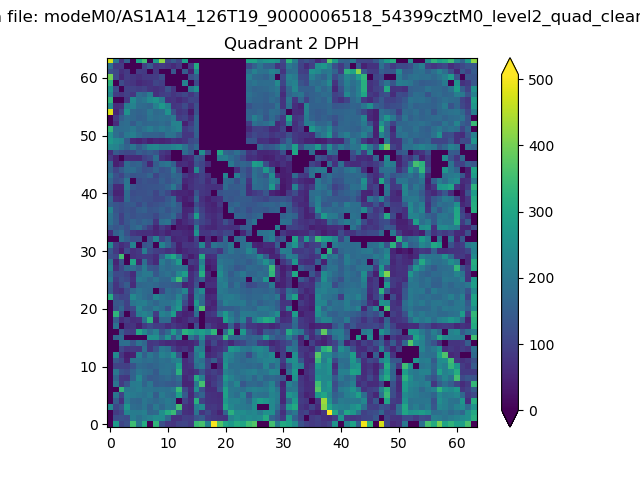
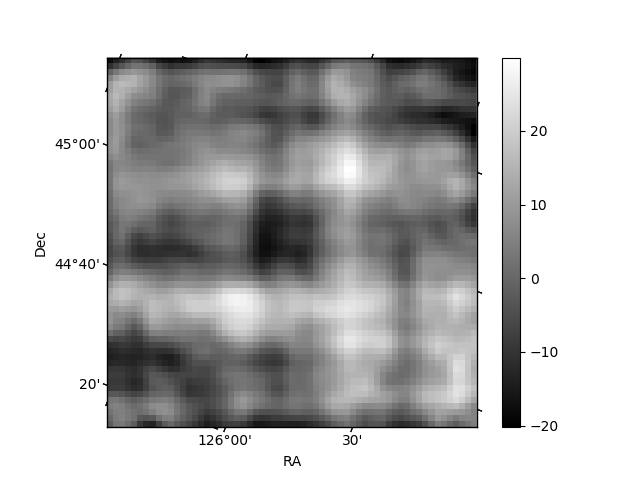
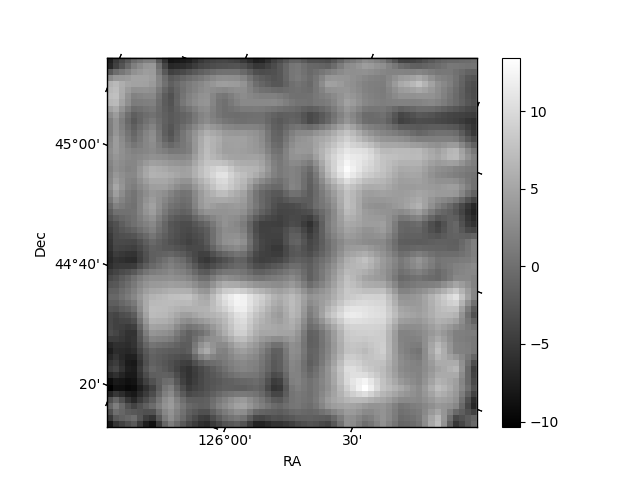
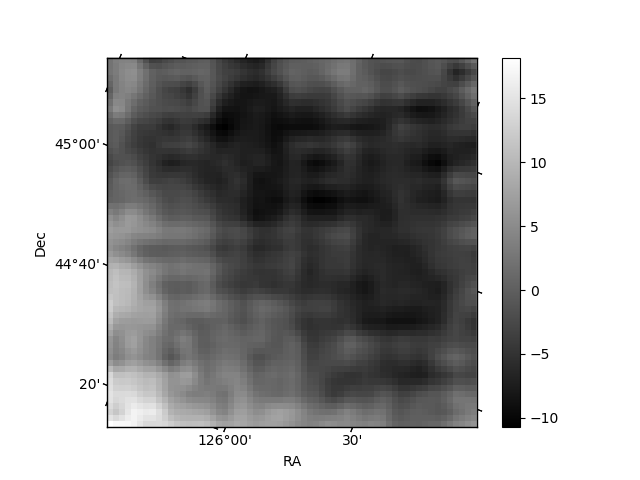
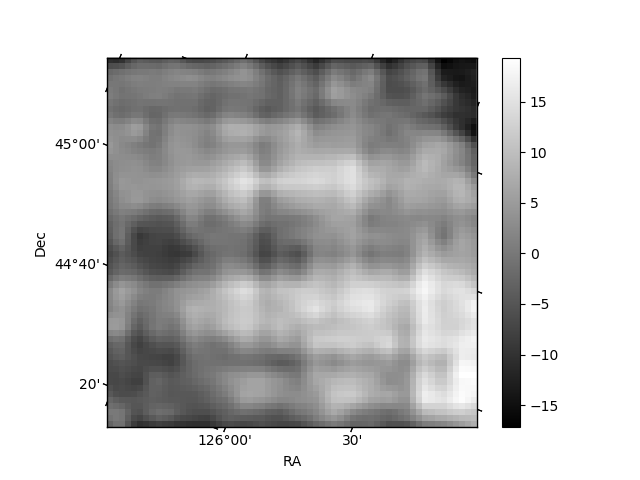
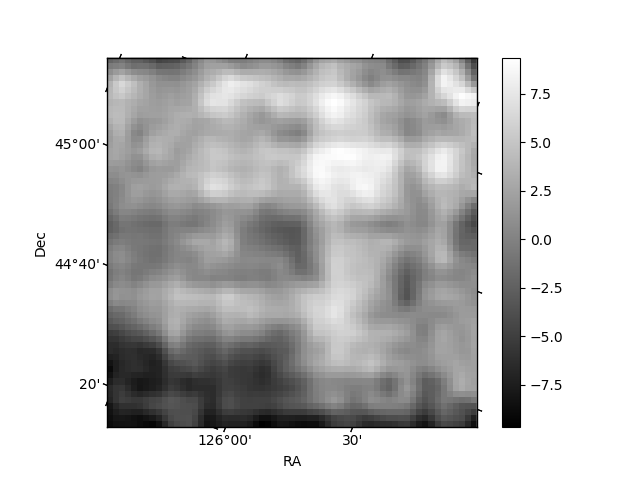
Histogram calculated using DETX and DETY for each event in the final _common_clean file
| Quadrant A | 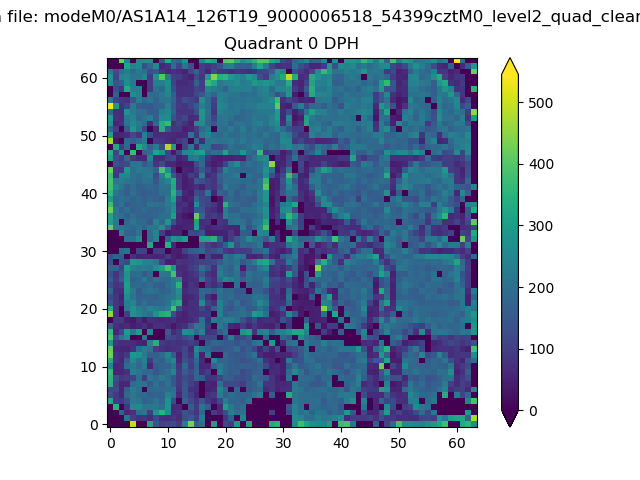 |
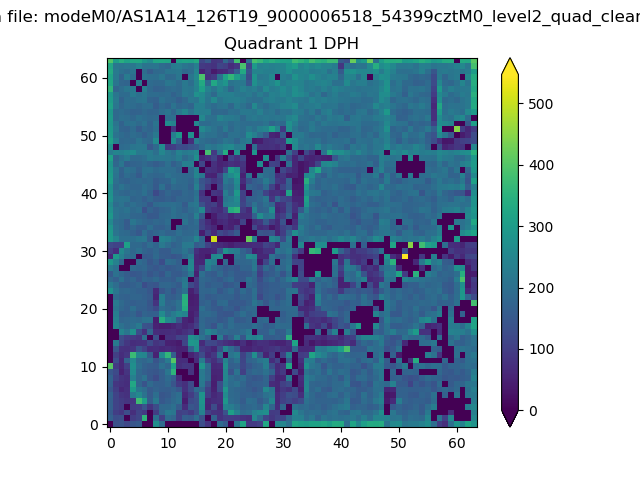 |
Quadrant B |
|---|---|---|---|
| Quadrant D | 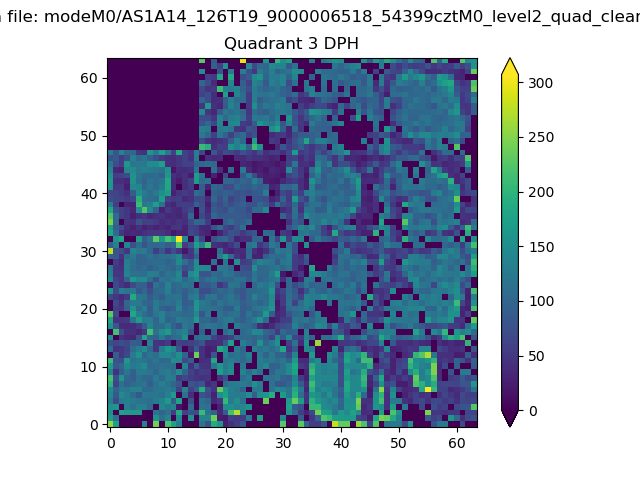 |
 |
Quadrant C |
| Plot type | Count rate plots | Images |
|---|---|---|
| Comparison with Poisson distribution Blue bars denote a histogram of data divided into 1 sec bins. Red curve is a Poisson curve with rate = median count rate of data. |
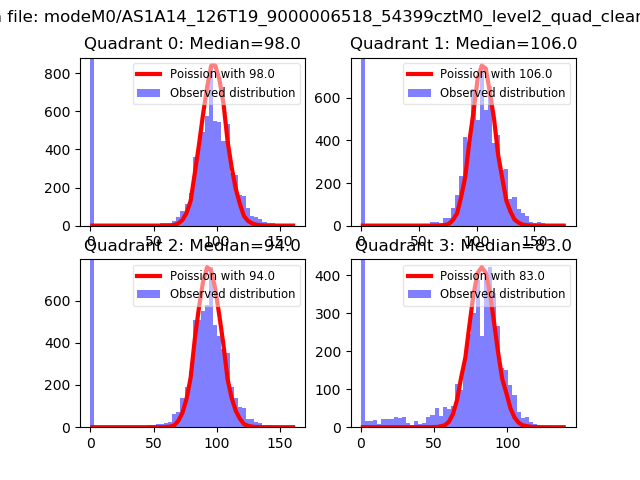 |
 |
| Quadrant-wise count rates Data is divided into 100 sec bins |
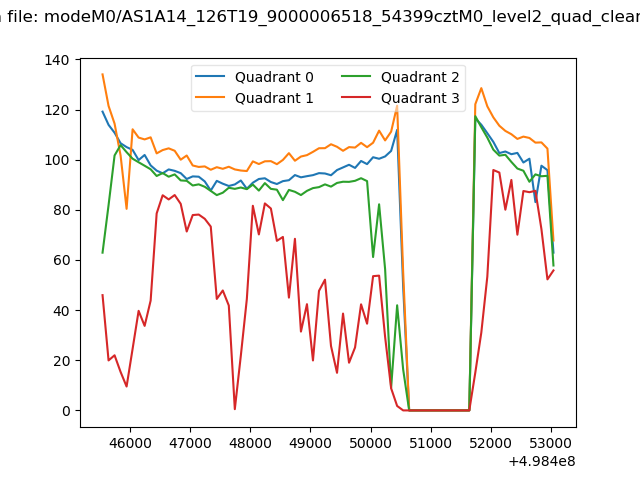 |
|
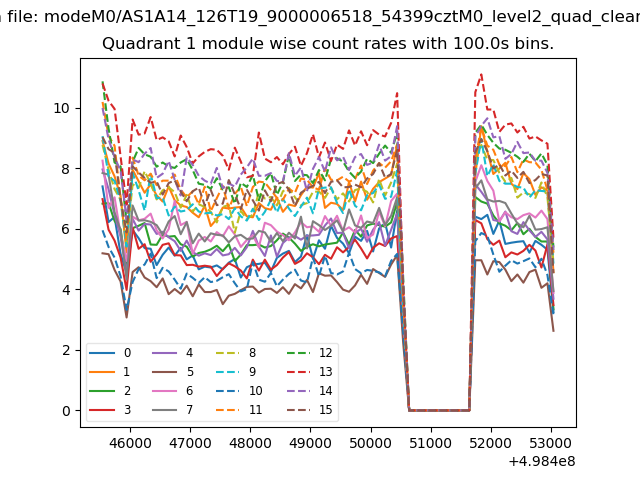
| Module-wise count rates for Quadrant A Data is divided into 100 sec bins |
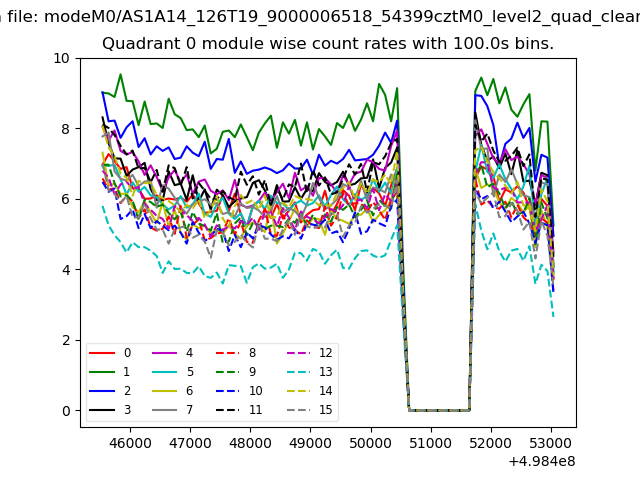 |
 |
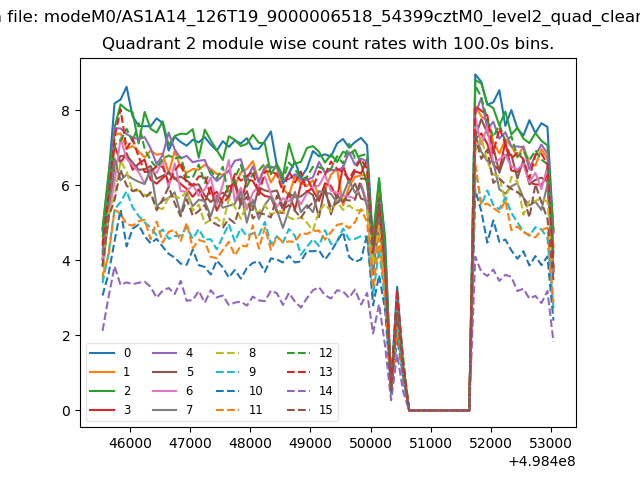
| Module-wise count rates for Quadrant B Data is divided into 100 sec bins |
 |
 |
| Module-wise count rates for Quadrant C Data is divided into 100 sec bins |
 |
 |
| Module-wise count rates for Quadrant D Data is divided into 100 sec bins |
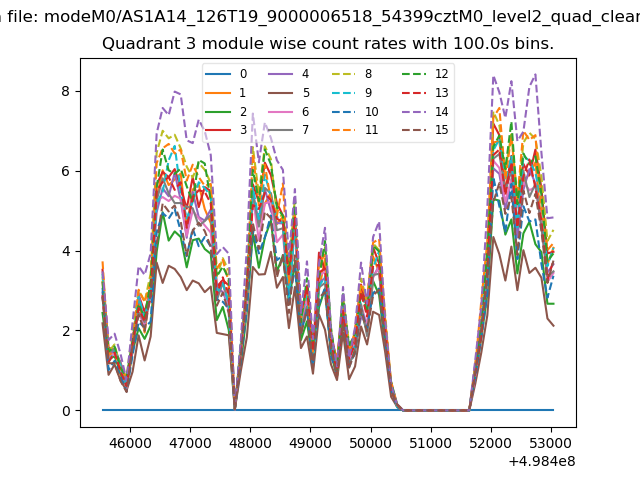 |
 |
| Parameter | Plot |
|---|---|
| CZT HV Monitor | 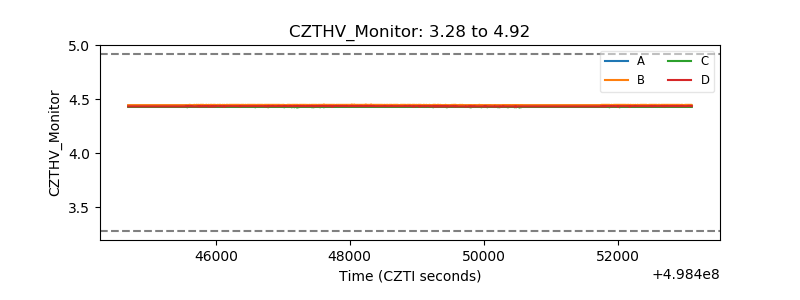 |
| D_VDD | 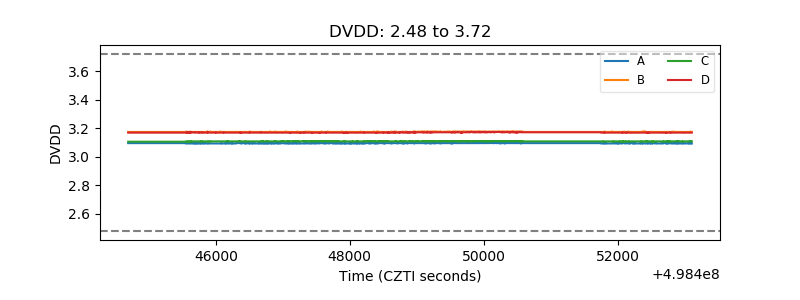 |
| Temperature 1 | 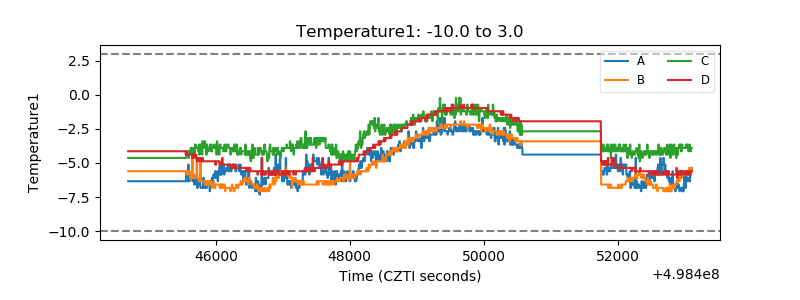 |
| Veto HV Monitor | 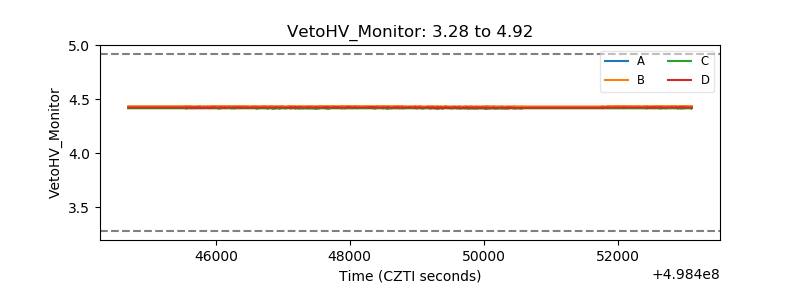 |
| Veto LLD | 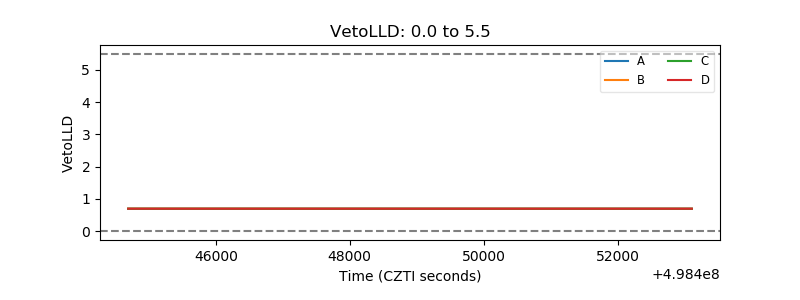 |
| Alpha Counter | 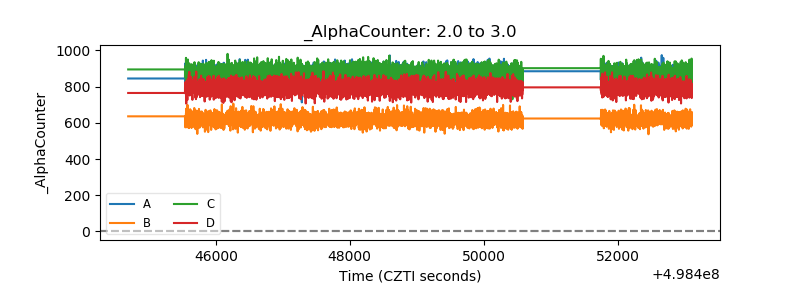 |
| _CPM_Rate | 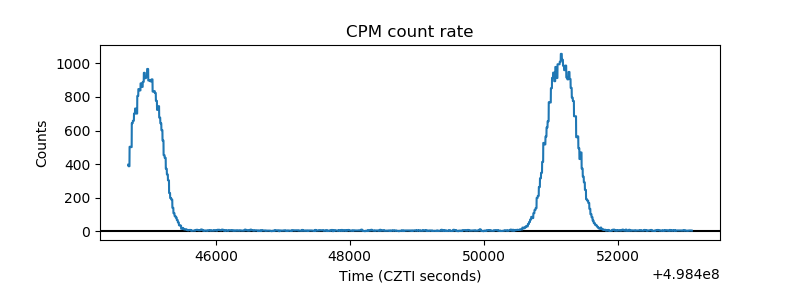 |
| CZT Counter | 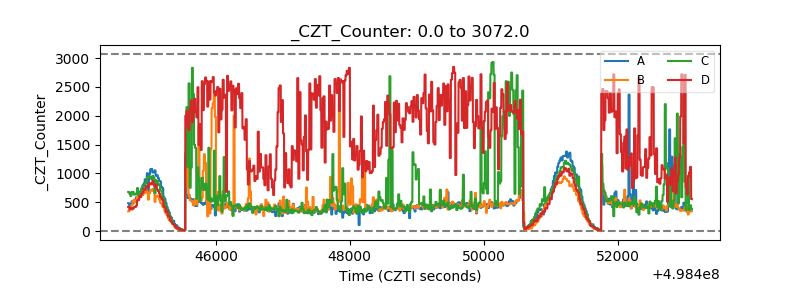 |
| +2.5 Volts monitor | 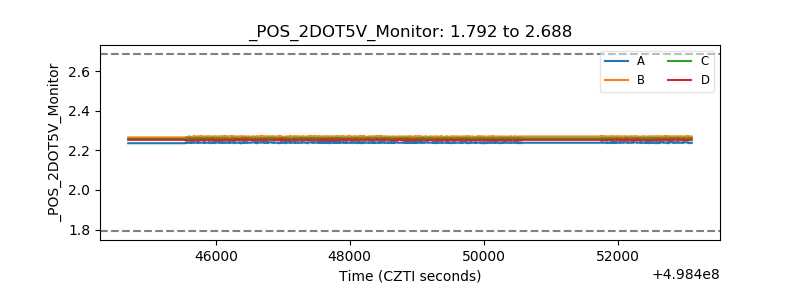 |
| +5 Volts monitor | 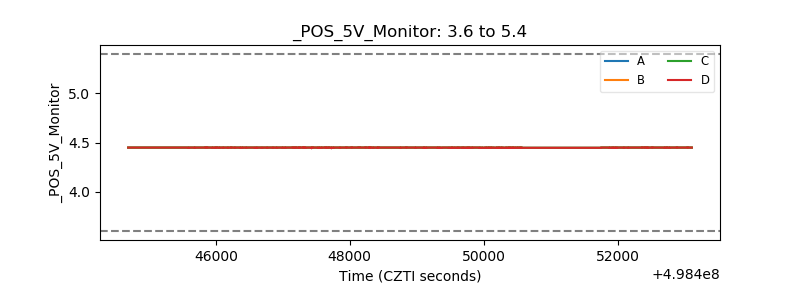 |
| _ROLL_ROT | 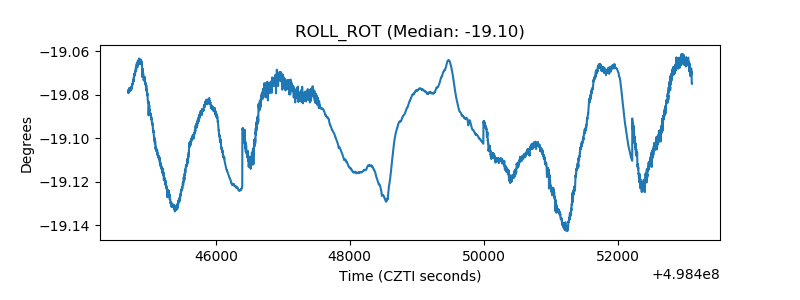 |
| _Roll_DEC | 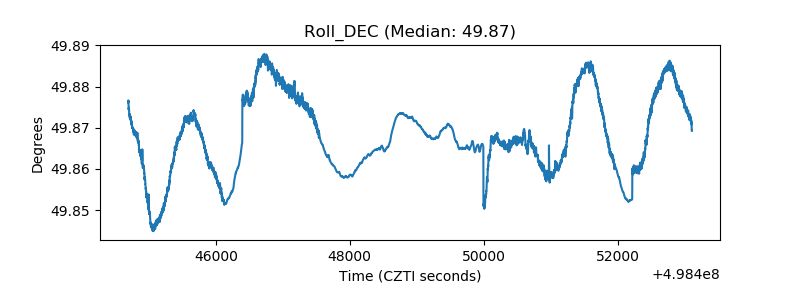 |
| _Roll_RA | 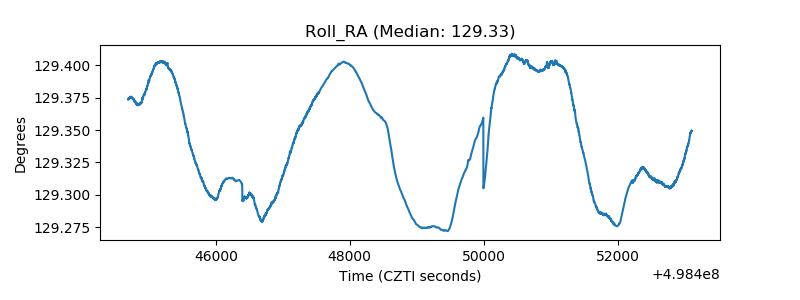 |
| Veto Counter | 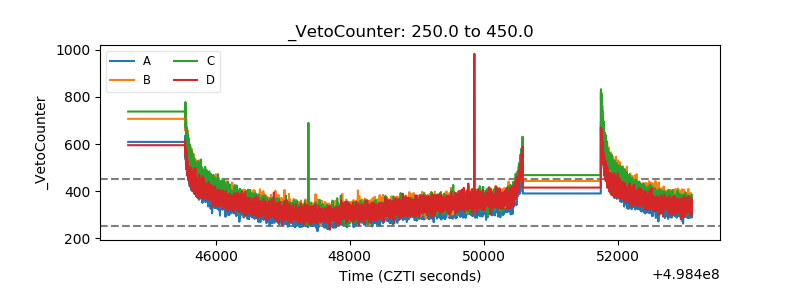 |