| Param | Original file | Final file |
|---|---|---|
| Filename | modeM0/AS1A14_126T19_9000006518_54402cztM0_level2.fits | modeM0/AS1A14_126T19_9000006518_54402cztM0_level2_quad_clean.evt |
| Size (bytes) | 720,293,760 | 76,979,520 |
| Size | 686.9 MB | 73.4 MB |
| Events in quadrant A | 2,950,446 | 601,828 |
| Events in quadrant B | 2,933,311 | 647,552 |
| Events in quadrant C | 5,597,774 | 521,229 |
| Events in quadrant D | 14,688,636 | 117,960 |
| Mode SS | |||
|---|---|---|---|
| Quadrant | BADHDUFLAG | Total packets | Discarded packets |
| A | 0 | 128 | 0 |
| B | 0 | 128 | 0 |
| C | 0 | 128 | 0 |
| D | 0 | 128 | 0 |
| Mode M0 | |||
|---|---|---|---|
| Quadrant | BADHDUFLAG | Total packets | Discarded packets |
| A | 0 | 13590 | 1 |
| B | 0 | 13550 | 1 |
| C | 0 | 21248 | 1 |
| D | 0 | 47987 | 1 |
| Mode M9 | |||
|---|---|---|---|
| Quadrant | BADHDUFLAG | Total packets | Discarded packets |
| A | 0 | 9 | 0 |
| B | 0 | 9 | 0 |
| C | 0 | 9 | 0 |
| D | 0 | 9 | 0 |
| Quadrant | Total seconds | Saturated seconds | Saturation percentage |
|---|---|---|---|
| A | 6340 | 103 | 1.624606% |
| B | 6341 | 110 | 1.734742% |
| C | 6341 | 828 | 13.057877% |
| D | 6341 | 5178 | 81.659044% |
Noise dominated data is calculated using 1-second bins in cleaned event files. If a bin has >2000 counts, and if more than 50% of those come from <1% of pixels, then it is considered to be noise-dominated and hence unusable.
| Quadrant | # 1 sec bins | Bins with >0 counts | Bins with >2000 counts | High rate bins dominated by noise | Noise dominated (total time) | Noise dominated (detector-on time) | Marked lightcurve |
|---|---|---|---|---|---|---|---|
| A | 7195 | 6340 | 21 | 21 | 0.29% | 0.33% | 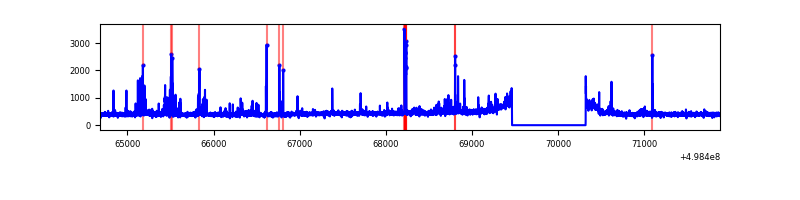 |
| B | 7196 | 6342 | 9 | 9 | 0.13% | 0.14% | 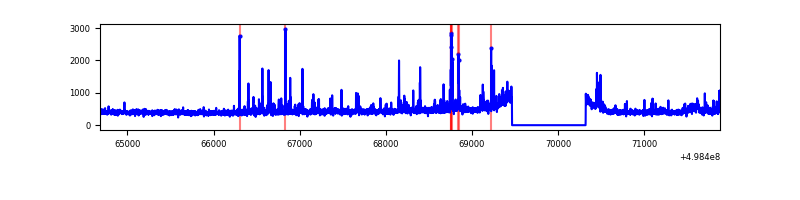 |
| C | 7196 | 6342 | 747 | 747 | 10.38% | 11.78% | 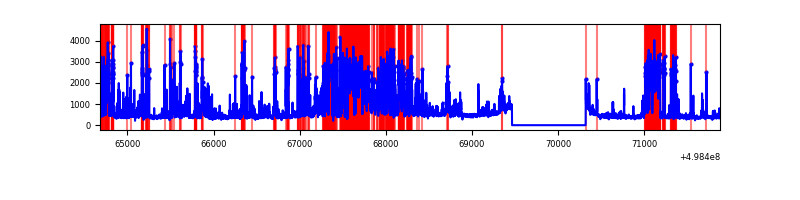 |
| D | 7196 | 6341 | 4786 | 4786 | 66.51% | 75.48% | 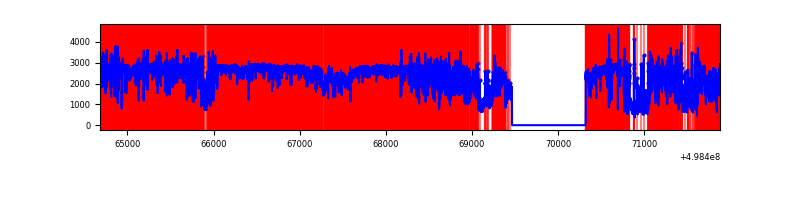 |
Top three noisy pixels from each quadrant. If the there are fewer than three noisy pixels in the level2.evt file, extra rows are filled as -1
| Pixel properties | Quadrant properties | ||||||
|---|---|---|---|---|---|---|---|
| Quadrant | DetID | PixID | Counts | Sigma | Mean | Median | Sigma |
| A | 12 | 15 | 109544 | 649.43 | 681 | 664 | 167.7 |
| A | 0 | 8 | 56858 | 335.18 | 681 | 664 | 167.7 |
| A | 8 | 246 | 42545 | 249.8 | 681 | 664 | 167.7 |
| B | 0 | 213 | 57495 | 391.62 | 668 | 645 | 145.2 |
| B | 4 | 81 | 47234 | 320.94 | 668 | 645 | 145.2 |
| B | 5 | 185 | 44212 | 300.12 | 668 | 645 | 145.2 |
| C | 13 | 3 | 1375913 | 7974.27 | 621 | 615 | 172.5 |
| C | 4 | 5 | 602689 | 3490.95 | 621 | 615 | 172.5 |
| C | 1 | 241 | 502758 | 2911.53 | 621 | 615 | 172.5 |
| D | 8 | 176 | 12781547 | 141857.32 | 315 | 300 | 90.1 |
| D | 7 | 70 | 240829 | 2669.6 | 315 | 300 | 90.1 |
| D | 2 | 172 | 103284 | 1143.01 | 315 | 300 | 90.1 |
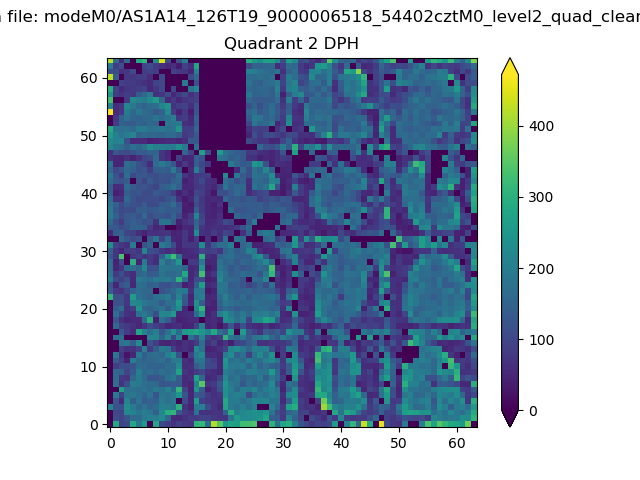
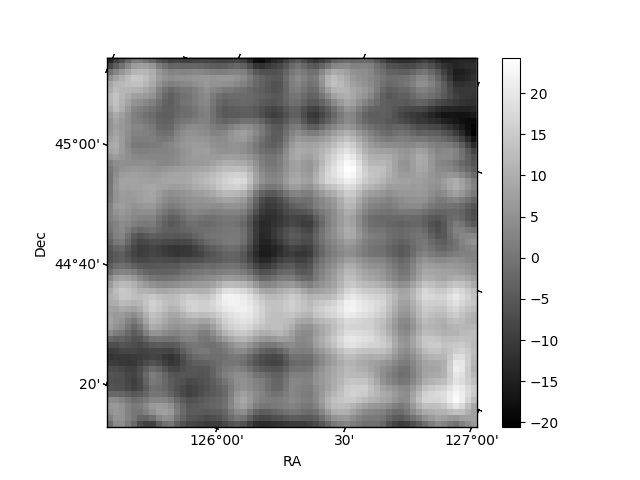
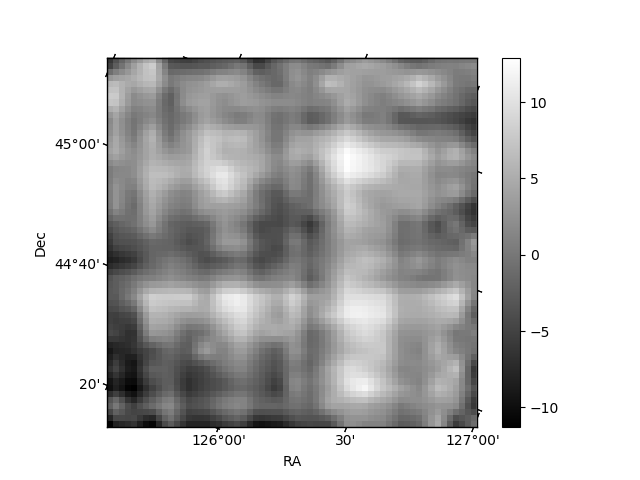
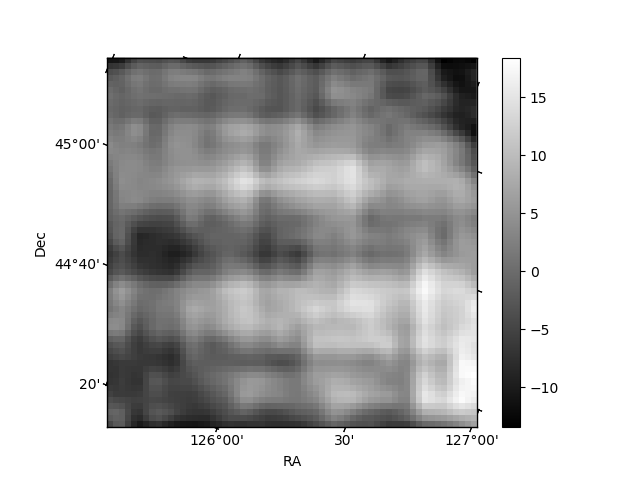
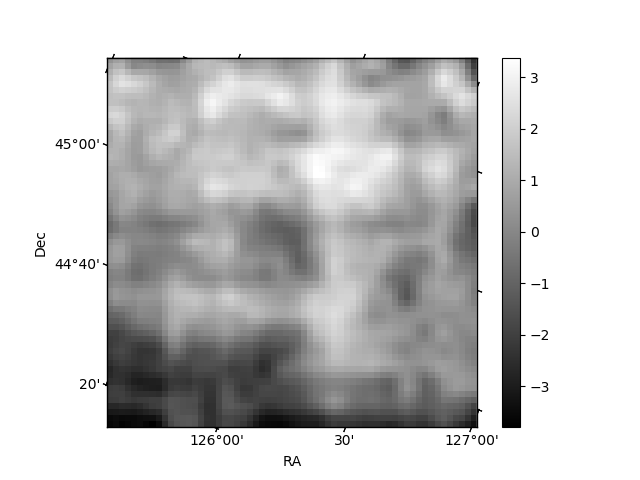
Histogram calculated using DETX and DETY for each event in the final _common_clean file
| Quadrant A | 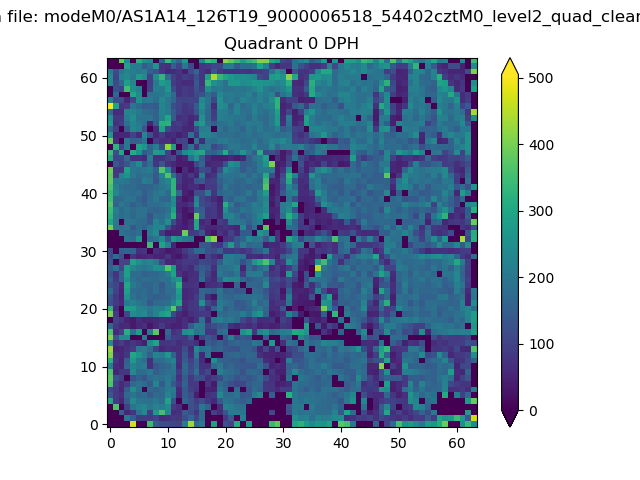 |
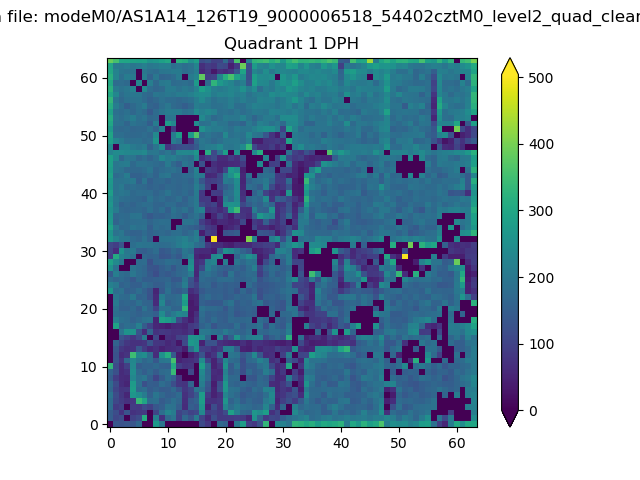 |
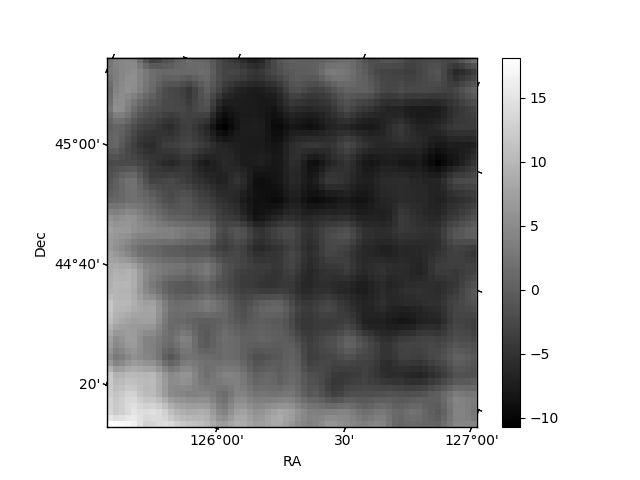
Quadrant B |
|---|---|---|---|
| Quadrant D | 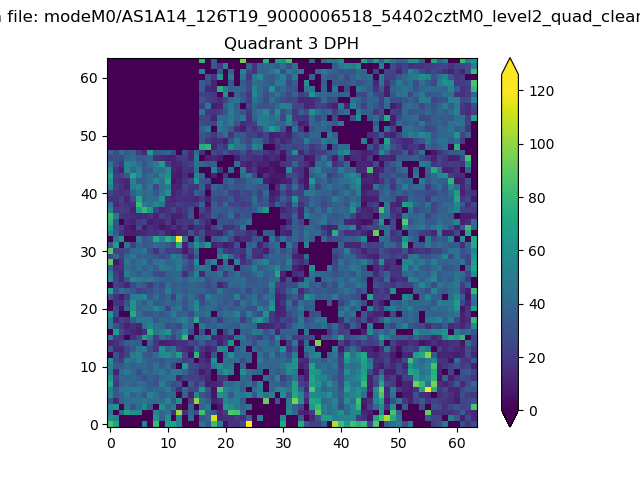 |
 |
Quadrant C |
| Plot type | Count rate plots | Images |
|---|---|---|
| Comparison with Poisson distribution Blue bars denote a histogram of data divided into 1 sec bins. Red curve is a Poisson curve with rate = median count rate of data. |
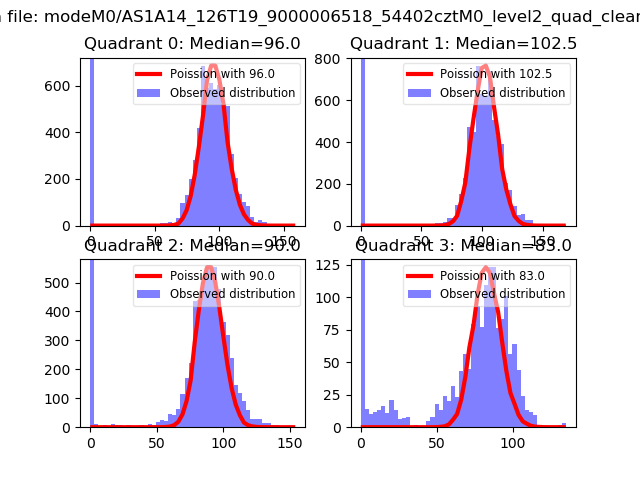 |
 |
| Quadrant-wise count rates Data is divided into 100 sec bins |
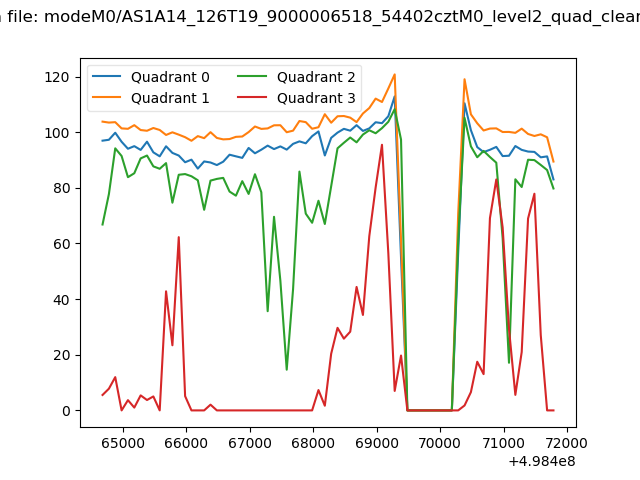 |
|
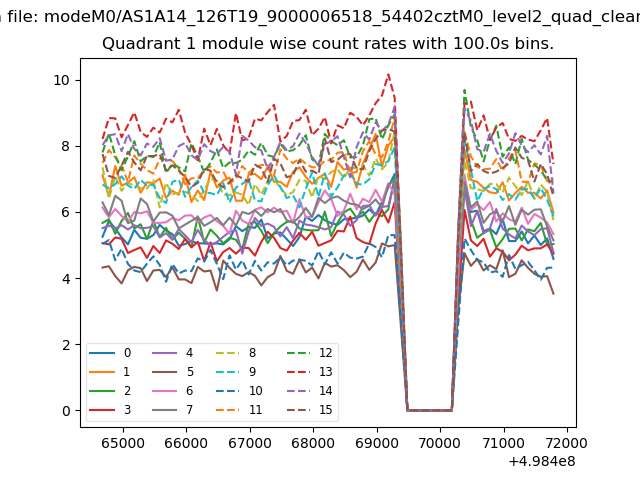
| Module-wise count rates for Quadrant A Data is divided into 100 sec bins |
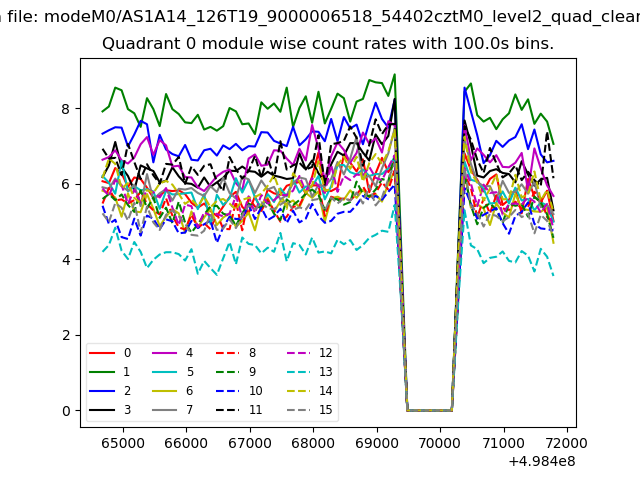 |
 |
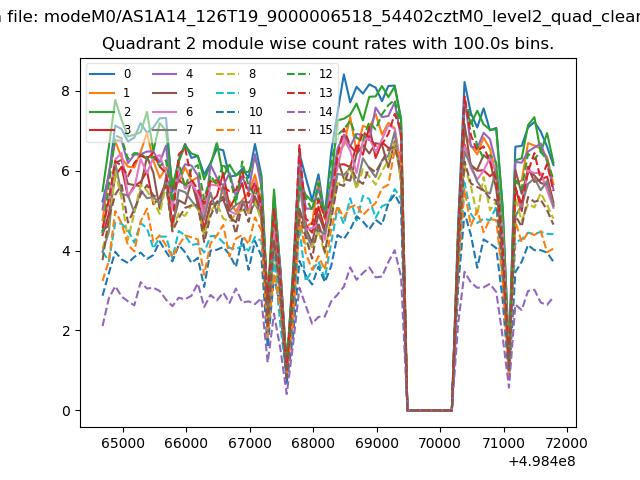
| Module-wise count rates for Quadrant B Data is divided into 100 sec bins |
 |
 |
| Module-wise count rates for Quadrant C Data is divided into 100 sec bins |
 |
 |
| Module-wise count rates for Quadrant D Data is divided into 100 sec bins |
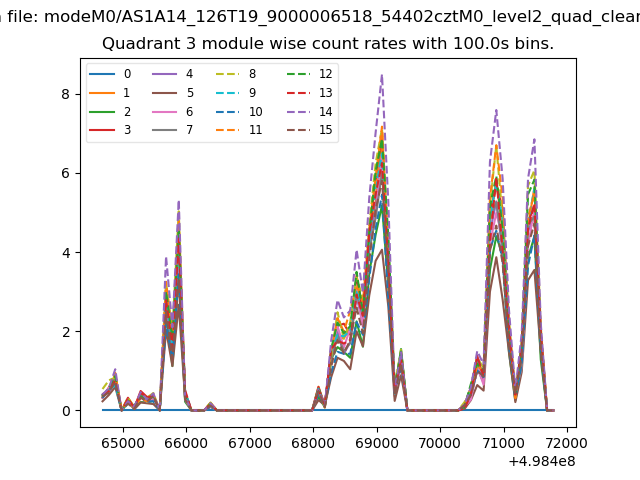 |
 |
| Parameter | Plot |
|---|---|
| CZT HV Monitor | 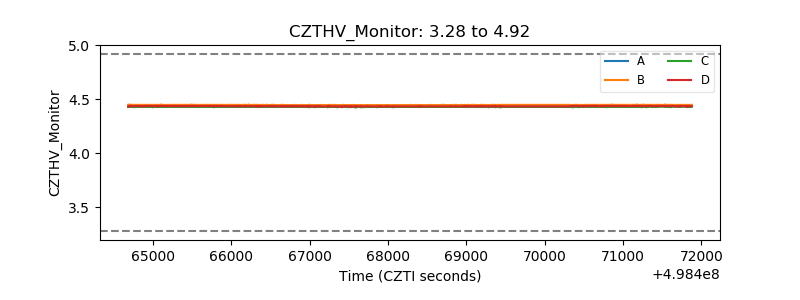 |
| D_VDD | 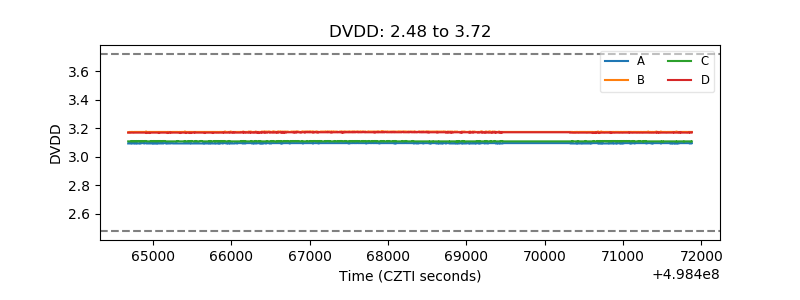 |
| Temperature 1 | 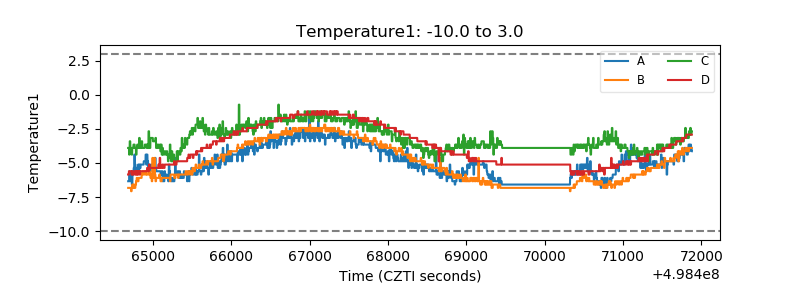 |
| Veto HV Monitor | 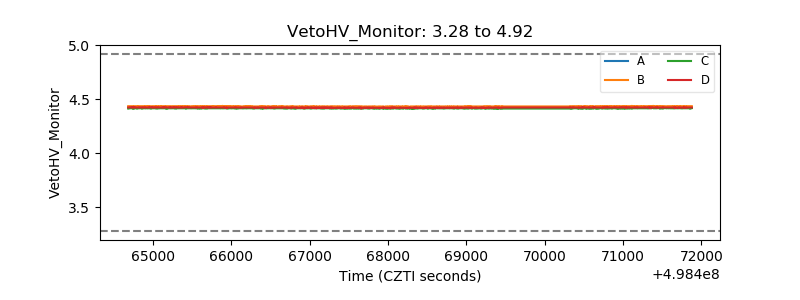 |
| Veto LLD | 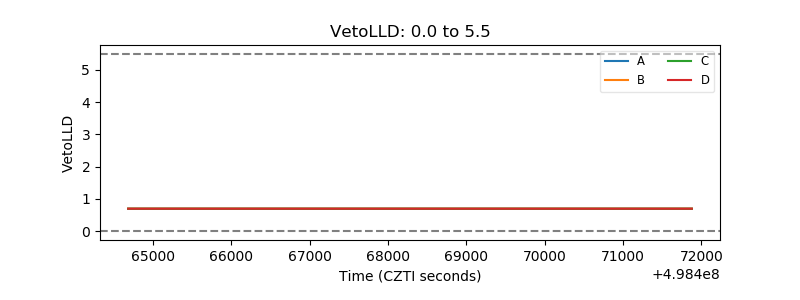 |
| Alpha Counter | 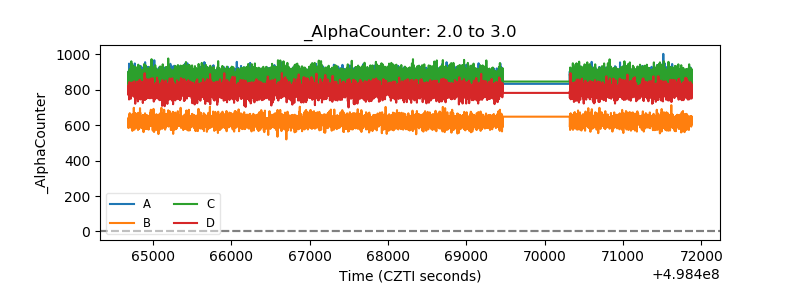 |
| _CPM_Rate | 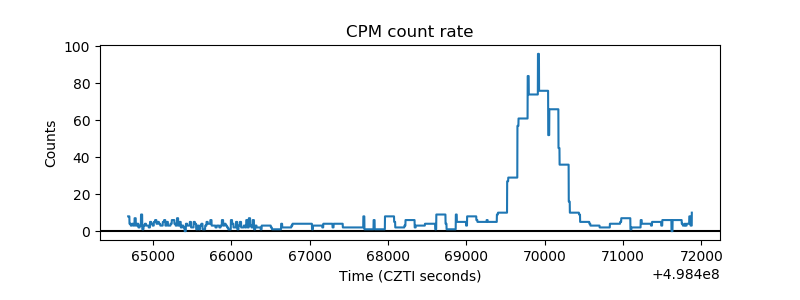 |
| CZT Counter | 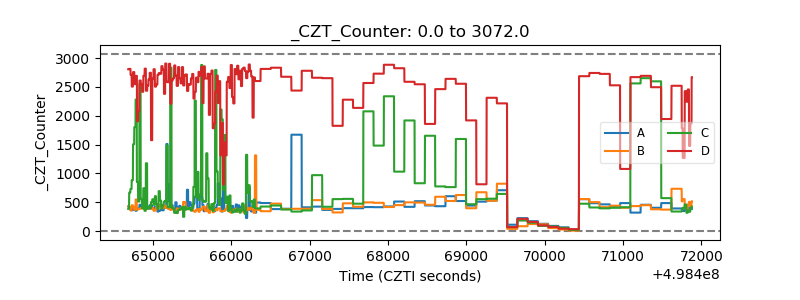 |
| +2.5 Volts monitor |  |
| +5 Volts monitor |  |
| _ROLL_ROT | 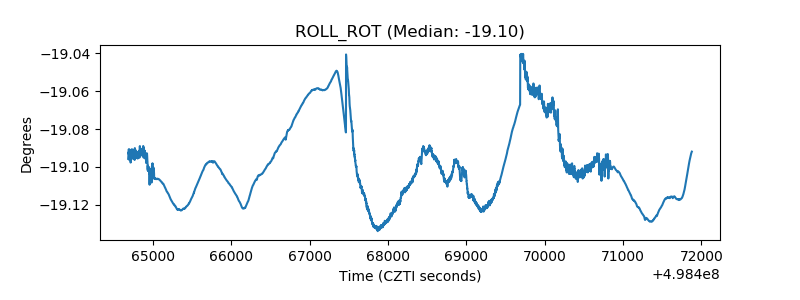 |
| _Roll_DEC | 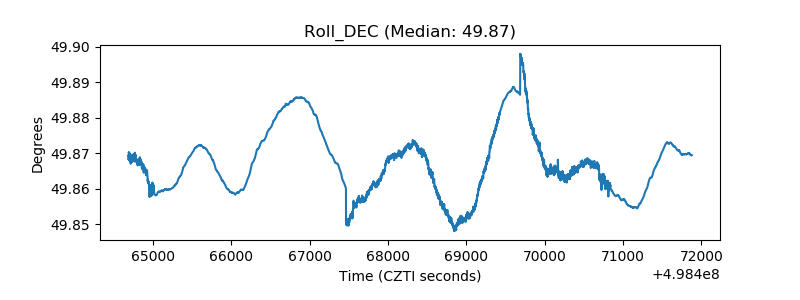 |
| _Roll_RA | 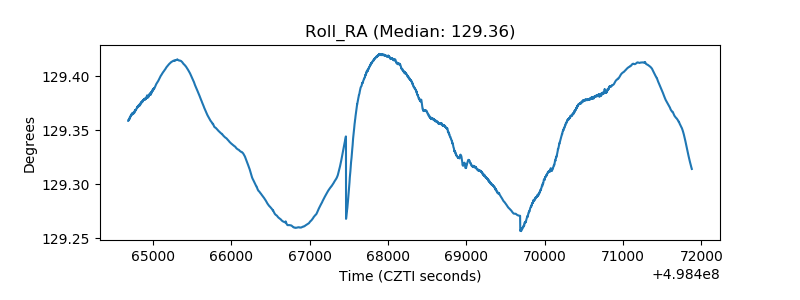 |
| Veto Counter | 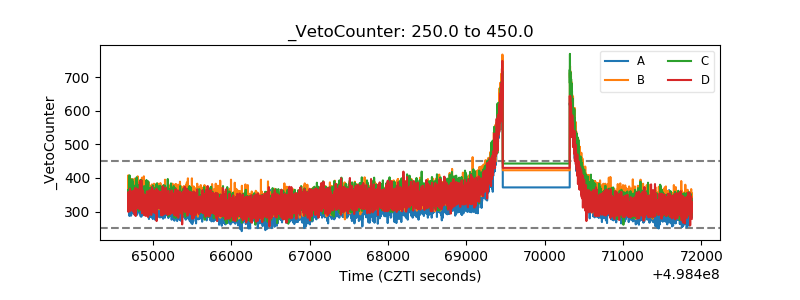 |