| Param | Original file | Final file |
|---|---|---|
| Filename | modeM0/AS1A14_126T19_9000006518_54404cztM0_level2.fits | modeM0/AS1A14_126T19_9000006518_54404cztM0_level2_quad_clean.evt |
| Size (bytes) | 875,255,040 | 86,659,200 |
| Size | 834.7 MB | 82.6 MB |
| Events in quadrant A | 3,374,039 | 691,683 |
| Events in quadrant B | 4,239,605 | 730,478 |
| Events in quadrant C | 8,580,648 | 487,564 |
| Events in quadrant D | 15,630,466 | 198,450 |
| Mode SS | |||
|---|---|---|---|
| Quadrant | BADHDUFLAG | Total packets | Discarded packets |
| A | 0 | 148 | 0 |
| B | 0 | 148 | 0 |
| C | 0 | 150 | 0 |
| D | 0 | 150 | 0 |
| Mode M0 | |||
|---|---|---|---|
| Quadrant | BADHDUFLAG | Total packets | Discarded packets |
| A | 0 | 15724 | 0 |
| B | 0 | 17784 | 0 |
| C | 0 | 30771 | 0 |
| D | 0 | 51489 | 0 |
| Quadrant | Total seconds | Saturated seconds | Saturation percentage |
|---|---|---|---|
| A | 7405 | 77 | 1.039838% |
| B | 7405 | 173 | 2.336259% |
| C | 7405 | 2025 | 27.346388% |
| D | 7405 | 5182 | 69.979743% |
Noise dominated data is calculated using 1-second bins in cleaned event files. If a bin has >2000 counts, and if more than 50% of those come from <1% of pixels, then it is considered to be noise-dominated and hence unusable.
| Quadrant | # 1 sec bins | Bins with >0 counts | Bins with >2000 counts | High rate bins dominated by noise | Noise dominated (total time) | Noise dominated (detector-on time) | Marked lightcurve |
|---|---|---|---|---|---|---|---|
| A | 7404 | 7404 | 61 | 61 | 0.82% | 0.82% | 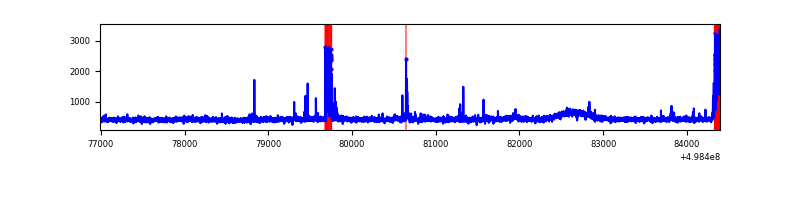 |
| B | 7405 | 7405 | 143 | 143 | 1.93% | 1.93% | 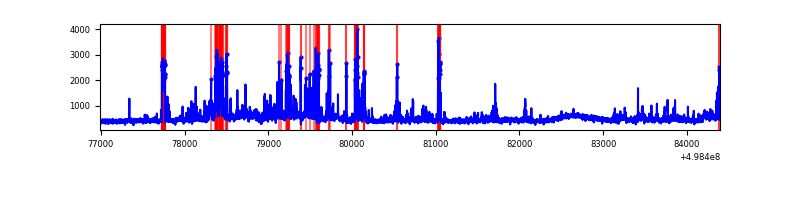 |
| C | 7405 | 7405 | 1968 | 1968 | 26.58% | 26.58% | 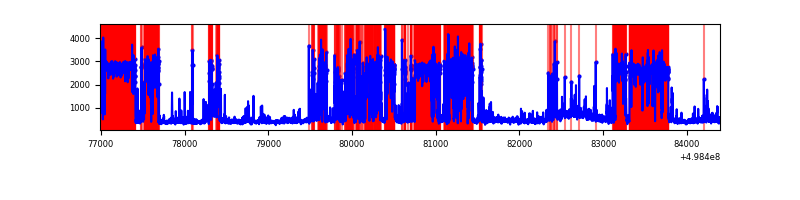 |
| D | 7404 | 7404 | 4974 | 4974 | 67.18% | 67.18% | 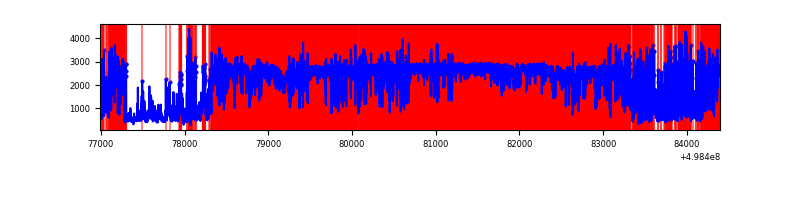 |
Top three noisy pixels from each quadrant. If the there are fewer than three noisy pixels in the level2.evt file, extra rows are filled as -1
| Pixel properties | Quadrant properties | ||||||
|---|---|---|---|---|---|---|---|
| Quadrant | DetID | PixID | Counts | Sigma | Mean | Median | Sigma |
| A | 5 | 243 | 142096 | 732.8 | 781 | 760 | 192.9 |
| A | 12 | 15 | 101934 | 524.57 | 781 | 760 | 192.9 |
| A | 4 | 3 | 36577 | 185.7 | 781 | 760 | 192.9 |
| B | 10 | 14 | 449405 | 2728.74 | 764 | 735 | 164.4 |
| B | 7 | 0 | 345300 | 2095.59 | 764 | 735 | 164.4 |
| B | 0 | 213 | 193614 | 1173.06 | 764 | 735 | 164.4 |
| C | 1 | 241 | 5435703 | 30562.74 | 653 | 647 | 177.8 |
| C | 13 | 3 | 167503 | 938.27 | 653 | 647 | 177.8 |
| C | 5 | 10 | 105365 | 588.86 | 653 | 647 | 177.8 |
| D | 8 | 176 | 12946620 | 107026.22 | 419 | 400 | 121.0 |
| D | 7 | 70 | 399502 | 3299.37 | 419 | 400 | 121.0 |
| D | 2 | 172 | 248922 | 2054.53 | 419 | 400 | 121.0 |
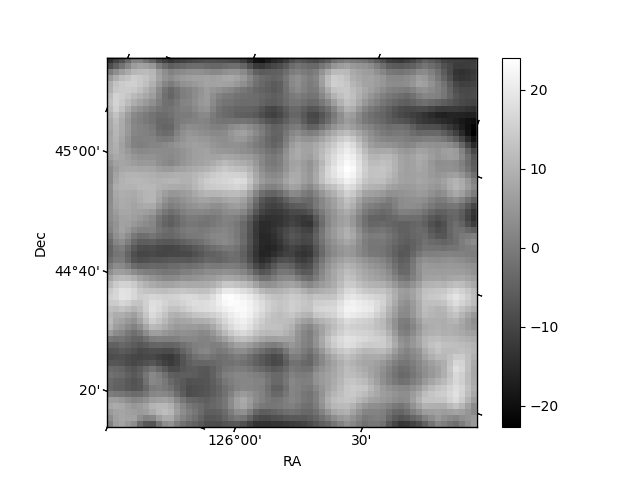
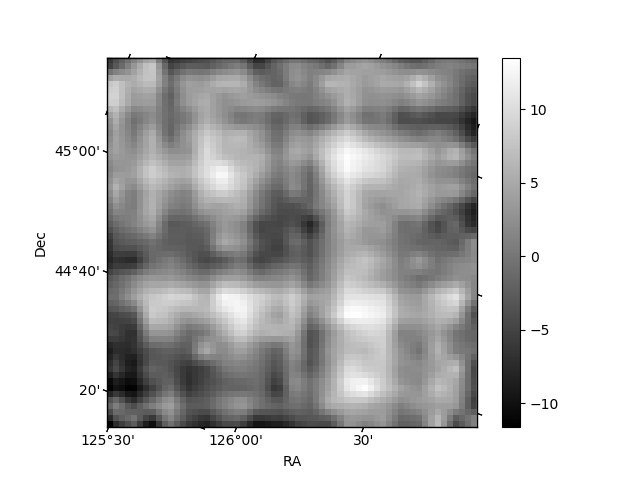
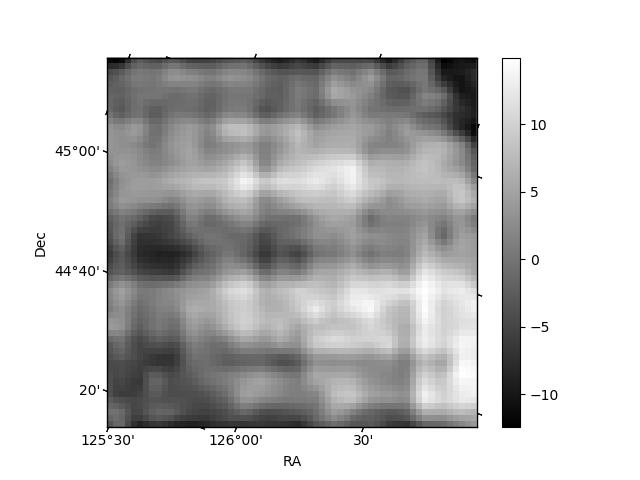
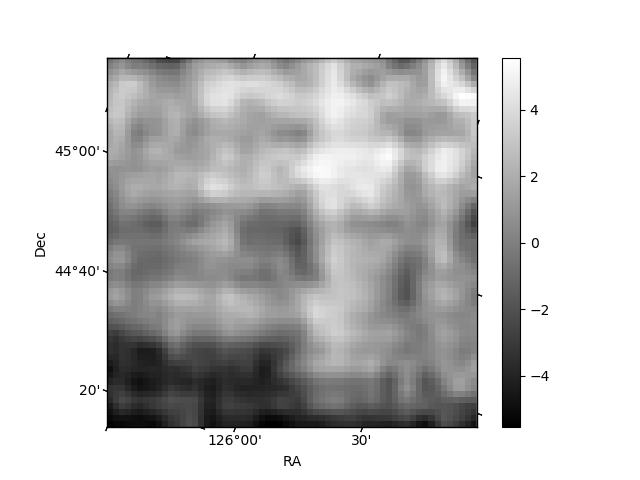
Histogram calculated using DETX and DETY for each event in the final _common_clean file
| Quadrant A | 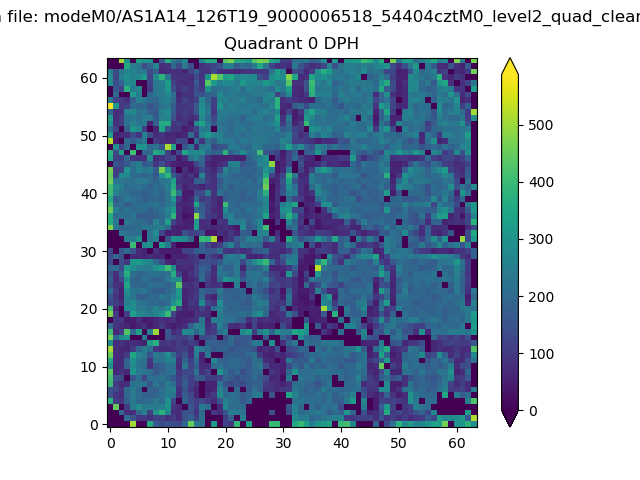 |
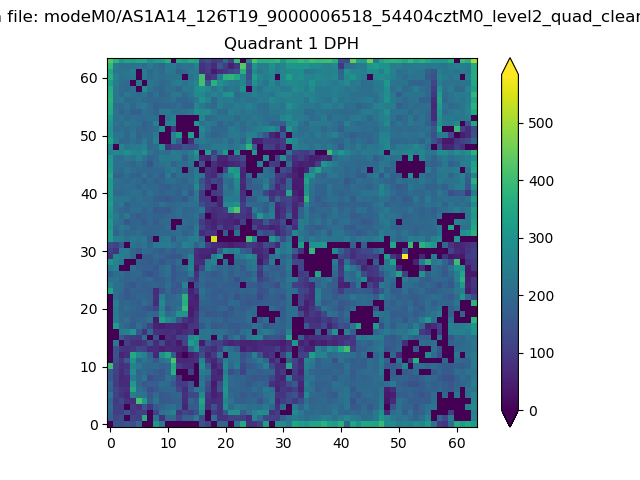 |
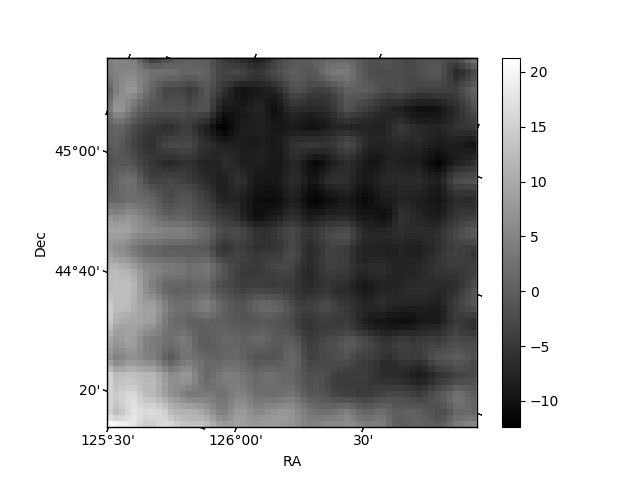
Quadrant B |
|---|---|---|---|
| Quadrant D | 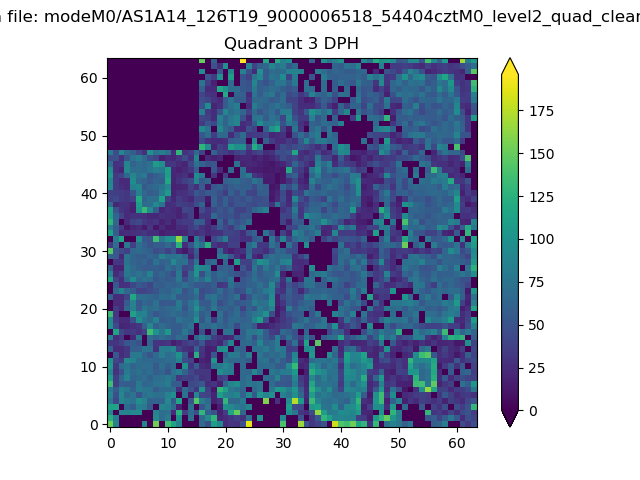 |
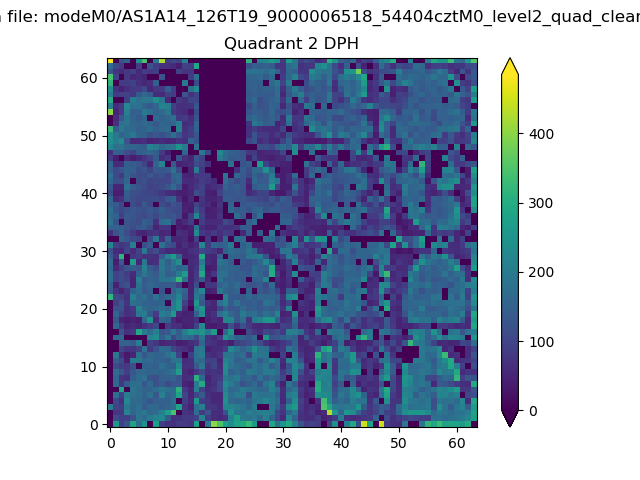 |
Quadrant C |
| Plot type | Count rate plots | Images |
|---|---|---|
| Comparison with Poisson distribution Blue bars denote a histogram of data divided into 1 sec bins. Red curve is a Poisson curve with rate = median count rate of data. |
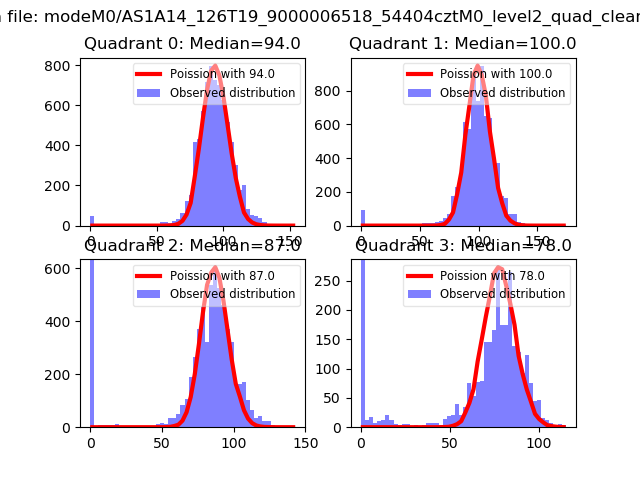 |
 |
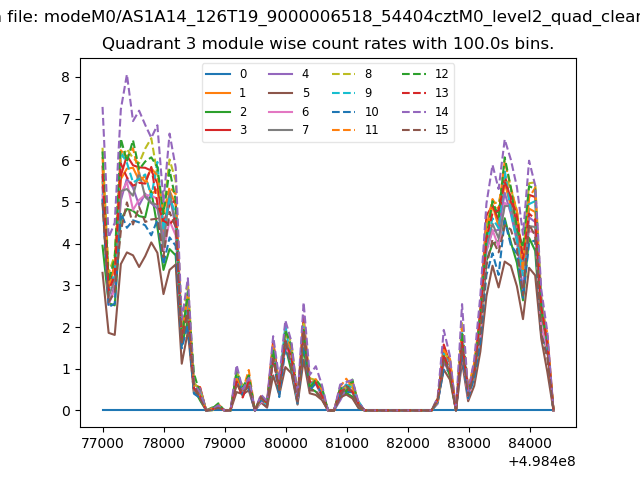
| Quadrant-wise count rates Data is divided into 100 sec bins |
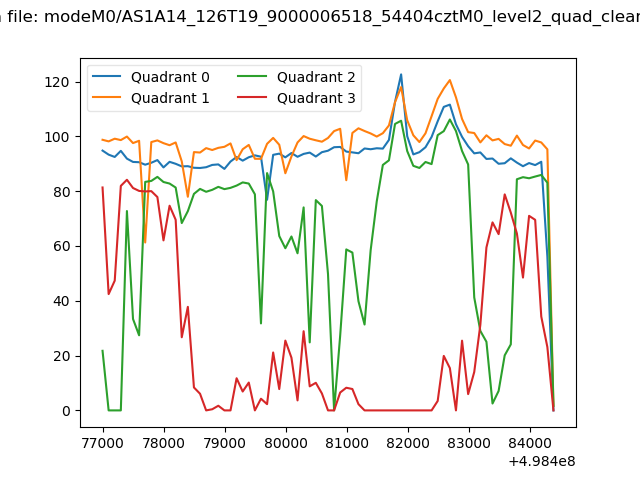 |
|
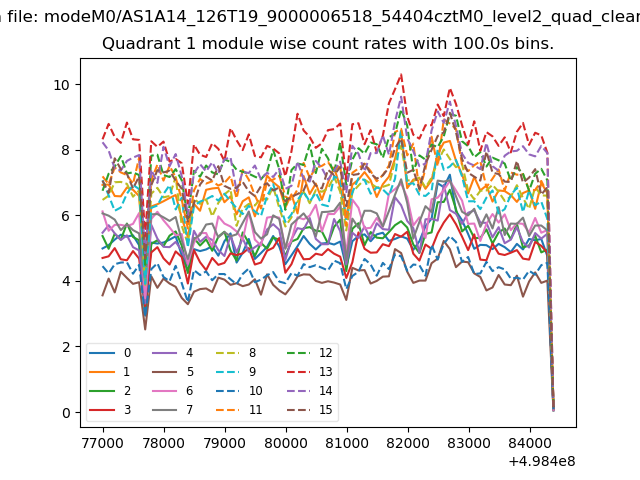
| Module-wise count rates for Quadrant A Data is divided into 100 sec bins |
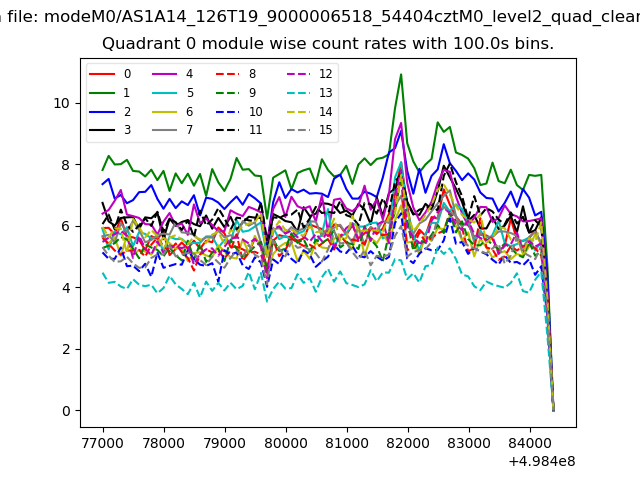 |
 |
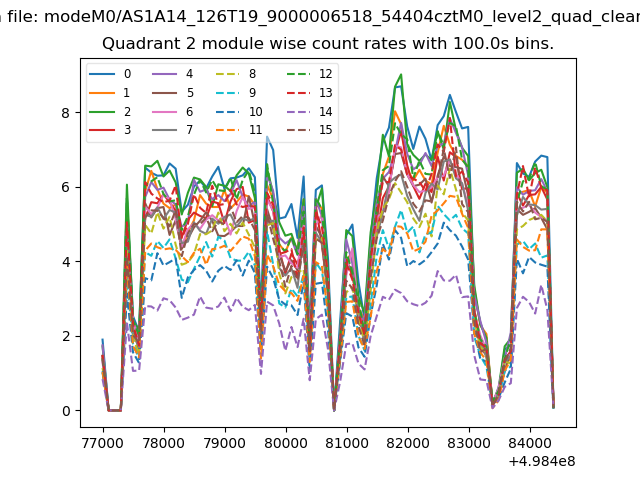
| Module-wise count rates for Quadrant B Data is divided into 100 sec bins |
 |
 |
| Module-wise count rates for Quadrant C Data is divided into 100 sec bins |
 |
 |
| Module-wise count rates for Quadrant D Data is divided into 100 sec bins |
 |
 |
| Parameter | Plot |
|---|---|
| CZT HV Monitor | 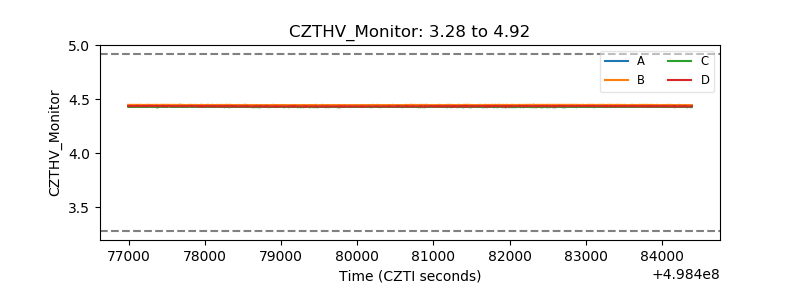 |
| D_VDD | 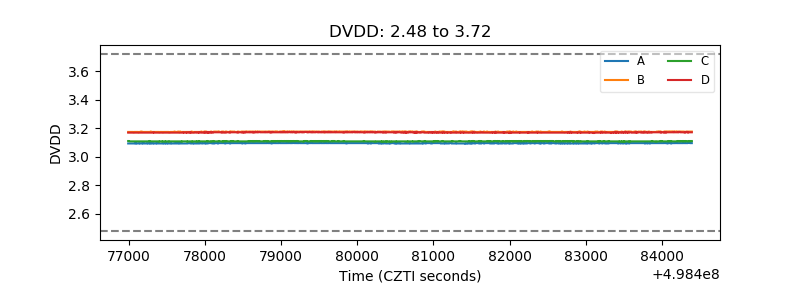 |
| Temperature 1 | 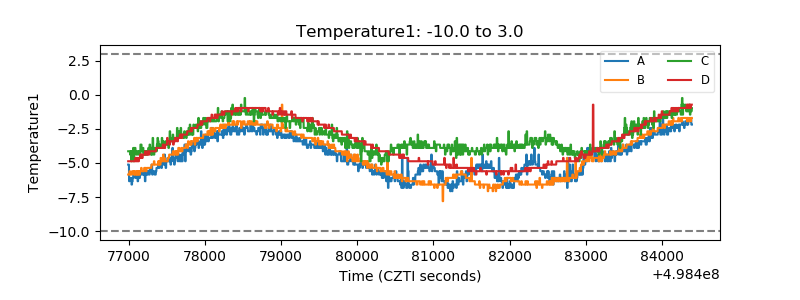 |
| Veto HV Monitor | 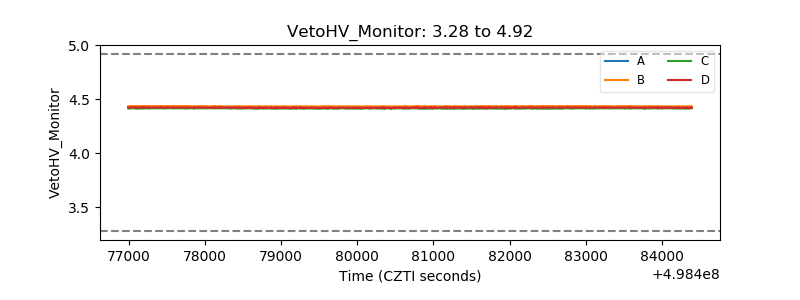 |
| Veto LLD | 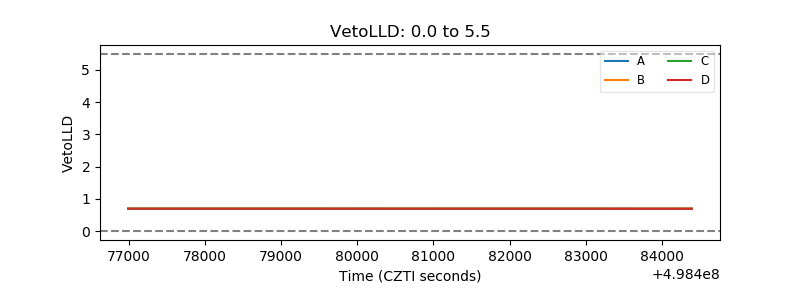 |
| Alpha Counter | 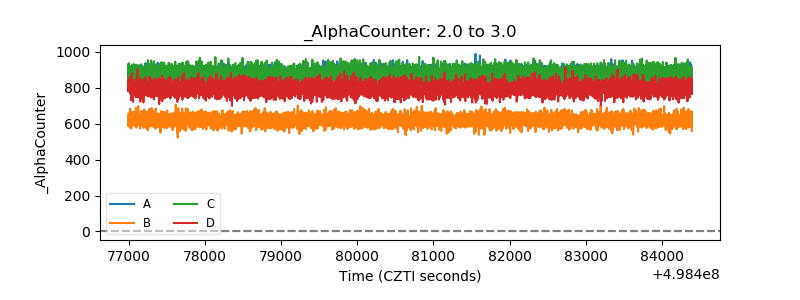 |
| _CPM_Rate | 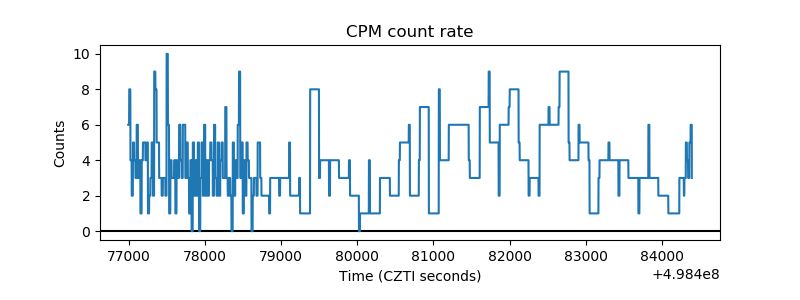 |
| CZT Counter | 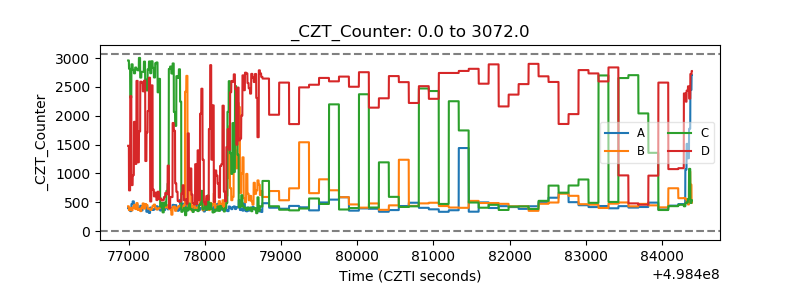 |
| +2.5 Volts monitor |  |
| +5 Volts monitor | 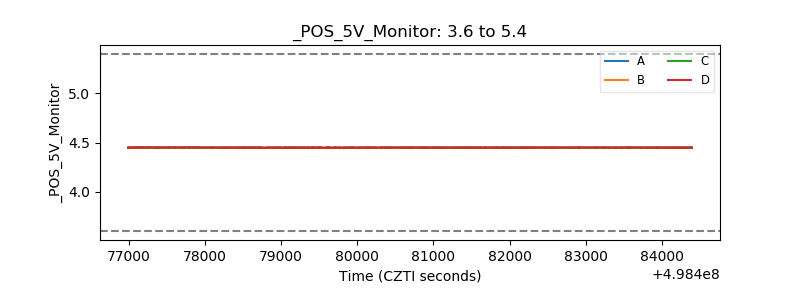 |
| _ROLL_ROT | 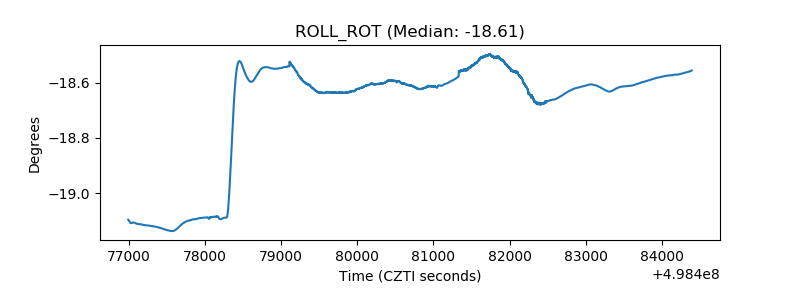 |
| _Roll_DEC | 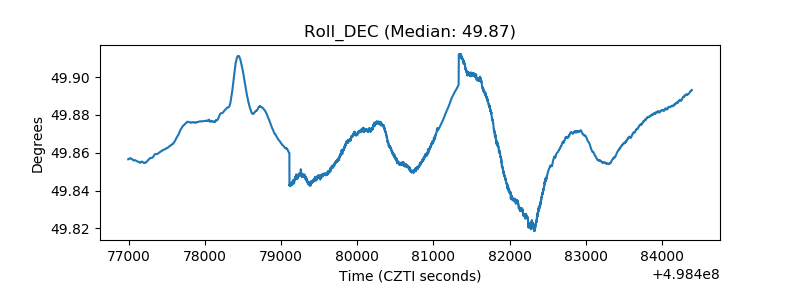 |
| _Roll_RA | 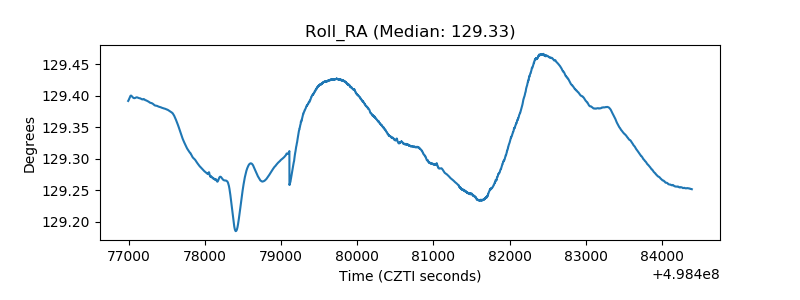 |
| Veto Counter | 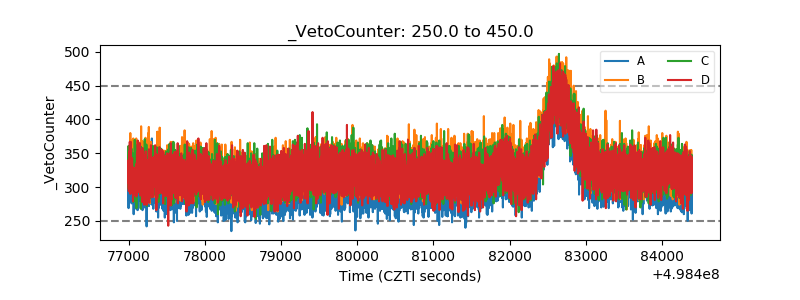 |