| Param | Original file | Final file |
|---|---|---|
| Filename | modeM0/AS1A14_126T19_9000006518_54405cztM0_level2.fits | modeM0/AS1A14_126T19_9000006518_54405cztM0_level2_quad_clean.evt |
| Size (bytes) | 923,515,200 | 88,778,880 |
| Size | 880.7 MB | 84.7 MB |
| Events in quadrant A | 3,583,230 | 685,485 |
| Events in quadrant B | 4,923,760 | 738,344 |
| Events in quadrant C | 8,514,872 | 514,393 |
| Events in quadrant D | 16,580,298 | 224,920 |
| Mode SS | |||
|---|---|---|---|
| Quadrant | BADHDUFLAG | Total packets | Discarded packets |
| A | 0 | 152 | 0 |
| B | 0 | 152 | 0 |
| C | 0 | 152 | 0 |
| D | 0 | 152 | 0 |
| Mode M0 | |||
|---|---|---|---|
| Quadrant | BADHDUFLAG | Total packets | Discarded packets |
| A | 0 | 16265 | 0 |
| B | 0 | 19786 | 0 |
| C | 0 | 30533 | 0 |
| D | 0 | 54440 | 0 |
| Quadrant | Total seconds | Saturated seconds | Saturation percentage |
|---|---|---|---|
| A | 7533 | 138 | 1.831939% |
| B | 7534 | 129 | 1.712238% |
| C | 7534 | 1803 | 23.931510% |
| D | 7534 | 5230 | 69.418636% |
Noise dominated data is calculated using 1-second bins in cleaned event files. If a bin has >2000 counts, and if more than 50% of those come from <1% of pixels, then it is considered to be noise-dominated and hence unusable.
| Quadrant | # 1 sec bins | Bins with >0 counts | Bins with >2000 counts | High rate bins dominated by noise | Noise dominated (total time) | Noise dominated (detector-on time) | Marked lightcurve |
|---|---|---|---|---|---|---|---|
| A | 7533 | 7533 | 125 | 125 | 1.66% | 1.66% | 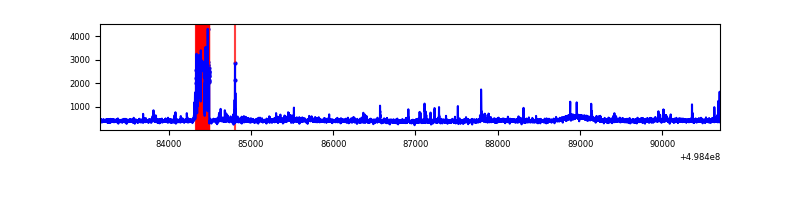 |
| B | 7534 | 7534 | 75 | 75 | 1.00% | 1.00% | 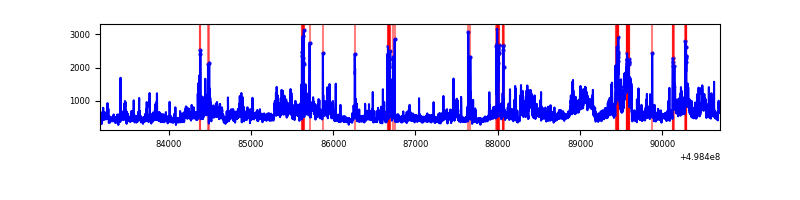 |
| C | 7533 | 7533 | 1750 | 1750 | 23.23% | 23.23% | 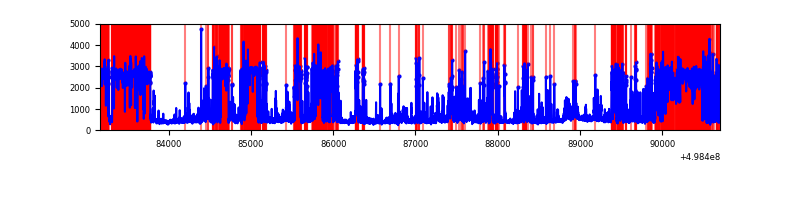 |
| D | 7533 | 7533 | 5193 | 5193 | 68.94% | 68.94% | 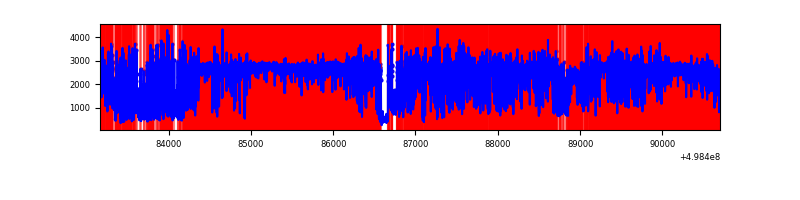 |
Top three noisy pixels from each quadrant. If the there are fewer than three noisy pixels in the level2.evt file, extra rows are filled as -1
| Pixel properties | Quadrant properties | ||||||
|---|---|---|---|---|---|---|---|
| Quadrant | DetID | PixID | Counts | Sigma | Mean | Median | Sigma |
| A | 5 | 243 | 384320 | 1970.29 | 785 | 763 | 194.7 |
| A | 7 | 221 | 42827 | 216.08 | 785 | 763 | 194.7 |
| A | 4 | 3 | 39362 | 198.28 | 785 | 763 | 194.7 |
| B | 7 | 0 | 1145206 | 6846.72 | 776 | 748 | 167.2 |
| B | 0 | 213 | 435358 | 2600.06 | 776 | 748 | 167.2 |
| B | 5 | 185 | 104857 | 622.83 | 776 | 748 | 167.2 |
| C | 1 | 241 | 4751332 | 25689.79 | 679 | 671 | 184.9 |
| C | 13 | 3 | 247880 | 1336.81 | 679 | 671 | 184.9 |
| C | 14 | 254 | 207019 | 1115.85 | 679 | 671 | 184.9 |
| D | 8 | 176 | 12663546 | 89009.64 | 495 | 472 | 142.3 |
| D | 2 | 172 | 819805 | 5759.15 | 495 | 472 | 142.3 |
| D | 15 | 108 | 537513 | 3774.9 | 495 | 472 | 142.3 |
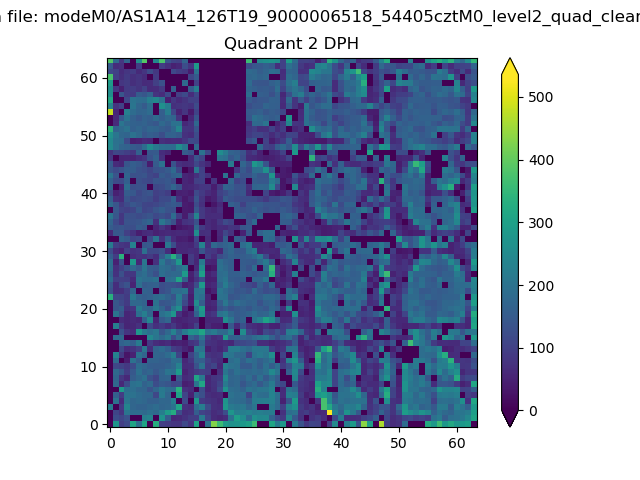
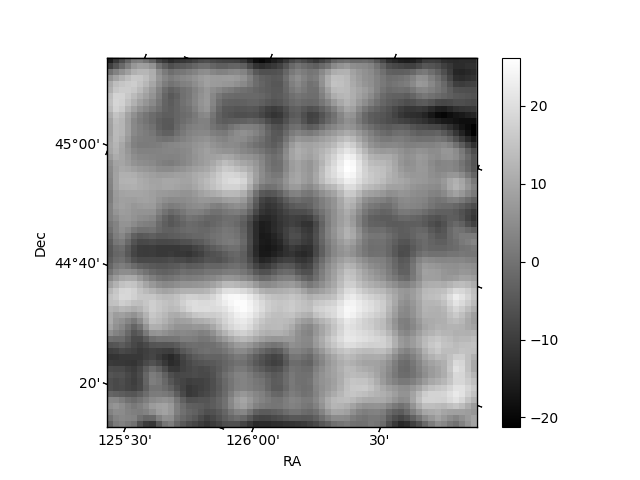
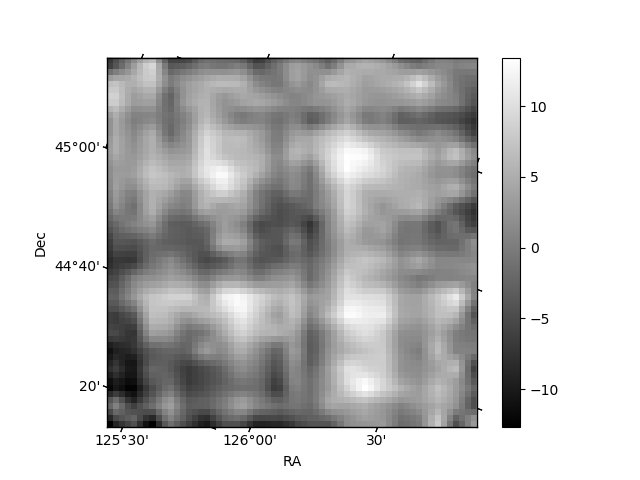
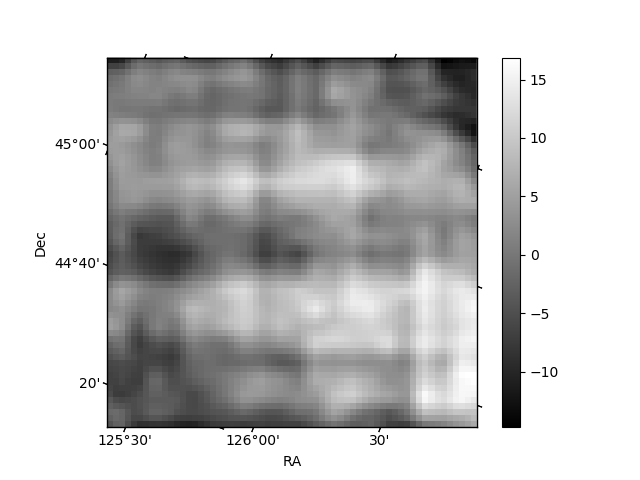
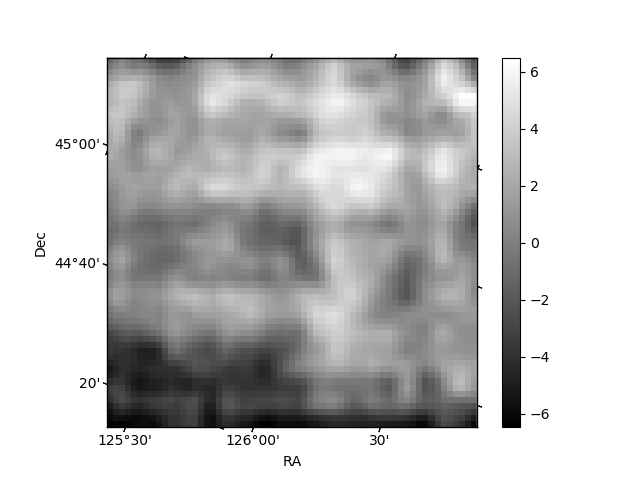
Histogram calculated using DETX and DETY for each event in the final _common_clean file
| Quadrant A | 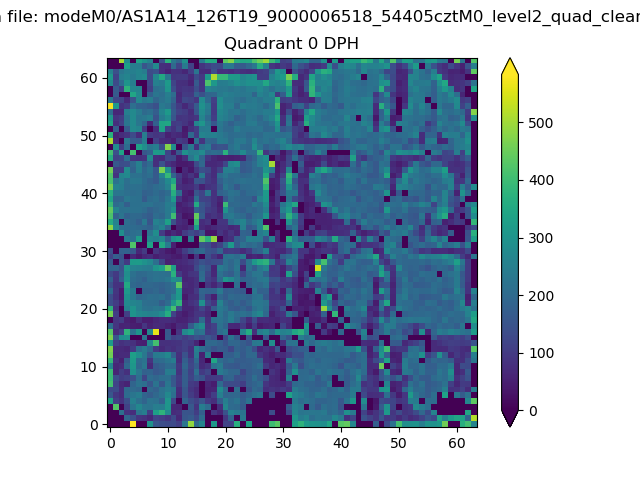 |
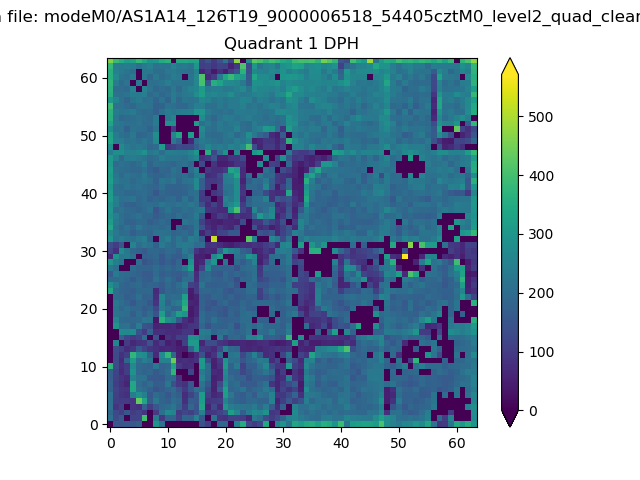 |
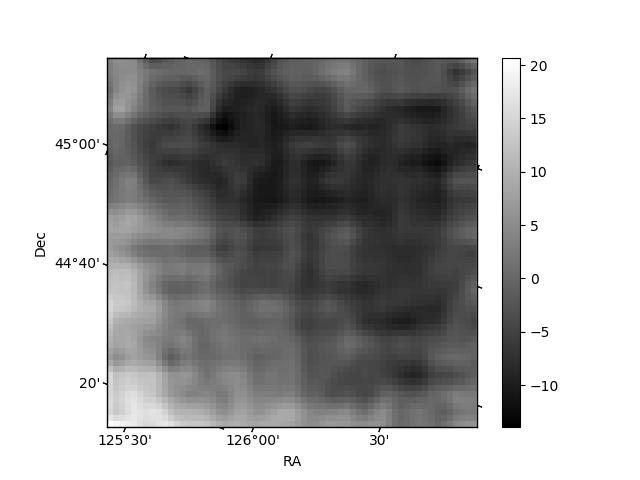
Quadrant B |
|---|---|---|---|
| Quadrant D | 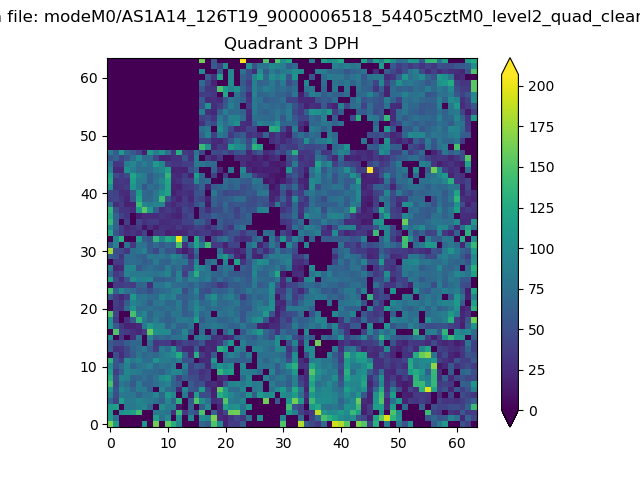 |
 |
Quadrant C |
| Plot type | Count rate plots | Images |
|---|---|---|
| Comparison with Poisson distribution Blue bars denote a histogram of data divided into 1 sec bins. Red curve is a Poisson curve with rate = median count rate of data. |
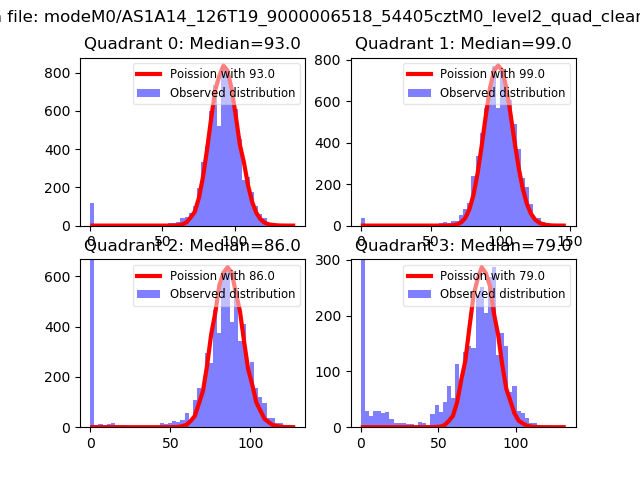 |
 |
| Quadrant-wise count rates Data is divided into 100 sec bins |
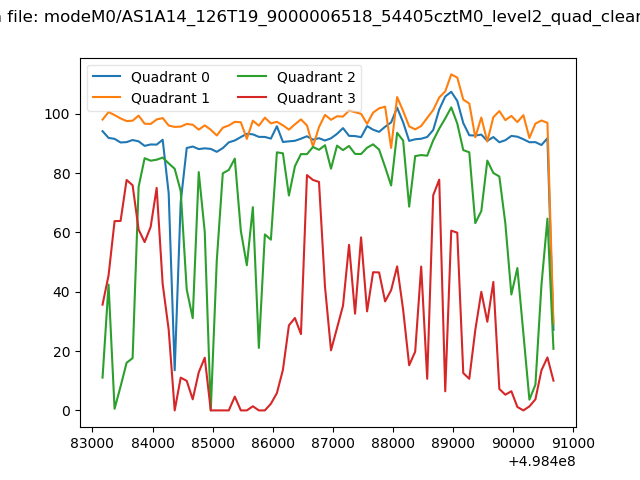 |
|
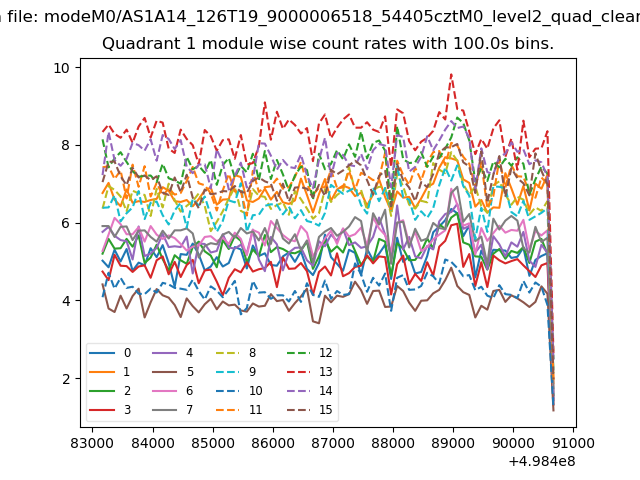
| Module-wise count rates for Quadrant A Data is divided into 100 sec bins |
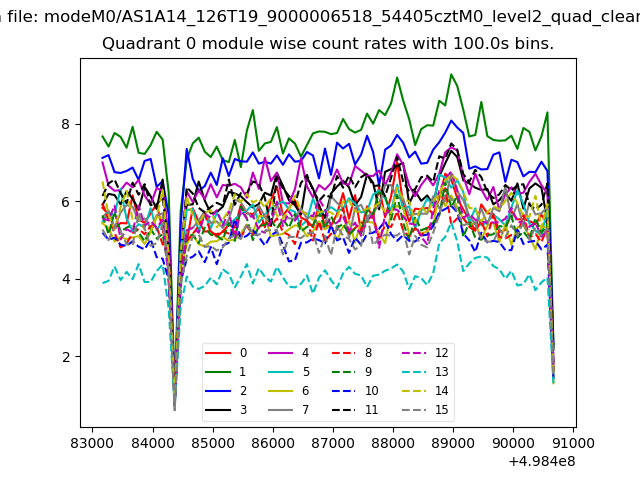 |
 |
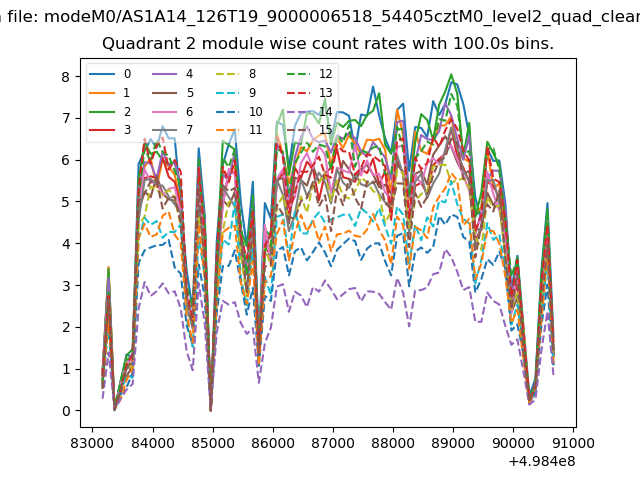
| Module-wise count rates for Quadrant B Data is divided into 100 sec bins |
 |
 |
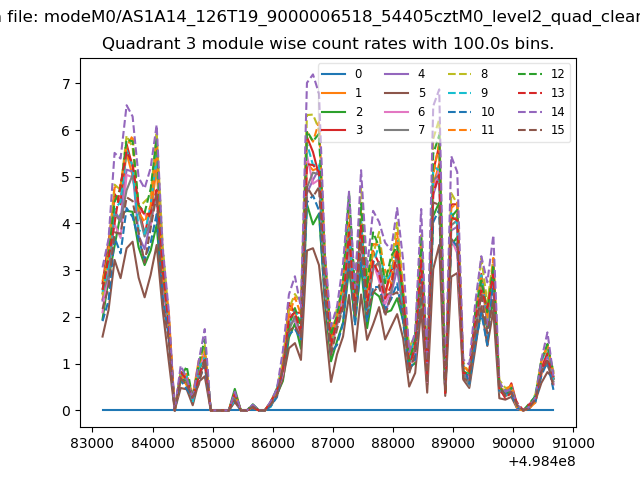
| Module-wise count rates for Quadrant C Data is divided into 100 sec bins |
 |
 |
| Module-wise count rates for Quadrant D Data is divided into 100 sec bins |
 |
 |
| Parameter | Plot |
|---|---|
| CZT HV Monitor | 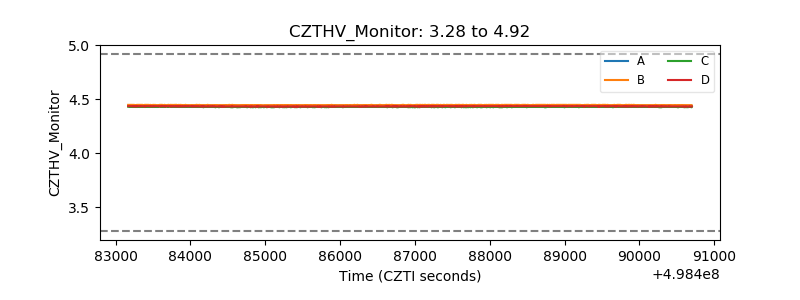 |
| D_VDD | 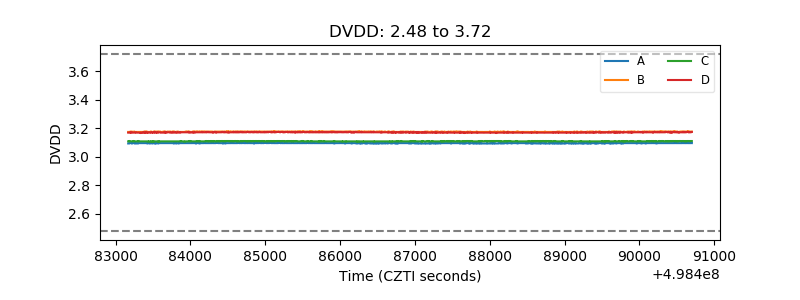 |
| Temperature 1 | 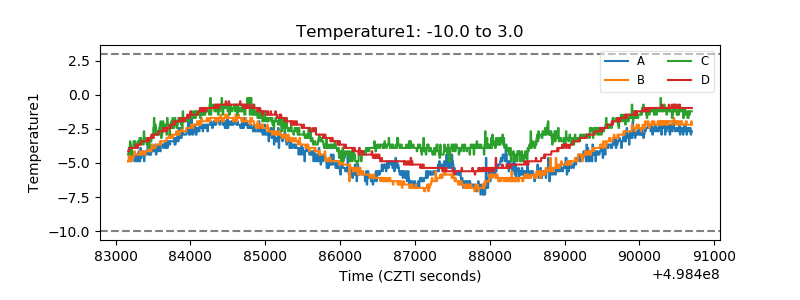 |
| Veto HV Monitor | 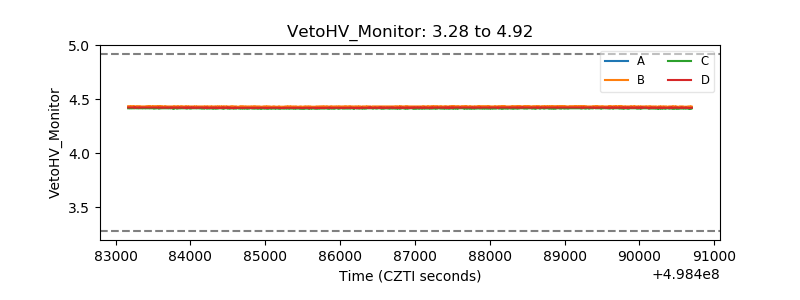 |
| Veto LLD | 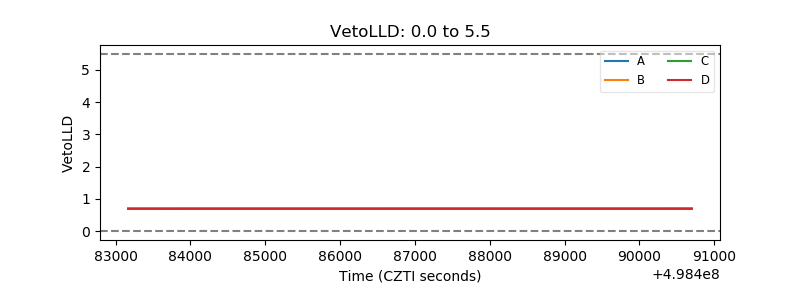 |
| Alpha Counter | 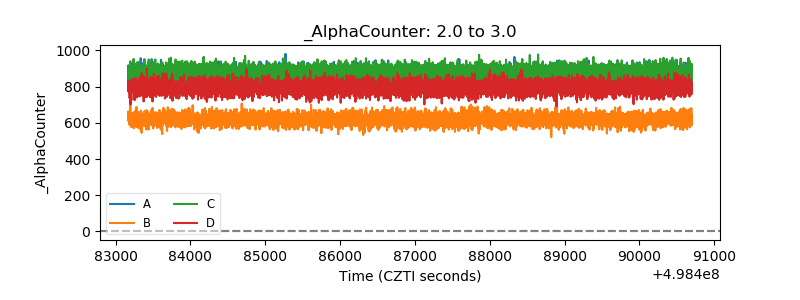 |
| _CPM_Rate | 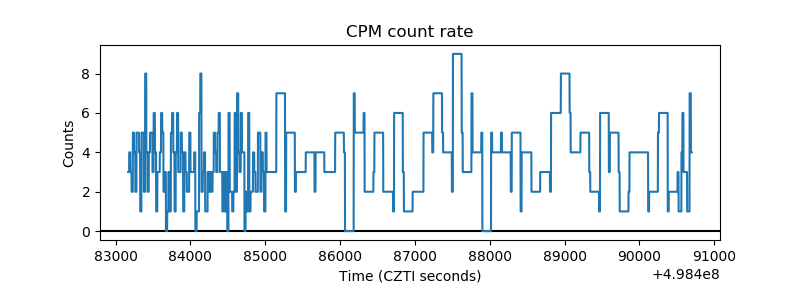 |
| CZT Counter | 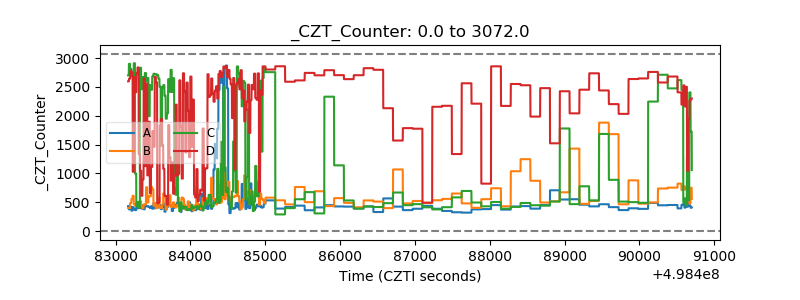 |
| +2.5 Volts monitor |  |
| +5 Volts monitor |  |
| _ROLL_ROT | 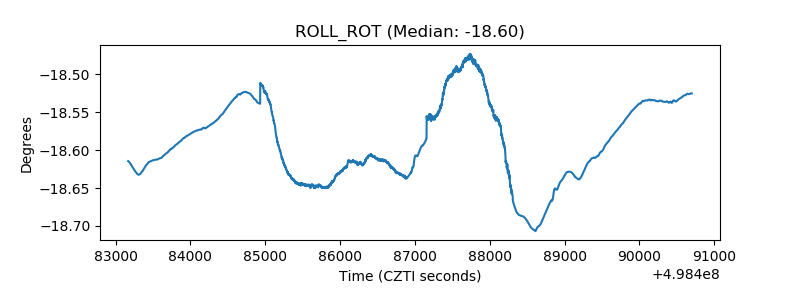 |
| _Roll_DEC | 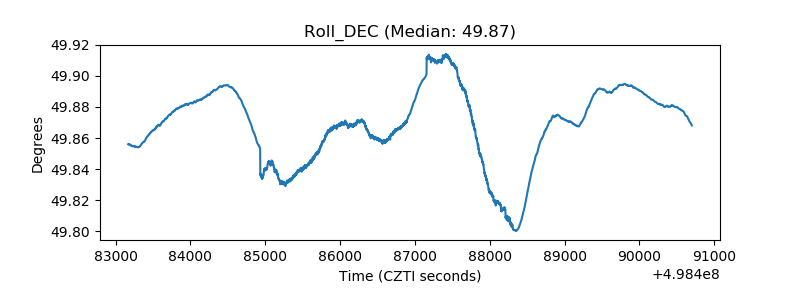 |
| _Roll_RA | 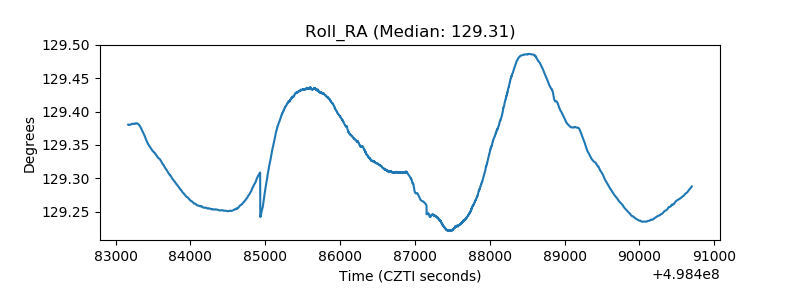 |
| Veto Counter | 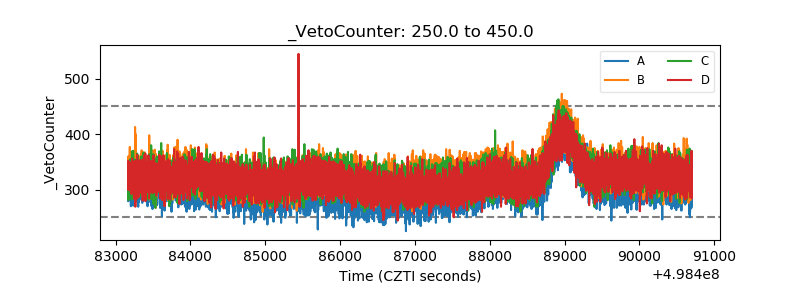 |