| Param | Original file | Final file |
|---|---|---|
| Filename | modeM0/AS1A14_126T19_9000006518_54409cztM0_level2.fits | modeM0/AS1A14_126T19_9000006518_54409cztM0_level2_quad_clean.evt |
| Size (bytes) | 2,592,624,960 | 301,708,800 |
| Size | 2.4 GB | 287.7 MB |
| Events in quadrant A | 11,439,884 | 2,315,930 |
| Events in quadrant B | 12,646,907 | 2,441,834 |
| Events in quadrant C | 25,166,033 | 1,635,696 |
| Events in quadrant D | 44,800,200 | 1,033,022 |
| Mode SS | |||
|---|---|---|---|
| Quadrant | BADHDUFLAG | Total packets | Discarded packets |
| A | 0 | 500 | 0 |
| B | 0 | 500 | 0 |
| C | 0 | 500 | 0 |
| D | 0 | 500 | 0 |
| Mode M0 | |||
|---|---|---|---|
| Quadrant | BADHDUFLAG | Total packets | Discarded packets |
| A | 0 | 52694 | 3 |
| B | 0 | 55823 | 3 |
| C | 0 | 92667 | 3 |
| D | 0 | 150219 | 3 |
| Mode M9 | |||
|---|---|---|---|
| Quadrant | BADHDUFLAG | Total packets | Discarded packets |
| A | 0 | 16 | 0 |
| B | 0 | 16 | 0 |
| C | 0 | 16 | 0 |
| D | 0 | 16 | 0 |
| Quadrant | Total seconds | Saturated seconds | Saturation percentage |
|---|---|---|---|
| A | 24825 | 282 | 1.135952% |
| B | 24825 | 533 | 2.147029% |
| C | 24826 | 5478 | 22.065576% |
| D | 24826 | 12486 | 50.294047% |
Noise dominated data is calculated using 1-second bins in cleaned event files. If a bin has >2000 counts, and if more than 50% of those come from <1% of pixels, then it is considered to be noise-dominated and hence unusable.
| Quadrant | # 1 sec bins | Bins with >0 counts | Bins with >2000 counts | High rate bins dominated by noise | Noise dominated (total time) | Noise dominated (detector-on time) | Marked lightcurve |
|---|---|---|---|---|---|---|---|
| A | 26315 | 24826 | 31 | 31 | 0.12% | 0.12% | 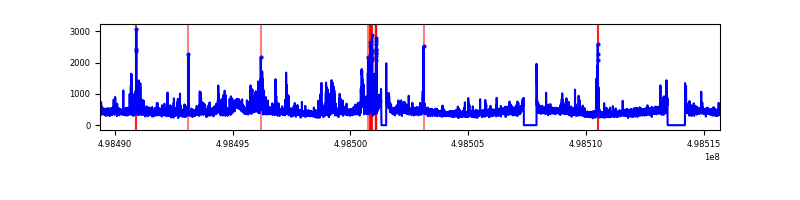 |
| B | 26315 | 24826 | 165 | 165 | 0.63% | 0.66% | 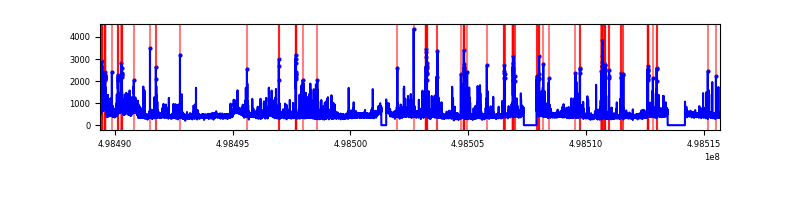 |
| C | 26316 | 24826 | 5267 | 5267 | 20.01% | 21.22% | 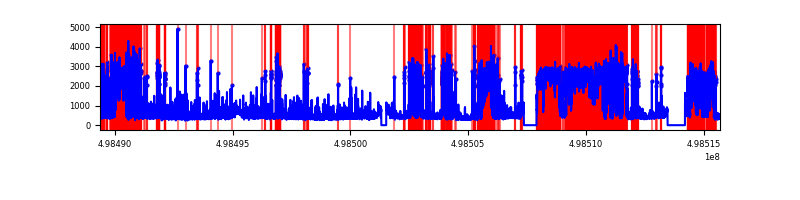 |
| D | 26316 | 24826 | 12304 | 12304 | 46.75% | 49.56% | 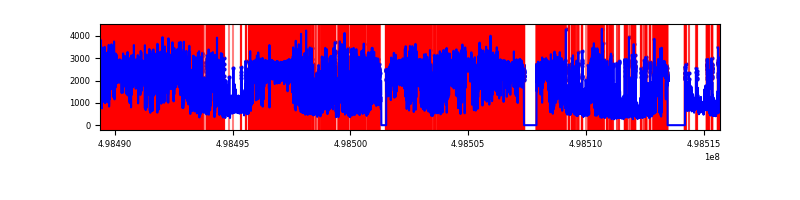 |
Top three noisy pixels from each quadrant. If the there are fewer than three noisy pixels in the level2.evt file, extra rows are filled as -1
| Pixel properties | Quadrant properties | ||||||
|---|---|---|---|---|---|---|---|
| Quadrant | DetID | PixID | Counts | Sigma | Mean | Median | Sigma |
| A | 7 | 206 | 633333 | 962.79 | 2657 | 2590 | 655.1 |
| A | 4 | 61 | 143912 | 215.72 | 2657 | 2590 | 655.1 |
| A | 0 | 8 | 125966 | 188.33 | 2657 | 2590 | 655.1 |
| B | 0 | 213 | 824012 | 1469.76 | 2607 | 2501 | 558.9 |
| B | 7 | 0 | 538812 | 959.51 | 2607 | 2501 | 558.9 |
| B | 10 | 247 | 359902 | 639.43 | 2607 | 2501 | 558.9 |
| C | 1 | 241 | 12242275 | 19451.95 | 2308 | 2284 | 629.2 |
| C | 13 | 3 | 826826 | 1310.37 | 2308 | 2284 | 629.2 |
| C | 4 | 5 | 598815 | 948.01 | 2308 | 2284 | 629.2 |
| D | 8 | 176 | 24325735 | 45300.86 | 1884 | 1798 | 536.9 |
| D | 15 | 108 | 7142210 | 13298.29 | 1884 | 1798 | 536.9 |
| D | 2 | 172 | 2886152 | 5371.82 | 1884 | 1798 | 536.9 |
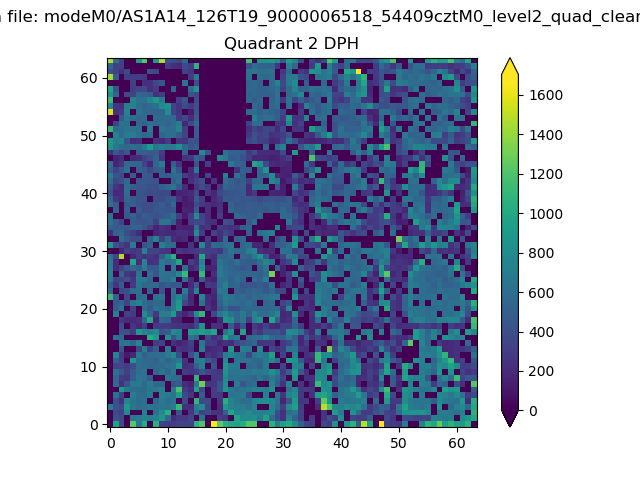
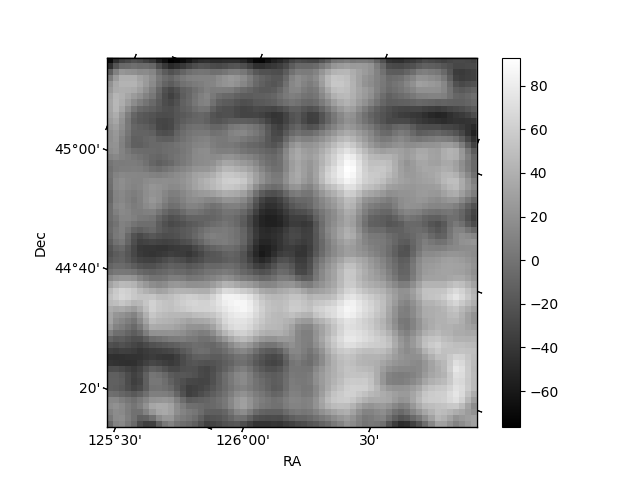
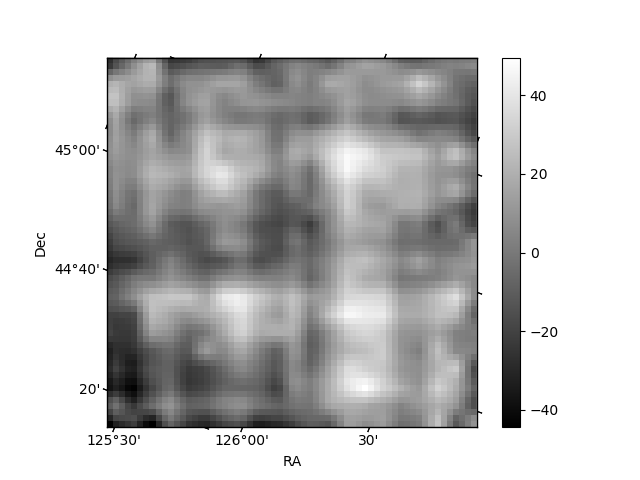
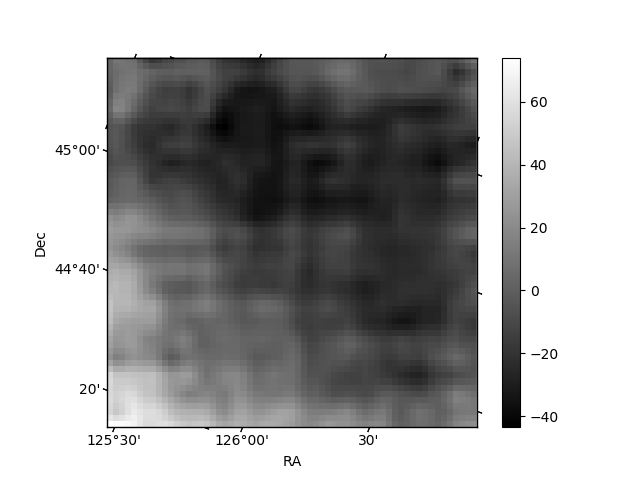
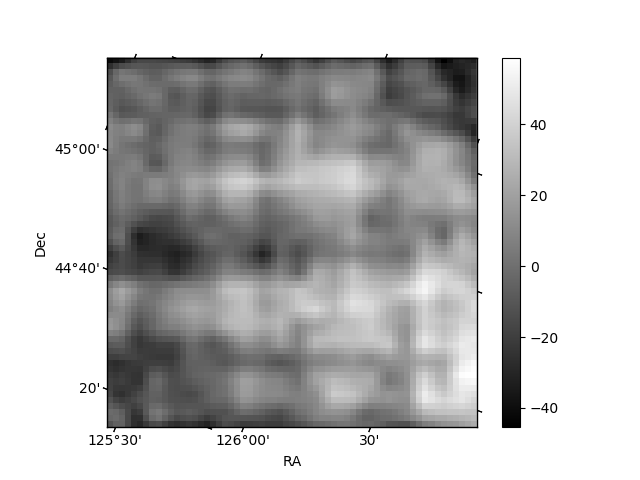
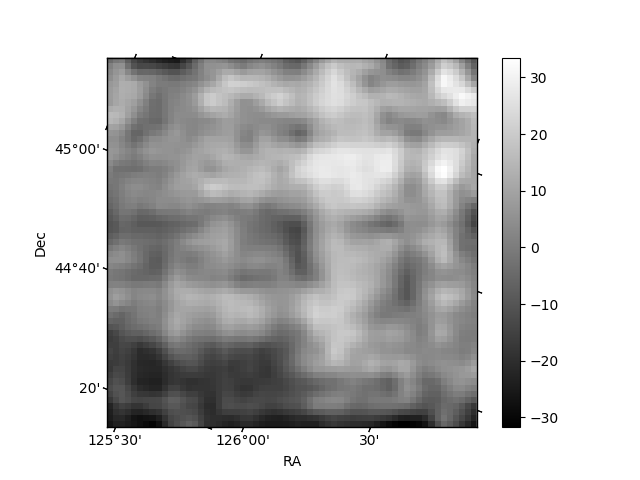
Histogram calculated using DETX and DETY for each event in the final _common_clean file
| Quadrant A | 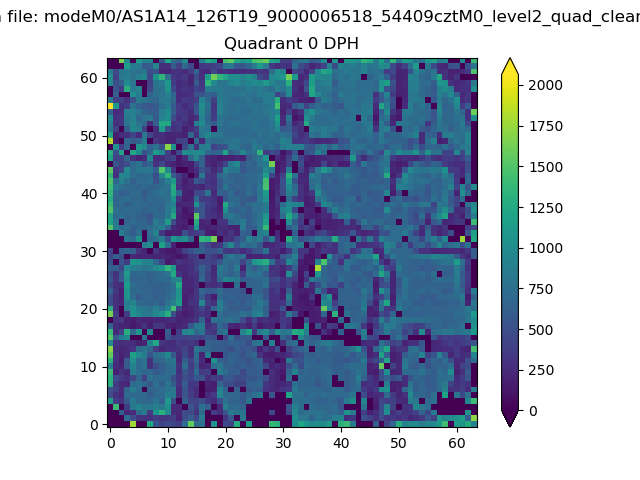 |
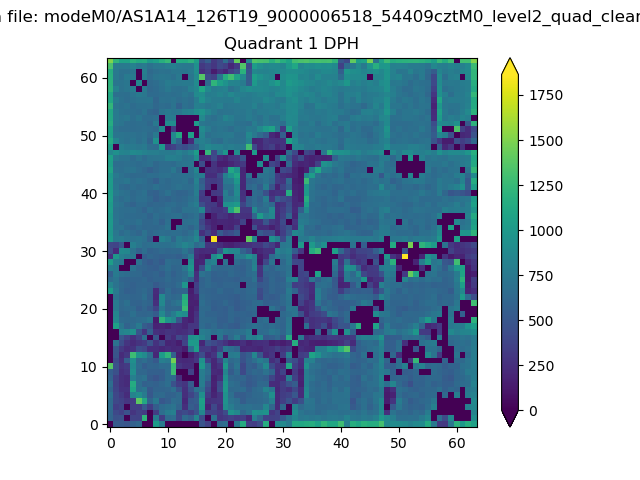 |
Quadrant B |
|---|---|---|---|
| Quadrant D | 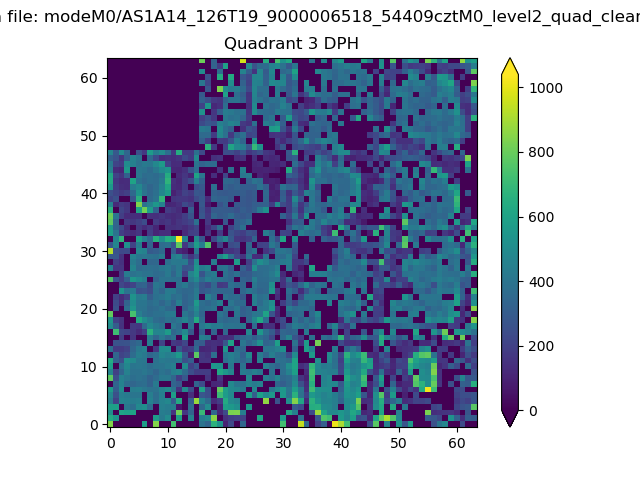 |
 |
Quadrant C |
| Plot type | Count rate plots | Images |
|---|---|---|
| Comparison with Poisson distribution Blue bars denote a histogram of data divided into 1 sec bins. Red curve is a Poisson curve with rate = median count rate of data. |
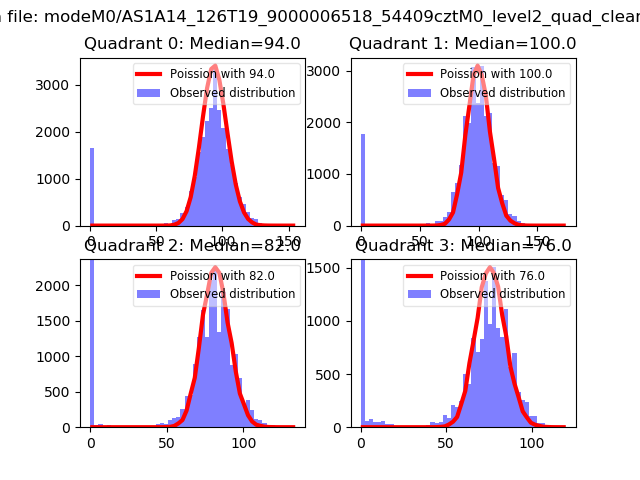 |
 |
| Quadrant-wise count rates Data is divided into 100 sec bins |
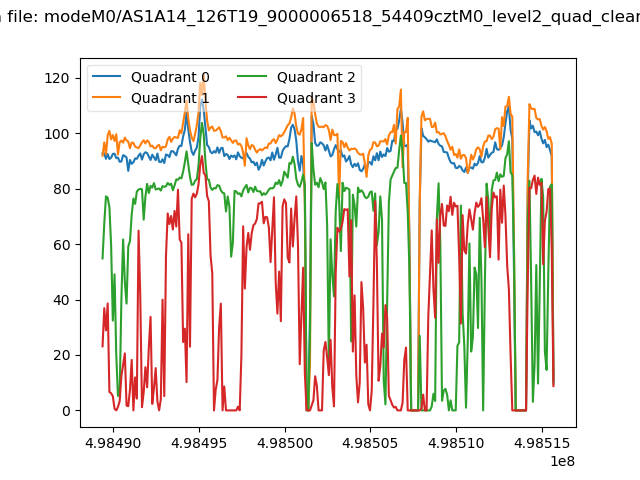 |
|
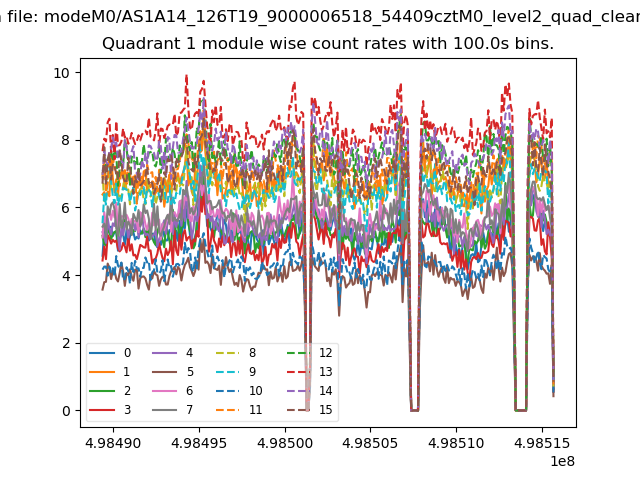
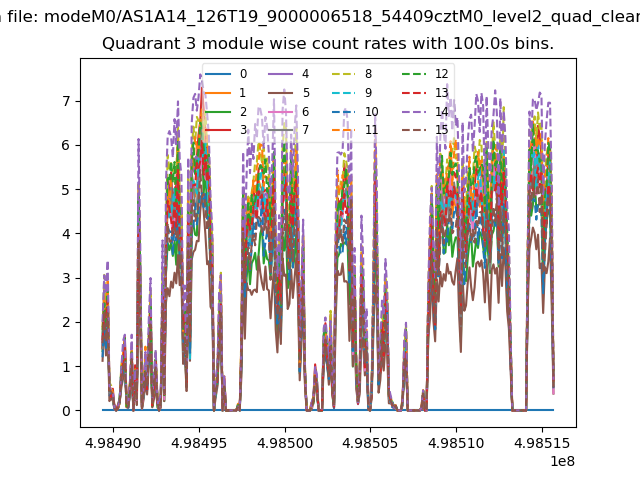
| Module-wise count rates for Quadrant A Data is divided into 100 sec bins |
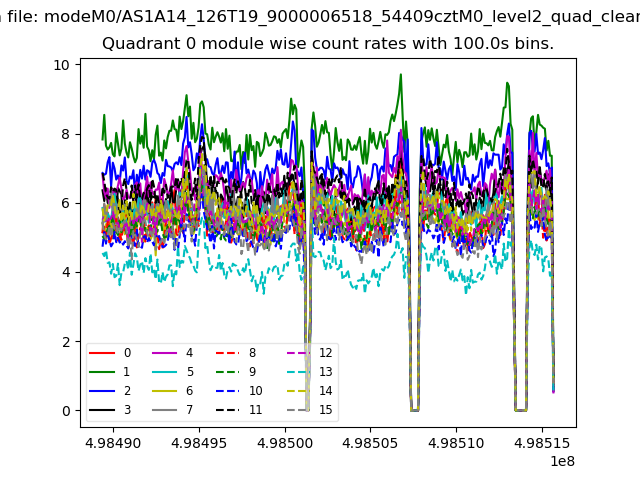 |
 |
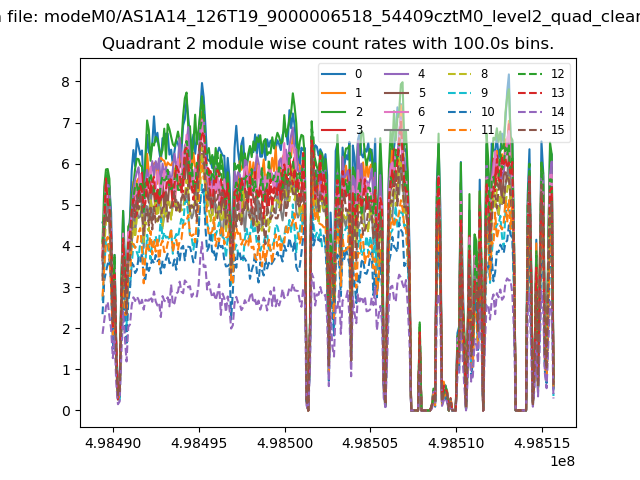
| Module-wise count rates for Quadrant B Data is divided into 100 sec bins |
 |
 |
| Module-wise count rates for Quadrant C Data is divided into 100 sec bins |
 |
 |
| Module-wise count rates for Quadrant D Data is divided into 100 sec bins |
 |
 |
| Parameter | Plot |
|---|---|
| CZT HV Monitor | 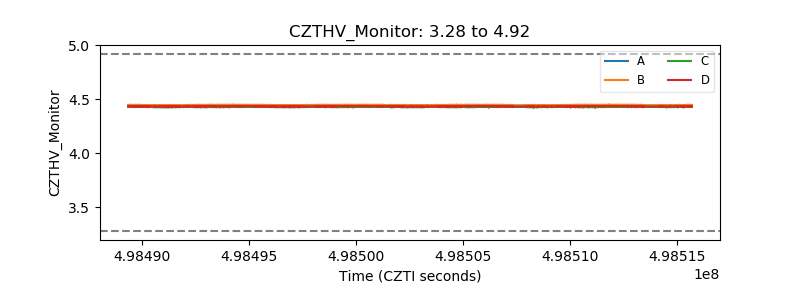 |
| D_VDD | 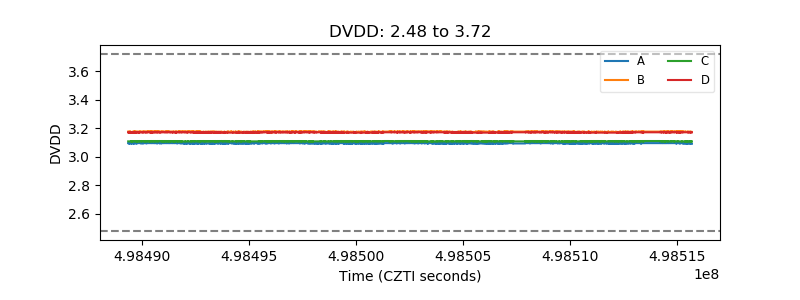 |
| Temperature 1 | 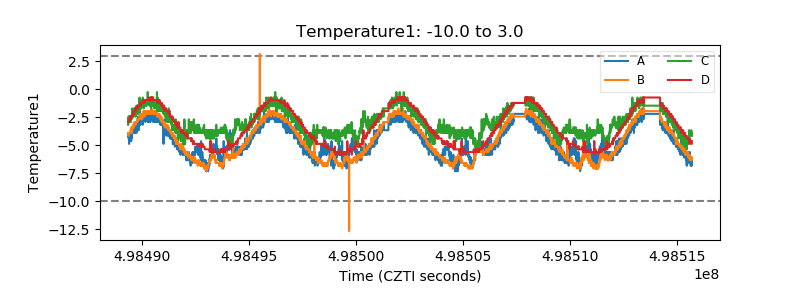 |
| Veto HV Monitor | 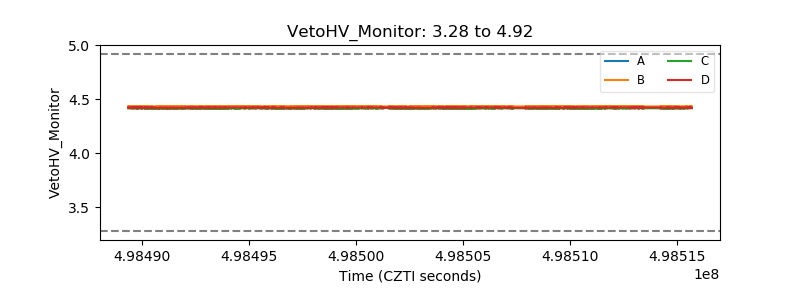 |
| Veto LLD | 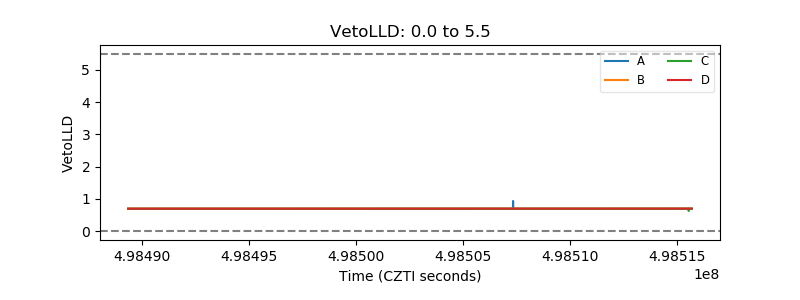 |
| Alpha Counter | 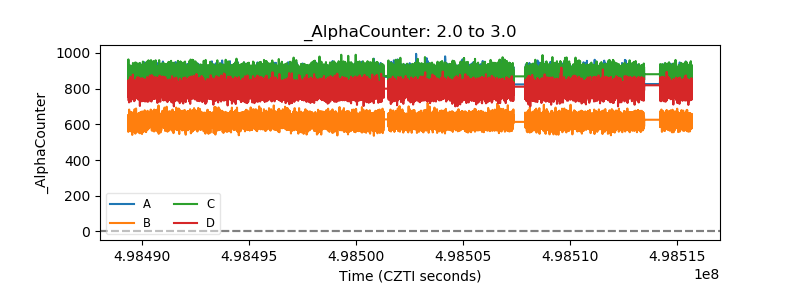 |
| _CPM_Rate | 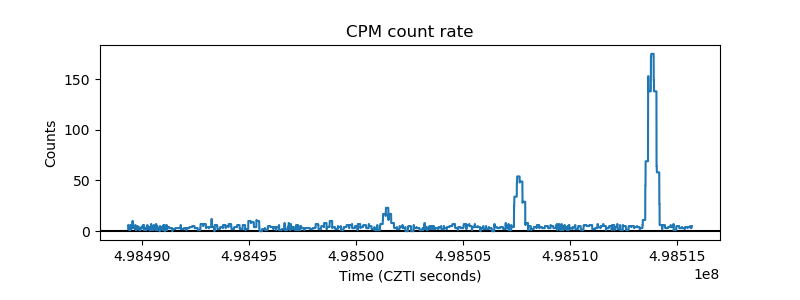 |
| CZT Counter | 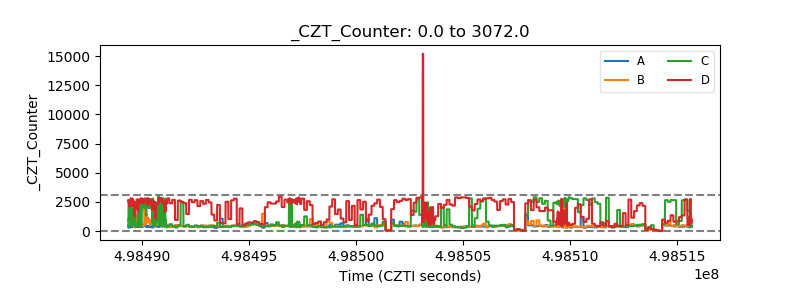 |
| +2.5 Volts monitor |  |
| +5 Volts monitor |  |
| _ROLL_ROT | 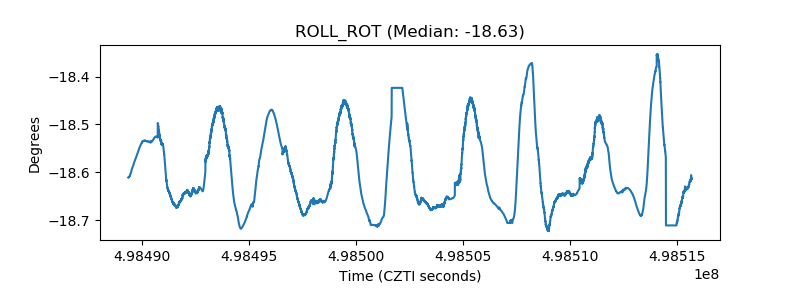 |
| _Roll_DEC | 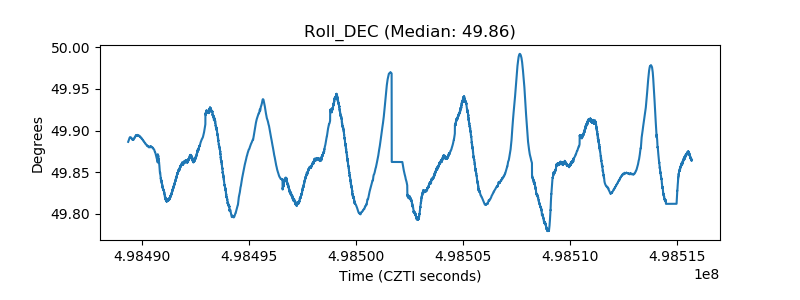 |
| _Roll_RA | 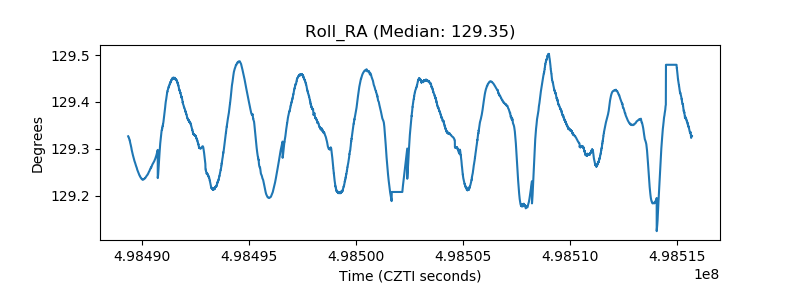 |
| Veto Counter | 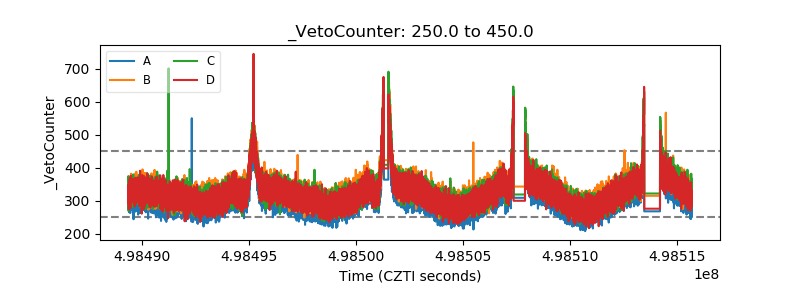 |