| Param | Original file | Final file |
|---|---|---|
| Filename | modeM0/AS1A14_126T19_9000006518_54410cztM0_level2.fits | modeM0/AS1A14_126T19_9000006518_54410cztM0_level2_quad_clean.evt |
| Size (bytes) | 540,394,560 | 94,199,040 |
| Size | 515.4 MB | 89.8 MB |
| Events in quadrant A | 2,923,038 | 669,471 |
| Events in quadrant B | 3,069,954 | 696,273 |
| Events in quadrant C | 6,319,142 | 497,294 |
| Events in quadrant D | 7,170,166 | 521,618 |
| Mode SS | |||
|---|---|---|---|
| Quadrant | BADHDUFLAG | Total packets | Discarded packets |
| A | 0 | 136 | 0 |
| B | 0 | 136 | 0 |
| C | 0 | 136 | 0 |
| D | 0 | 136 | 0 |
| Mode M0 | |||
|---|---|---|---|
| Quadrant | BADHDUFLAG | Total packets | Discarded packets |
| A | 0 | 13947 | 1 |
| B | 0 | 14124 | 1 |
| C | 0 | 23796 | 1 |
| D | 0 | 26082 | 1 |
| Mode M9 | |||
|---|---|---|---|
| Quadrant | BADHDUFLAG | Total packets | Discarded packets |
| A | 0 | 9 | 0 |
| B | 0 | 9 | 0 |
| C | 0 | 9 | 0 |
| D | 0 | 9 | 0 |
| Quadrant | Total seconds | Saturated seconds | Saturation percentage |
|---|---|---|---|
| A | 6708 | 36 | 0.536673% |
| B | 6708 | 46 | 0.685748% |
| C | 6708 | 1433 | 21.362552% |
| D | 6708 | 992 | 14.788312% |
Noise dominated data is calculated using 1-second bins in cleaned event files. If a bin has >2000 counts, and if more than 50% of those come from <1% of pixels, then it is considered to be noise-dominated and hence unusable.
| Quadrant | # 1 sec bins | Bins with >0 counts | Bins with >2000 counts | High rate bins dominated by noise | Noise dominated (total time) | Noise dominated (detector-on time) | Marked lightcurve |
|---|---|---|---|---|---|---|---|
| A | 7593 | 6708 | 6 | 6 | 0.08% | 0.09% | 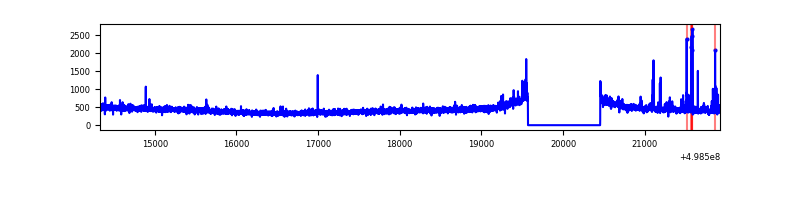 |
| B | 7593 | 6708 | 8 | 8 | 0.11% | 0.12% | 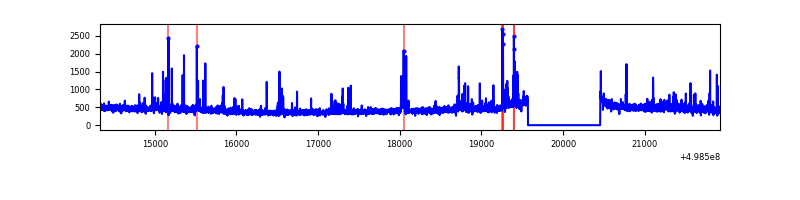 |
| C | 7593 | 6708 | 1360 | 1360 | 17.91% | 20.27% | 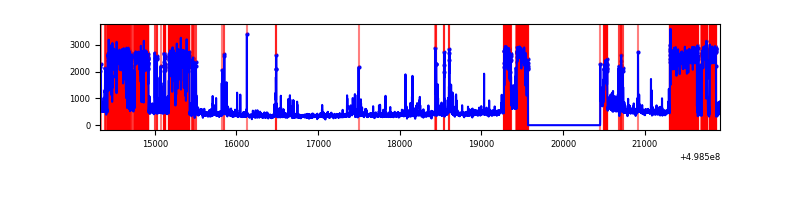 |
| D | 7593 | 6708 | 1000 | 1000 | 13.17% | 14.91% | 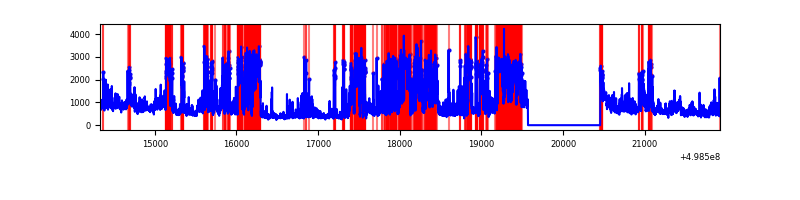 |
Top three noisy pixels from each quadrant. If the there are fewer than three noisy pixels in the level2.evt file, extra rows are filled as -1
| Pixel properties | Quadrant properties | ||||||
|---|---|---|---|---|---|---|---|
| Quadrant | DetID | PixID | Counts | Sigma | Mean | Median | Sigma |
| A | 0 | 8 | 52659 | 285.16 | 726 | 708 | 182.2 |
| A | 7 | 206 | 20634 | 109.38 | 726 | 708 | 182.2 |
| A | 13 | 254 | 13260 | 68.9 | 726 | 708 | 182.2 |
| B | 0 | 213 | 99422 | 642.66 | 714 | 689 | 153.6 |
| B | 0 | 171 | 42472 | 271.97 | 714 | 689 | 153.6 |
| B | 10 | 247 | 36639 | 234.0 | 714 | 689 | 153.6 |
| C | 1 | 241 | 3368069 | 19423.87 | 622 | 617 | 173.4 |
| C | 14 | 254 | 116846 | 670.42 | 622 | 617 | 173.4 |
| C | 1 | 29 | 103314 | 592.37 | 622 | 617 | 173.4 |
| D | 8 | 176 | 1954297 | 10289.33 | 661 | 630 | 189.9 |
| D | 15 | 108 | 1716218 | 9035.44 | 661 | 630 | 189.9 |
| D | 2 | 172 | 309525 | 1626.85 | 661 | 630 | 189.9 |
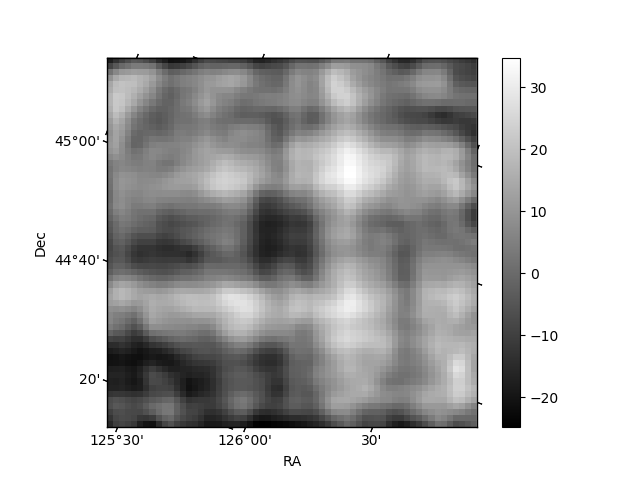
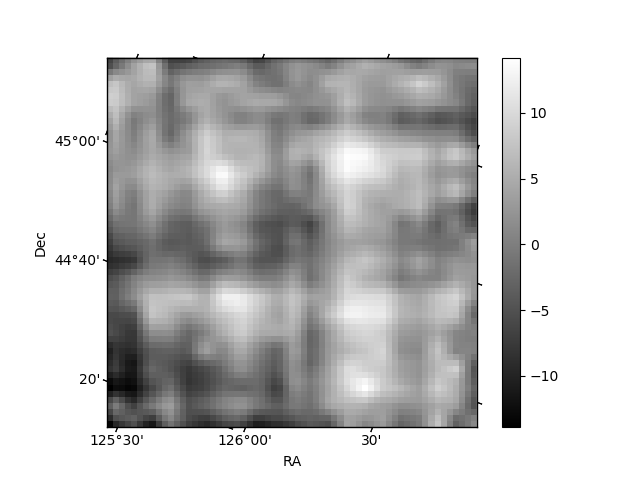
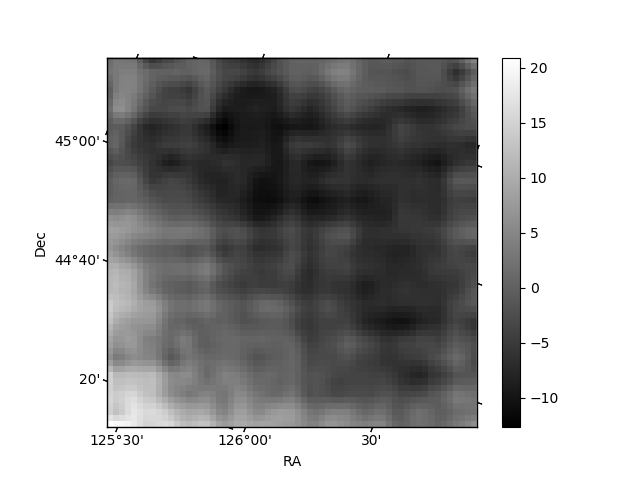
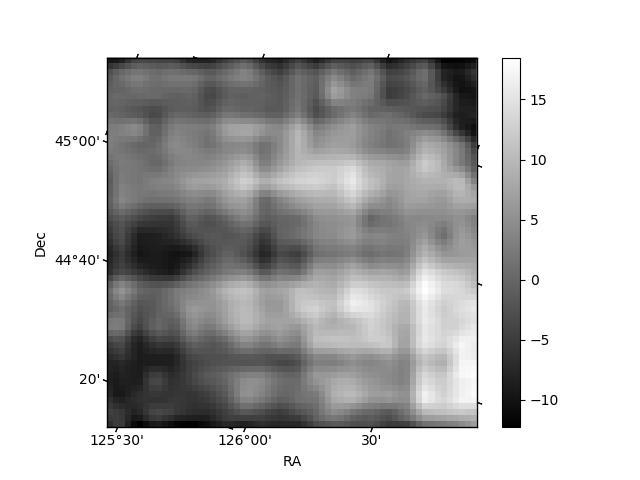
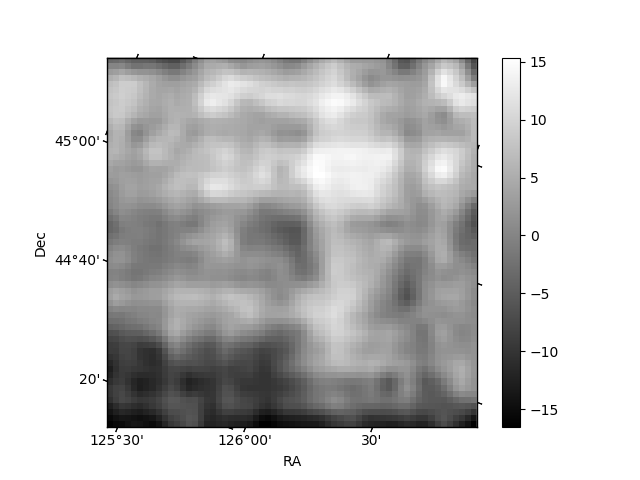
Histogram calculated using DETX and DETY for each event in the final _common_clean file
| Quadrant A | 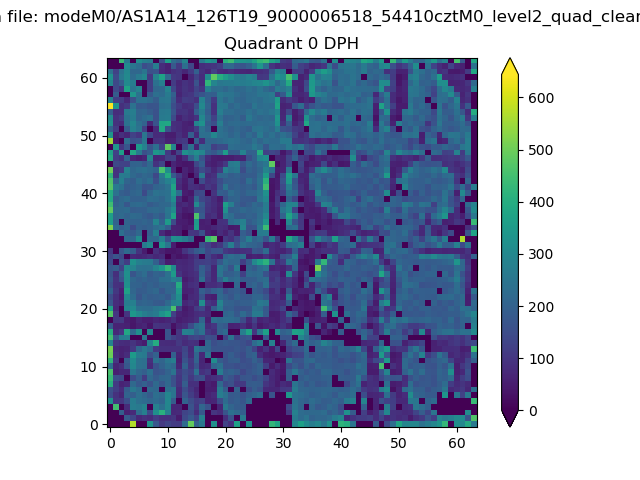 |
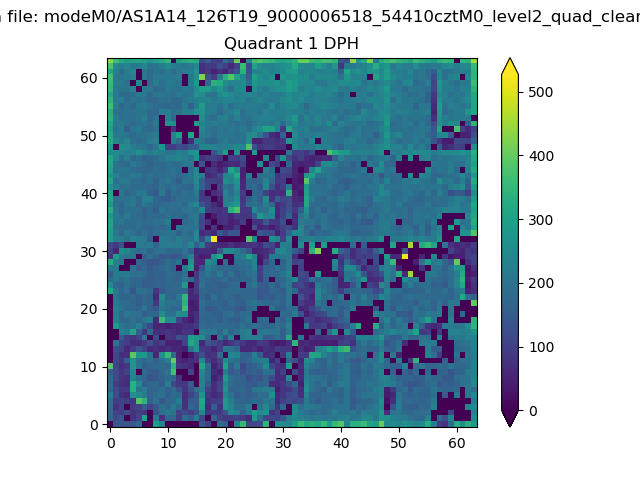 |
Quadrant B |
|---|---|---|---|
| Quadrant D | 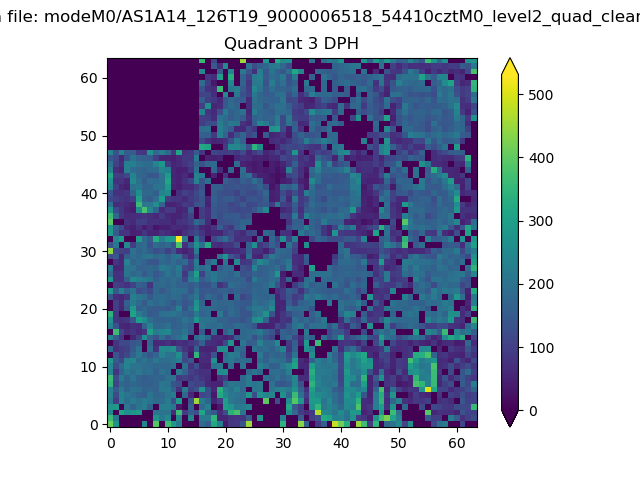 |
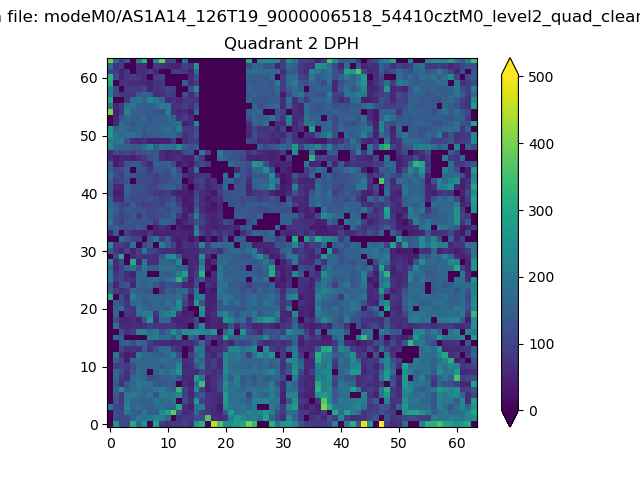 |
Quadrant C |
| Plot type | Count rate plots | Images |
|---|---|---|
| Comparison with Poisson distribution Blue bars denote a histogram of data divided into 1 sec bins. Red curve is a Poisson curve with rate = median count rate of data. |
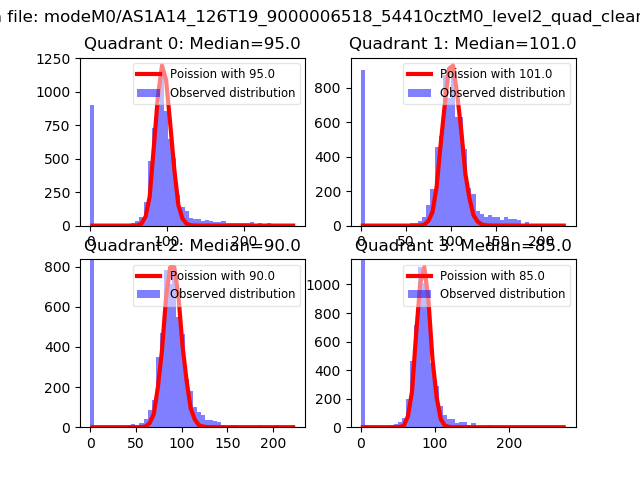 |
 |
| Quadrant-wise count rates Data is divided into 100 sec bins |
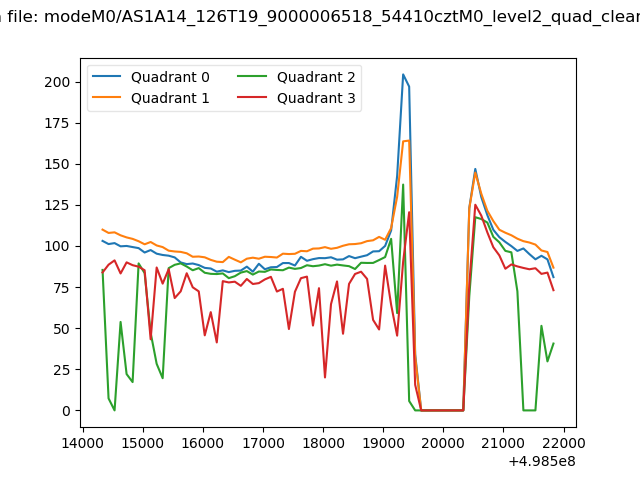 |
|
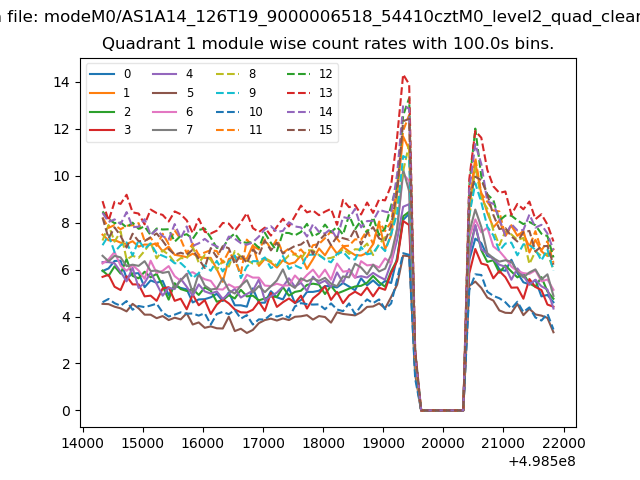
| Module-wise count rates for Quadrant A Data is divided into 100 sec bins |
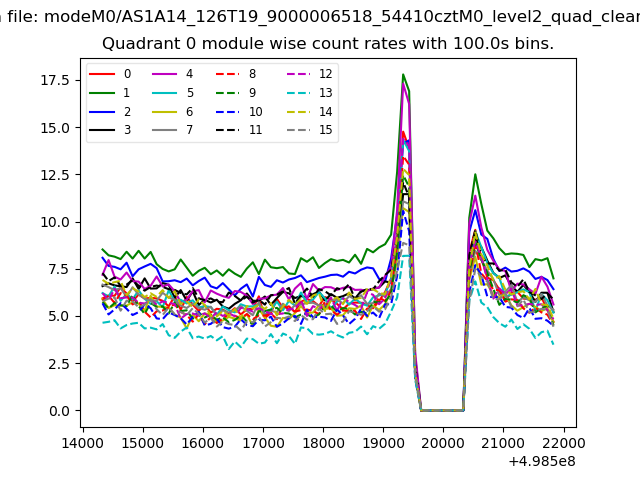 |
 |
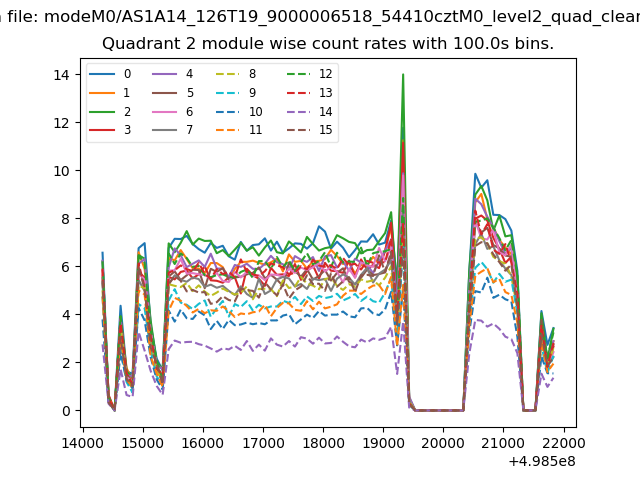
| Module-wise count rates for Quadrant B Data is divided into 100 sec bins |
 |
 |
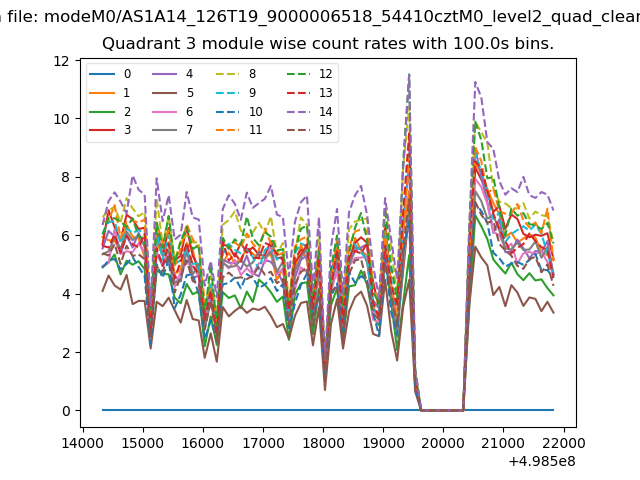
| Module-wise count rates for Quadrant C Data is divided into 100 sec bins |
 |
 |
| Module-wise count rates for Quadrant D Data is divided into 100 sec bins |
 |
 |
| Parameter | Plot |
|---|---|
| CZT HV Monitor | 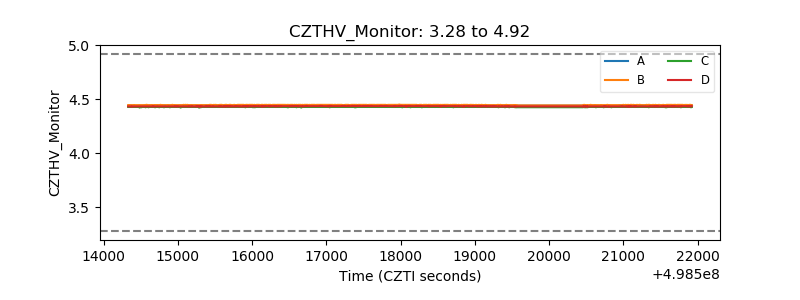 |
| D_VDD | 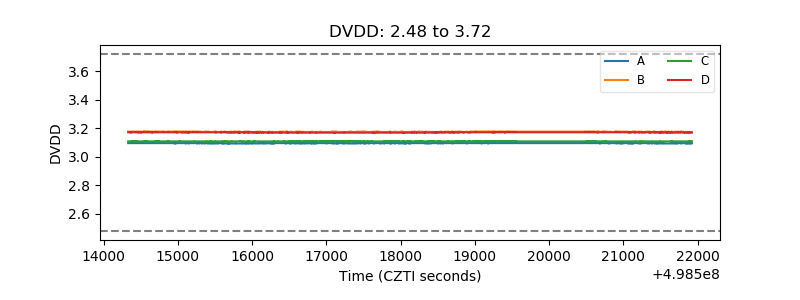 |
| Temperature 1 | 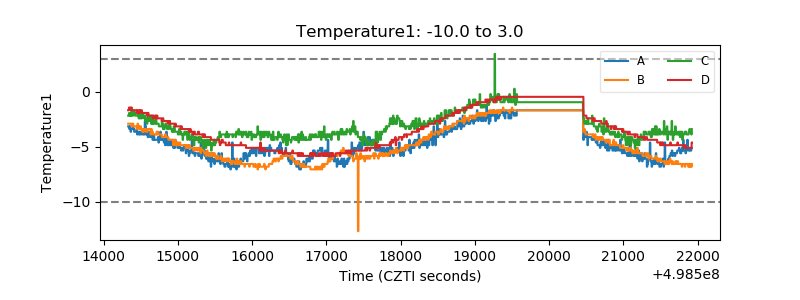 |
| Veto HV Monitor | 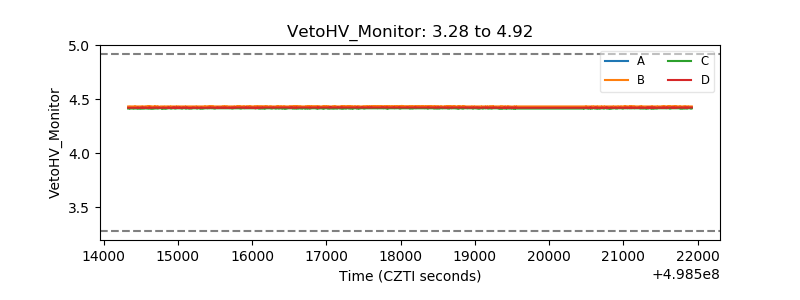 |
| Veto LLD | 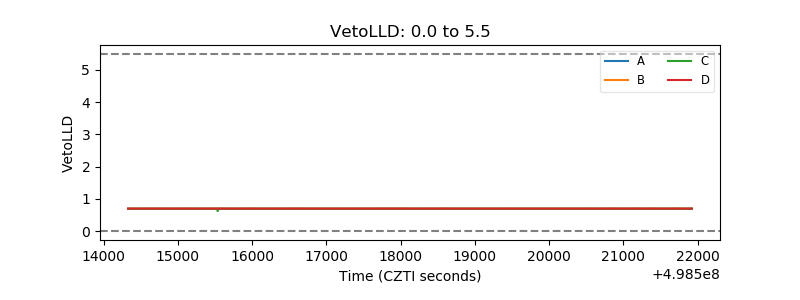 |
| Alpha Counter | 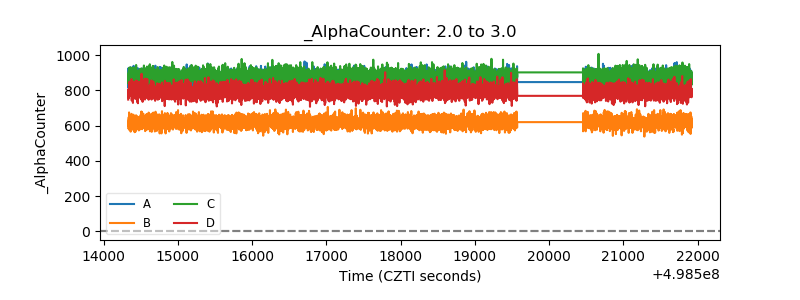 |
| _CPM_Rate | 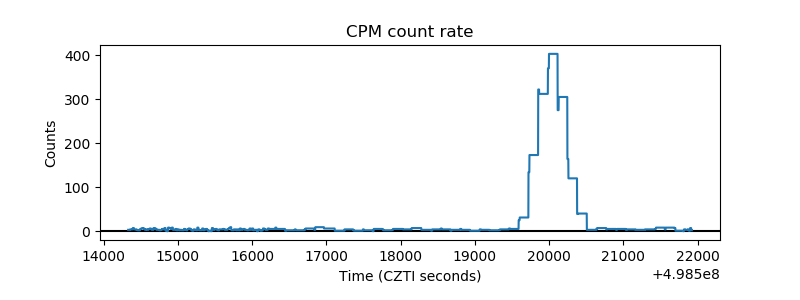 |
| CZT Counter | 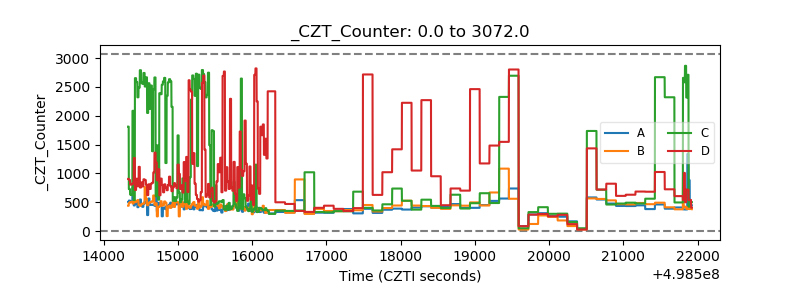 |
| +2.5 Volts monitor | 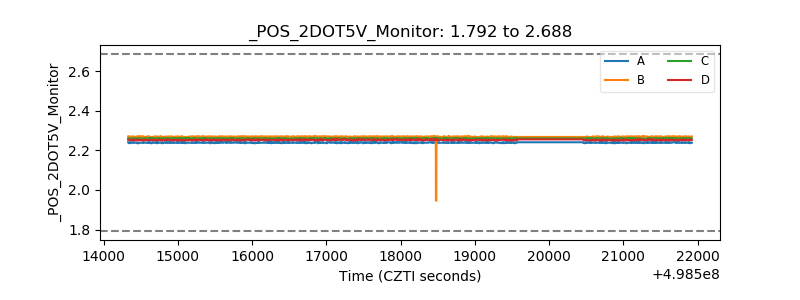 |
| +5 Volts monitor | 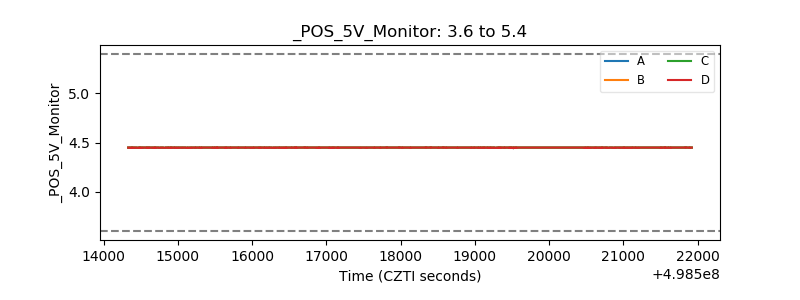 |
| _ROLL_ROT | 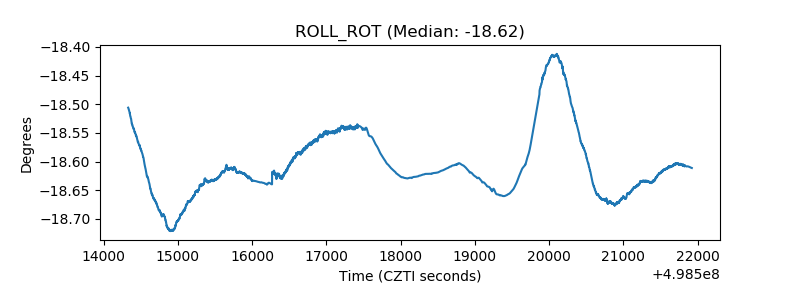 |
| _Roll_DEC | 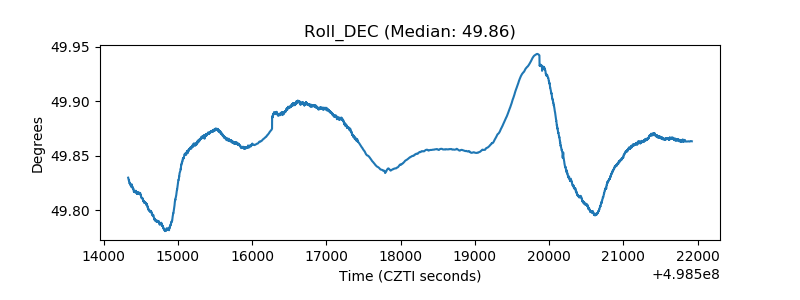 |
| _Roll_RA | 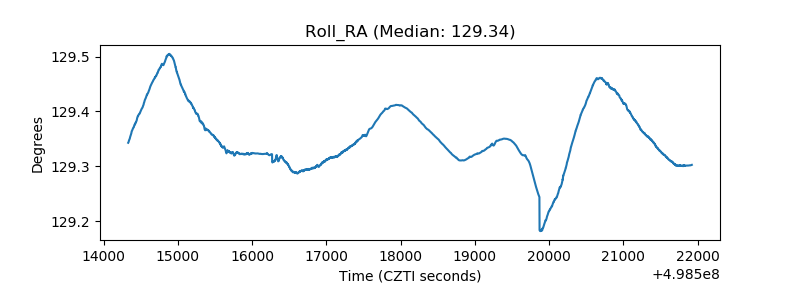 |
| Veto Counter | 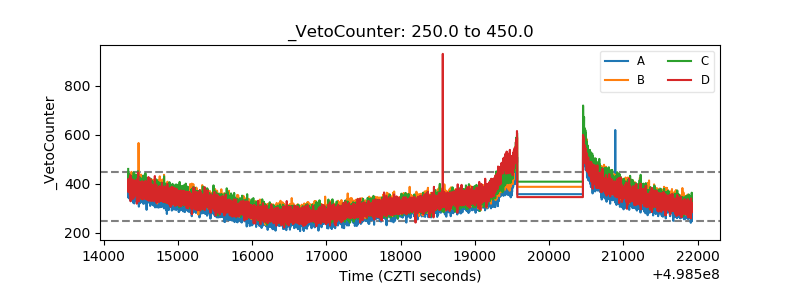 |