| Param | Original file | Final file |
|---|---|---|
| Filename | modeM0/AS1A14_126T19_9000006518_54413cztM0_level2.fits | modeM0/AS1A14_126T19_9000006518_54413cztM0_level2_quad_clean.evt |
| Size (bytes) | 632,577,600 | 86,592,960 |
| Size | 603.3 MB | 82.6 MB |
| Events in quadrant A | 2,882,747 | 629,564 |
| Events in quadrant B | 3,040,564 | 678,895 |
| Events in quadrant C | 6,039,019 | 518,524 |
| Events in quadrant D | 10,949,703 | 342,212 |
| Mode SS | |||
|---|---|---|---|
| Quadrant | BADHDUFLAG | Total packets | Discarded packets |
| A | 0 | 132 | 0 |
| B | 0 | 132 | 0 |
| C | 0 | 132 | 0 |
| D | 0 | 132 | 0 |
| Mode M0 | |||
|---|---|---|---|
| Quadrant | BADHDUFLAG | Total packets | Discarded packets |
| A | 0 | 13673 | 2 |
| B | 0 | 13907 | 2 |
| C | 0 | 22646 | 2 |
| D | 0 | 37038 | 2 |
| Mode M9 | |||
|---|---|---|---|
| Quadrant | BADHDUFLAG | Total packets | Discarded packets |
| A | 0 | 20 | 0 |
| B | 0 | 21 | 0 |
| C | 0 | 21 | 0 |
| D | 0 | 21 | 0 |
| Quadrant | Total seconds | Saturated seconds | Saturation percentage |
|---|---|---|---|
| A | 6488 | 26 | 0.400740% |
| B | 6488 | 41 | 0.631936% |
| C | 6488 | 1122 | 17.293465% |
| D | 6488 | 2846 | 43.865598% |
Noise dominated data is calculated using 1-second bins in cleaned event files. If a bin has >2000 counts, and if more than 50% of those come from <1% of pixels, then it is considered to be noise-dominated and hence unusable.
| Quadrant | # 1 sec bins | Bins with >0 counts | Bins with >2000 counts | High rate bins dominated by noise | Noise dominated (total time) | Noise dominated (detector-on time) | Marked lightcurve |
|---|---|---|---|---|---|---|---|
| A | 7613 | 6488 | 7 | 7 | 0.09% | 0.11% | 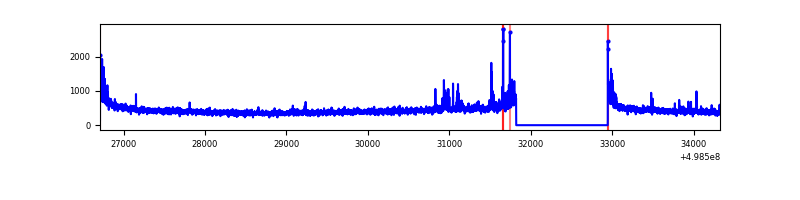 |
| B | 7613 | 6489 | 15 | 15 | 0.20% | 0.23% | 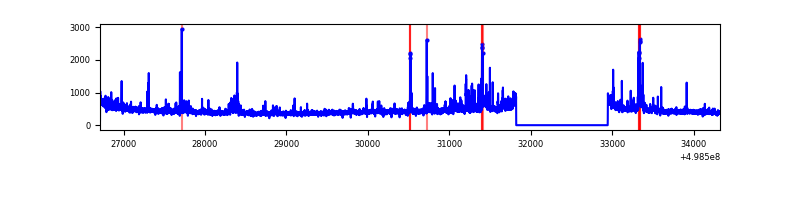 |
| C | 7613 | 6488 | 1100 | 1100 | 14.45% | 16.95% | 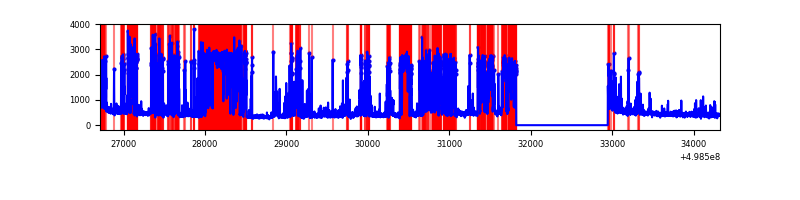 |
| D | 7613 | 6489 | 2914 | 2914 | 38.28% | 44.91% | 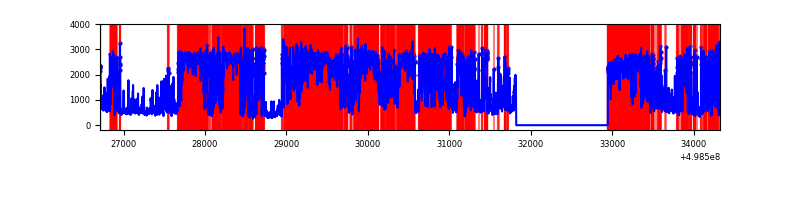 |
Top three noisy pixels from each quadrant. If the there are fewer than three noisy pixels in the level2.evt file, extra rows are filled as -1
| Pixel properties | Quadrant properties | ||||||
|---|---|---|---|---|---|---|---|
| Quadrant | DetID | PixID | Counts | Sigma | Mean | Median | Sigma |
| A | 7 | 206 | 83226 | 479.46 | 689 | 671 | 172.2 |
| A | 11 | 31 | 46822 | 268.03 | 689 | 671 | 172.2 |
| A | 5 | 243 | 29042 | 164.77 | 689 | 671 | 172.2 |
| B | 0 | 171 | 122453 | 823.01 | 687 | 663 | 148.0 |
| B | 10 | 247 | 97759 | 656.13 | 687 | 663 | 148.0 |
| B | 0 | 213 | 52182 | 348.14 | 687 | 663 | 148.0 |
| C | 1 | 241 | 3267122 | 18980.21 | 626 | 622 | 172.1 |
| C | 4 | 5 | 93991 | 542.53 | 626 | 622 | 172.1 |
| C | 14 | 254 | 88301 | 509.46 | 626 | 622 | 172.1 |
| D | 8 | 176 | 5130632 | 34398.28 | 517 | 493 | 149.1 |
| D | 15 | 108 | 2252443 | 15099.63 | 517 | 493 | 149.1 |
| D | 7 | 70 | 735403 | 4927.67 | 517 | 493 | 149.1 |
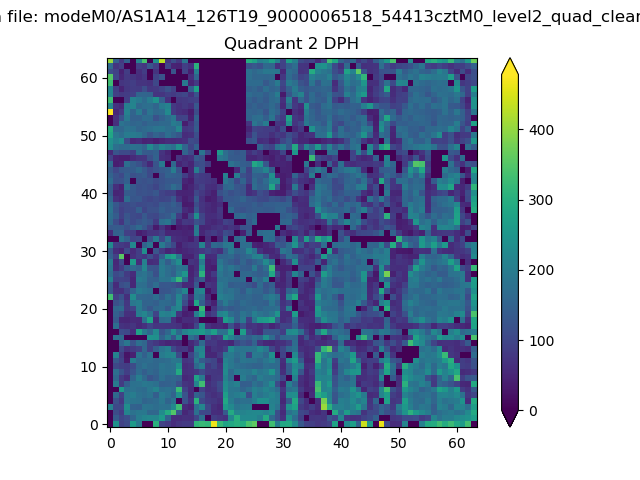
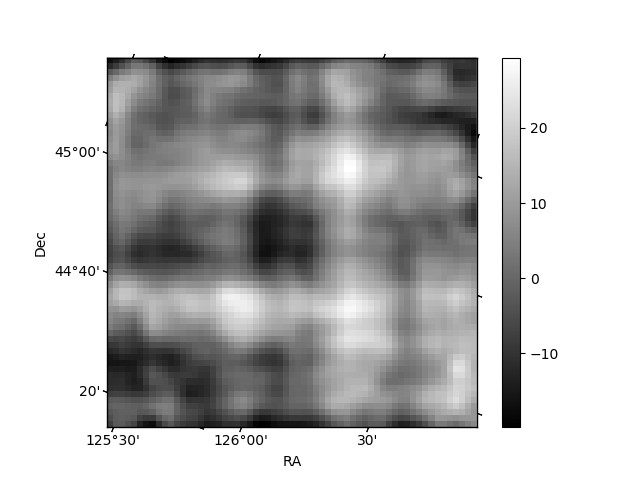
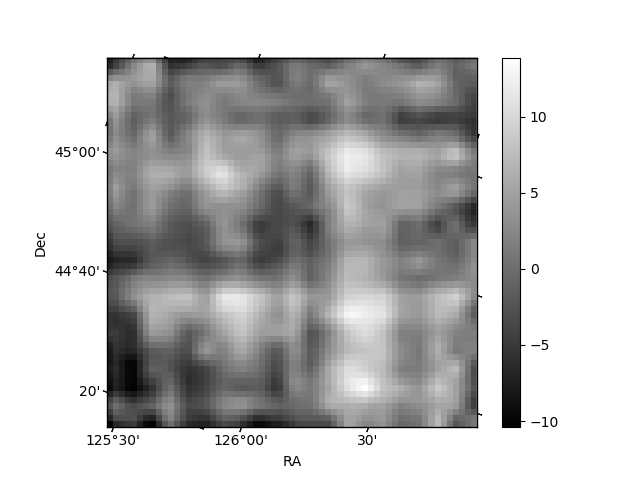
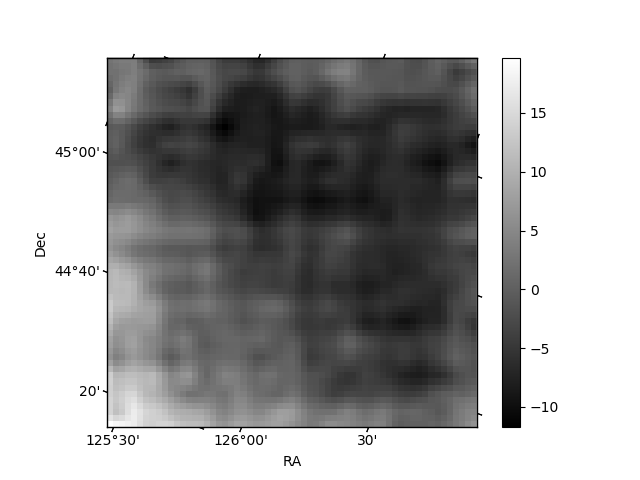
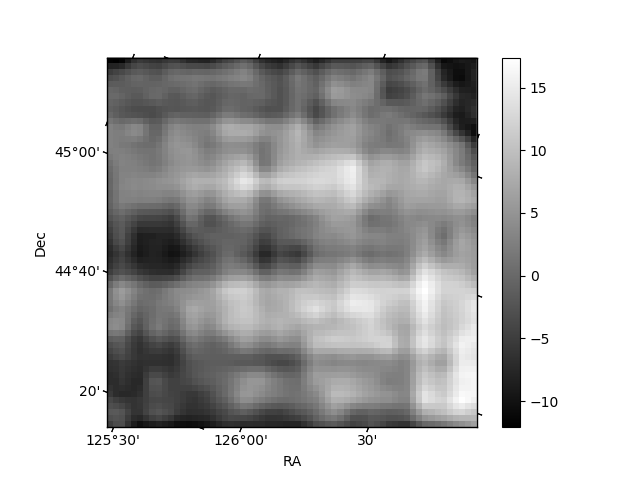
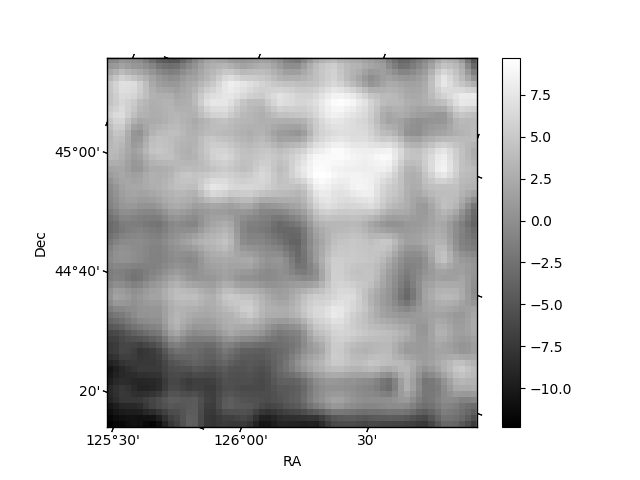
Histogram calculated using DETX and DETY for each event in the final _common_clean file
| Quadrant A | 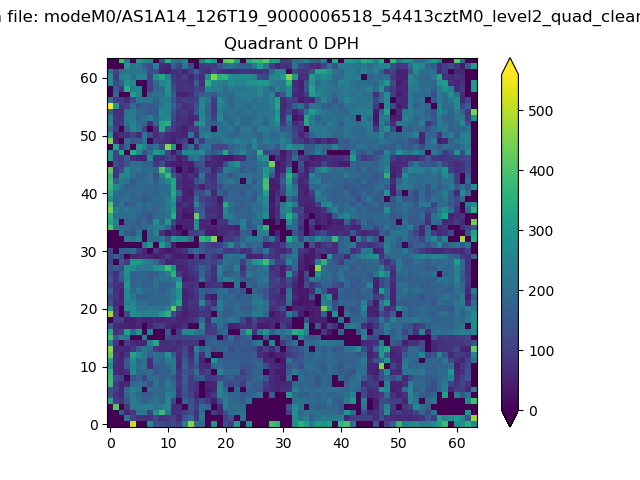 |
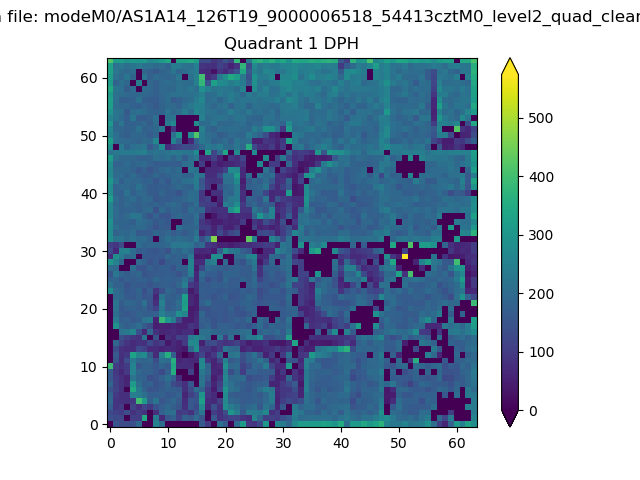 |
Quadrant B |
|---|---|---|---|
| Quadrant D | 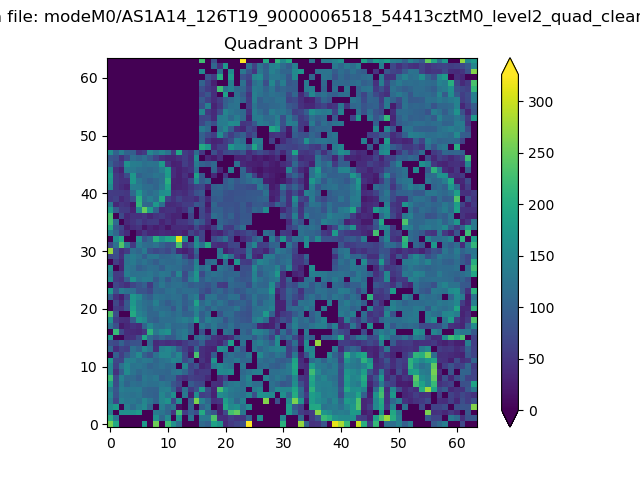 |
 |
Quadrant C |
| Plot type | Count rate plots | Images |
|---|---|---|
| Comparison with Poisson distribution Blue bars denote a histogram of data divided into 1 sec bins. Red curve is a Poisson curve with rate = median count rate of data. |
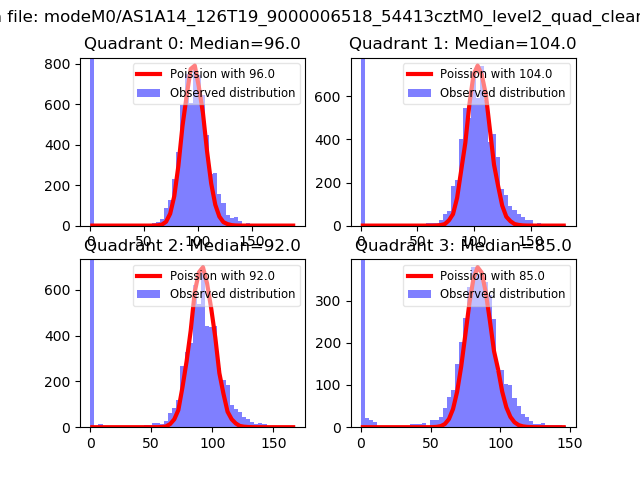 |
 |
| Quadrant-wise count rates Data is divided into 100 sec bins |
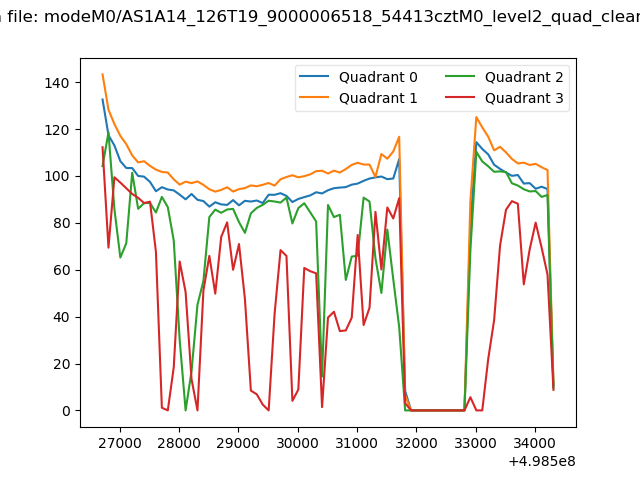 |
|
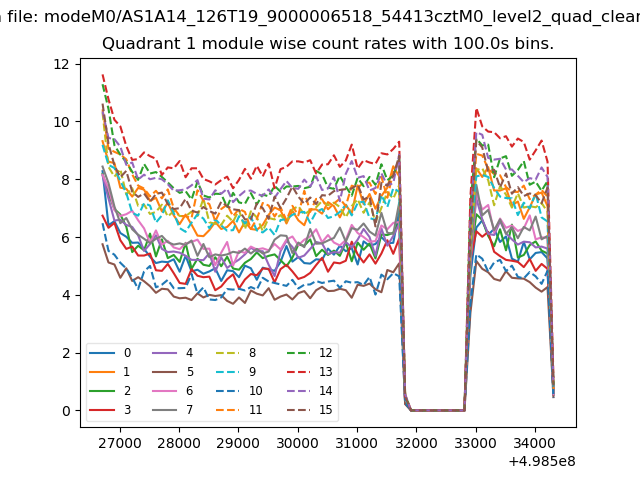
| Module-wise count rates for Quadrant A Data is divided into 100 sec bins |
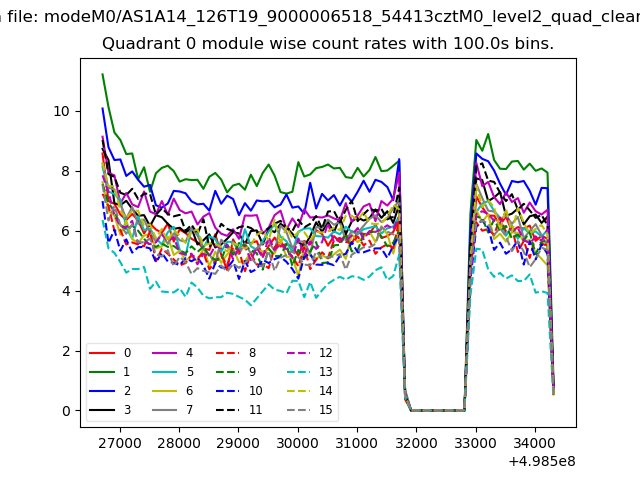 |
 |
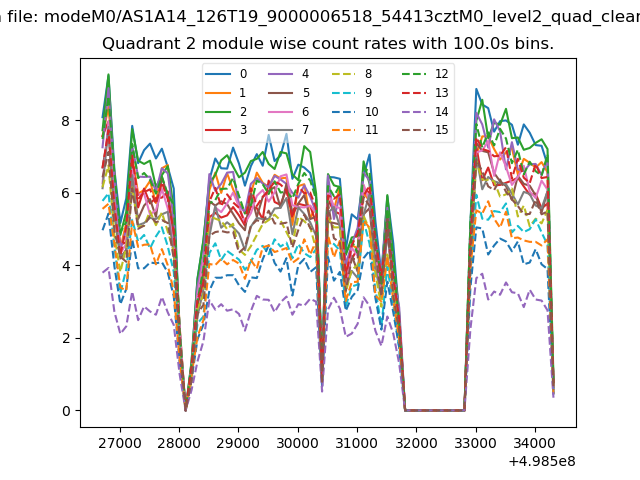
| Module-wise count rates for Quadrant B Data is divided into 100 sec bins |
 |
 |
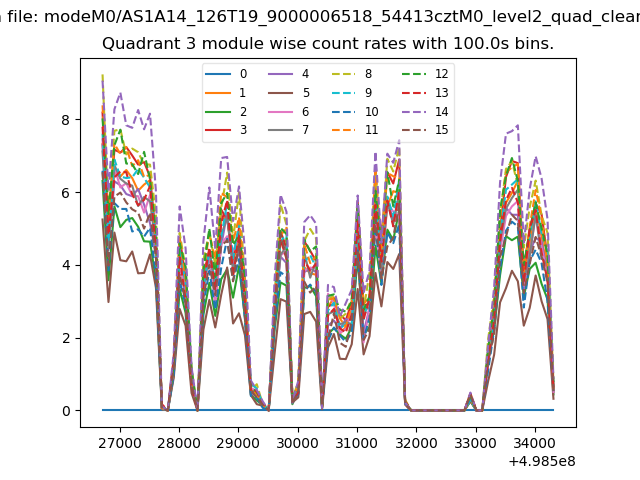
| Module-wise count rates for Quadrant C Data is divided into 100 sec bins |
 |
 |
| Module-wise count rates for Quadrant D Data is divided into 100 sec bins |
 |
 |
| Parameter | Plot |
|---|---|
| CZT HV Monitor | 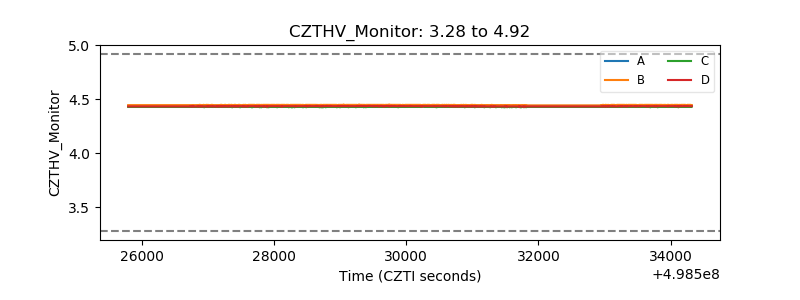 |
| D_VDD | 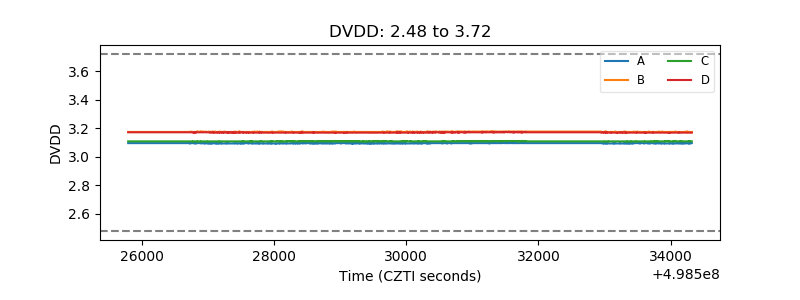 |
| Temperature 1 | 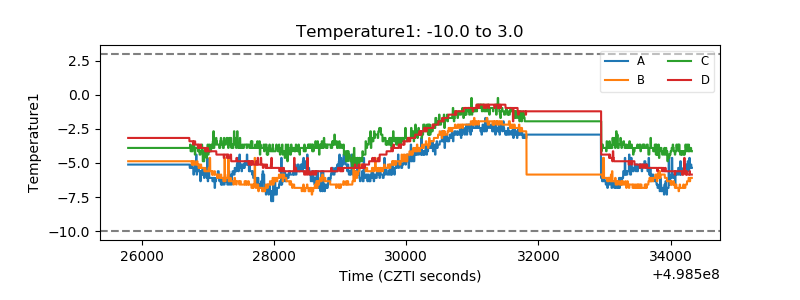 |
| Veto HV Monitor |  |
| Veto LLD | 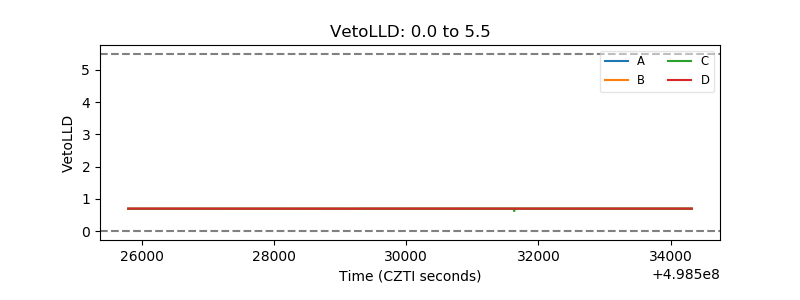 |
| Alpha Counter | 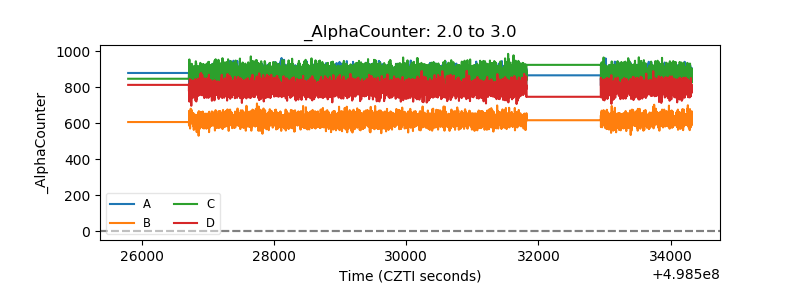 |
| _CPM_Rate | 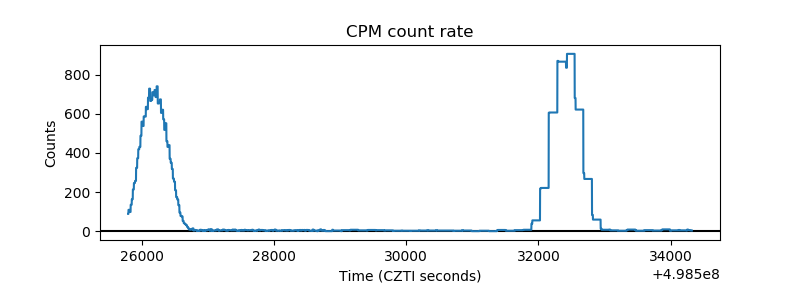 |
| CZT Counter | 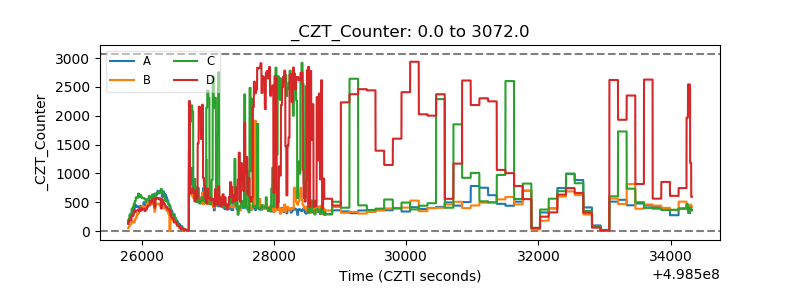 |
| +2.5 Volts monitor | 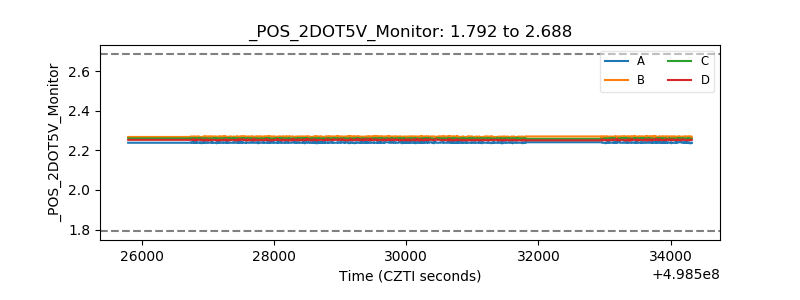 |
| +5 Volts monitor |  |
| _ROLL_ROT | 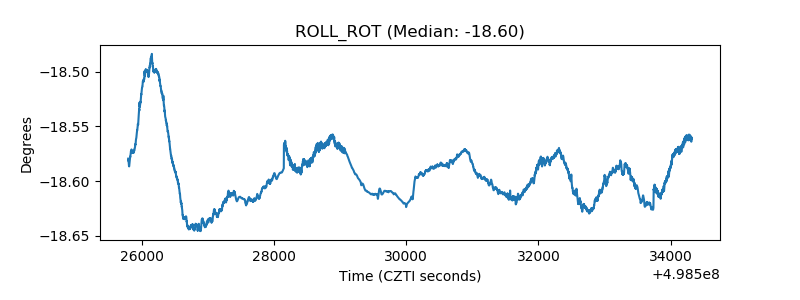 |
| _Roll_DEC | 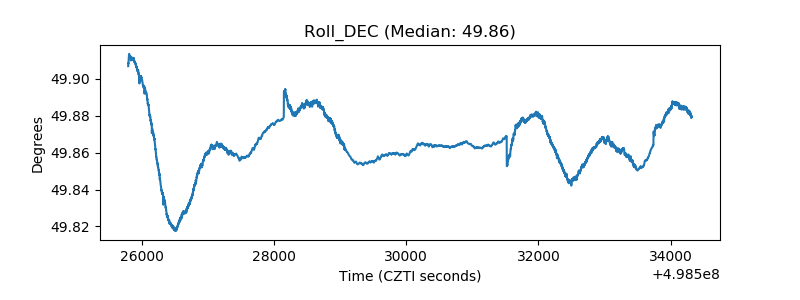 |
| _Roll_RA | 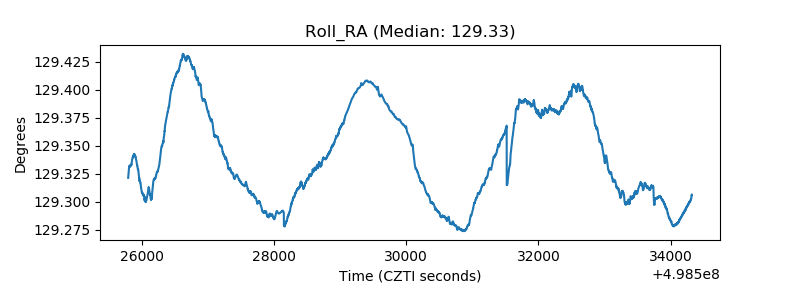 |
| Veto Counter | 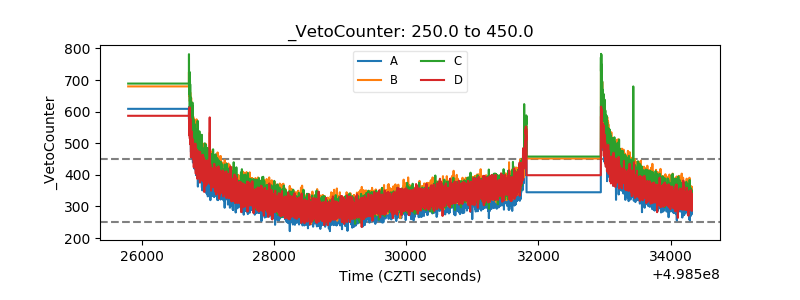 |