| Param | Original file | Final file |
|---|---|---|
| Filename | modeM0/AS1A14_126T19_9000006518_54414cztM0_level2.fits | modeM0/AS1A14_126T19_9000006518_54414cztM0_level2_quad_clean.evt |
| Size (bytes) | 635,892,480 | 93,225,600 |
| Size | 606.4 MB | 88.9 MB |
| Events in quadrant A | 3,216,571 | 673,441 |
| Events in quadrant B | 3,387,460 | 722,900 |
| Events in quadrant C | 5,137,767 | 604,595 |
| Events in quadrant D | 11,261,914 | 341,620 |
| Mode SS | |||
|---|---|---|---|
| Quadrant | BADHDUFLAG | Total packets | Discarded packets |
| A | 0 | 142 | 0 |
| B | 0 | 142 | 0 |
| C | 0 | 142 | 0 |
| D | 0 | 142 | 0 |
| Mode M0 | |||
|---|---|---|---|
| Quadrant | BADHDUFLAG | Total packets | Discarded packets |
| A | 0 | 14887 | 2 |
| B | 0 | 15213 | 2 |
| C | 0 | 20266 | 2 |
| D | 0 | 38190 | 2 |
| Mode M9 | |||
|---|---|---|---|
| Quadrant | BADHDUFLAG | Total packets | Discarded packets |
| A | 0 | 22 | 0 |
| B | 0 | 22 | 0 |
| C | 0 | 22 | 0 |
| D | 0 | 22 | 0 |
| Quadrant | Total seconds | Saturated seconds | Saturation percentage |
|---|---|---|---|
| A | 6884 | 42 | 0.610110% |
| B | 6885 | 98 | 1.423384% |
| C | 6885 | 591 | 8.583878% |
| D | 6885 | 3214 | 46.681191% |
Noise dominated data is calculated using 1-second bins in cleaned event files. If a bin has >2000 counts, and if more than 50% of those come from <1% of pixels, then it is considered to be noise-dominated and hence unusable.
| Quadrant | # 1 sec bins | Bins with >0 counts | Bins with >2000 counts | High rate bins dominated by noise | Noise dominated (total time) | Noise dominated (detector-on time) | Marked lightcurve |
|---|---|---|---|---|---|---|---|
| A | 9199 | 6885 | 20 | 20 | 0.22% | 0.29% | 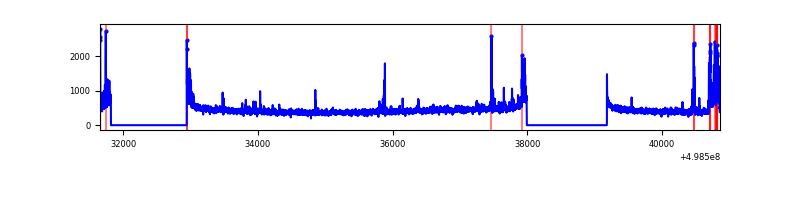 |
| B | 9200 | 6887 | 39 | 39 | 0.42% | 0.57% | 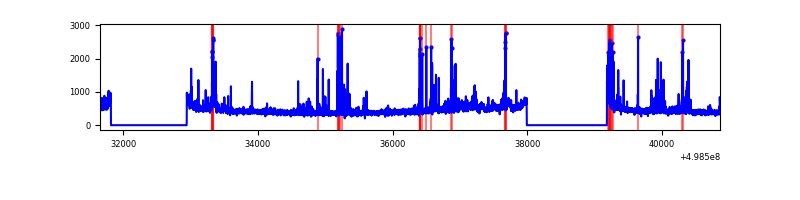 |
| C | 9200 | 6886 | 587 | 587 | 6.38% | 8.52% | 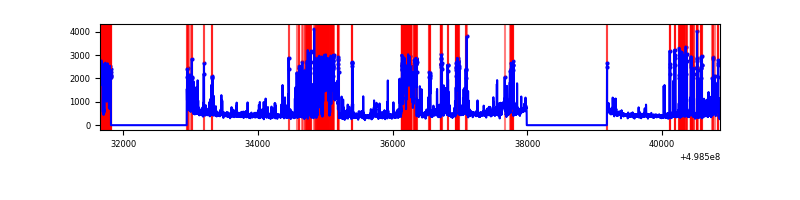 |
| D | 9200 | 6886 | 3115 | 3115 | 33.86% | 45.24% | 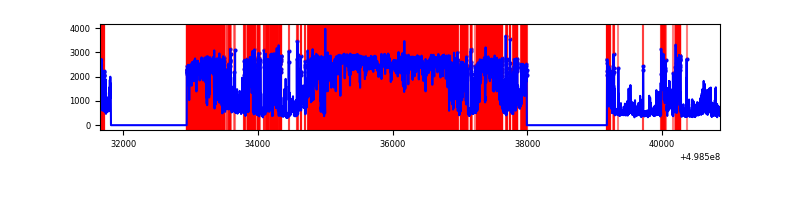 |
Top three noisy pixels from each quadrant. If the there are fewer than three noisy pixels in the level2.evt file, extra rows are filled as -1
| Pixel properties | Quadrant properties | ||||||
|---|---|---|---|---|---|---|---|
| Quadrant | DetID | PixID | Counts | Sigma | Mean | Median | Sigma |
| A | 7 | 206 | 278300 | 1510.93 | 733 | 714 | 183.7 |
| A | 5 | 243 | 27814 | 147.51 | 733 | 714 | 183.7 |
| A | 11 | 31 | 19167 | 100.44 | 733 | 714 | 183.7 |
| B | 10 | 247 | 219369 | 1404.75 | 728 | 702 | 155.7 |
| B | 0 | 213 | 86223 | 549.4 | 728 | 702 | 155.7 |
| B | 7 | 0 | 80358 | 511.72 | 728 | 702 | 155.7 |
| C | 1 | 241 | 1034699 | 5496.1 | 690 | 684 | 188.1 |
| C | 13 | 3 | 874046 | 4642.18 | 690 | 684 | 188.1 |
| C | 4 | 5 | 262655 | 1392.45 | 690 | 684 | 188.1 |
| D | 8 | 176 | 6714886 | 47633.11 | 490 | 466 | 141.0 |
| D | 7 | 70 | 1813978 | 12865.33 | 490 | 466 | 141.0 |
| D | 15 | 108 | 259832 | 1839.98 | 490 | 466 | 141.0 |
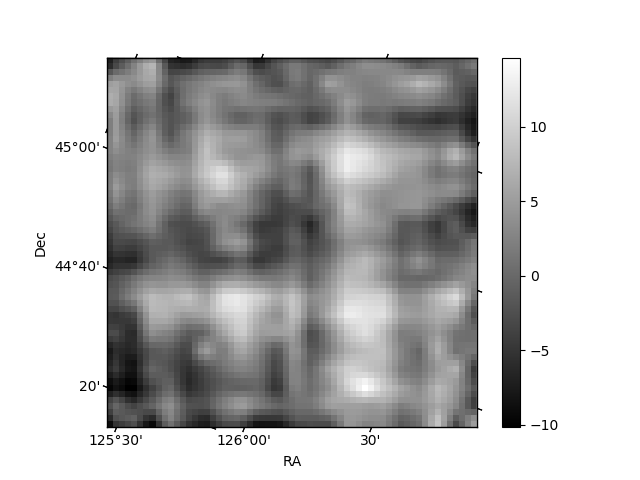
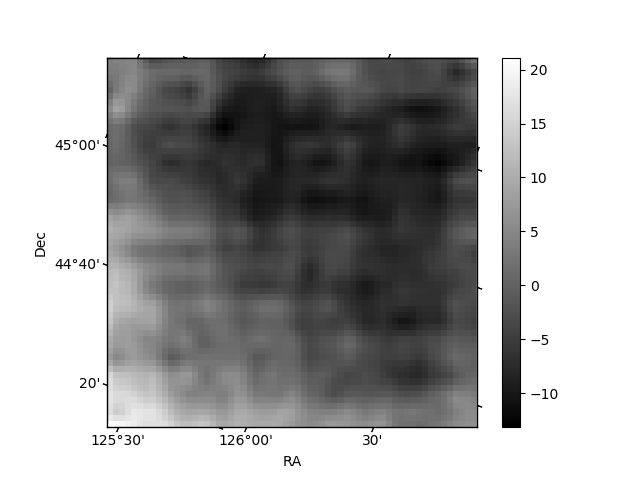
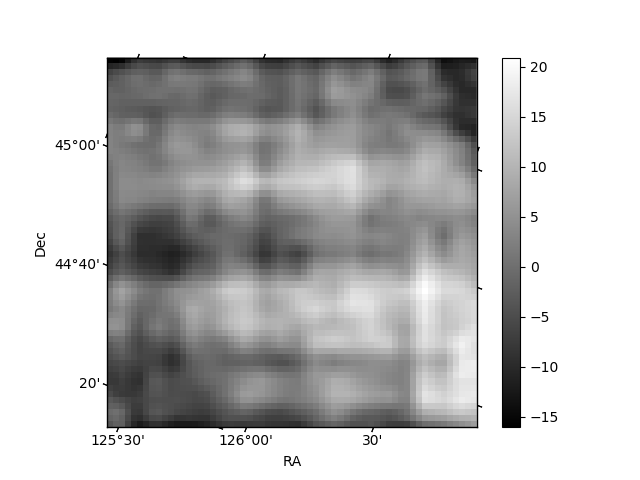
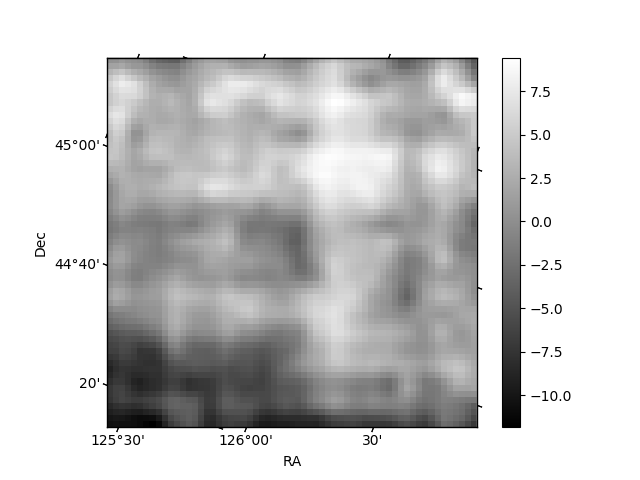
Histogram calculated using DETX and DETY for each event in the final _common_clean file
| Quadrant A | 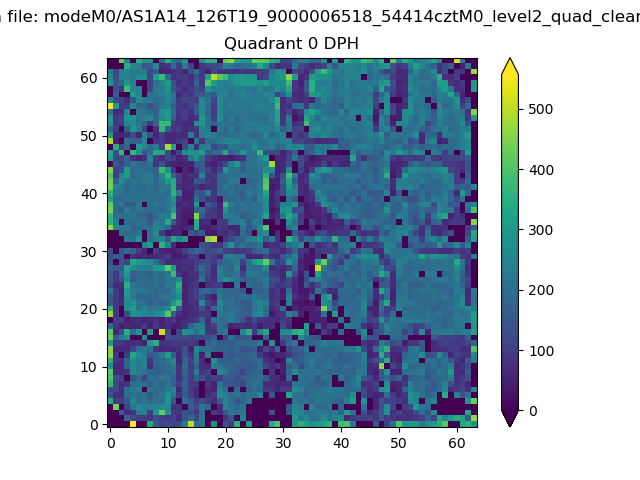 |
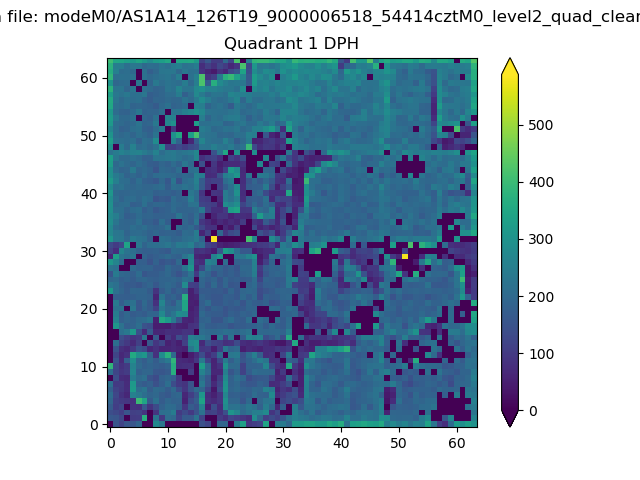 |
Quadrant B |
|---|---|---|---|
| Quadrant D | 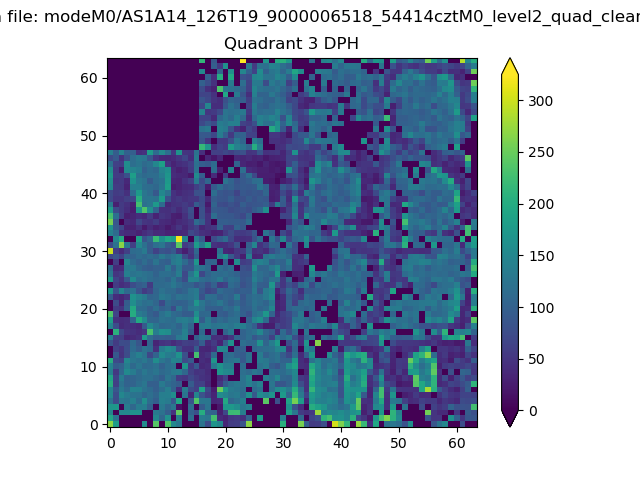 |
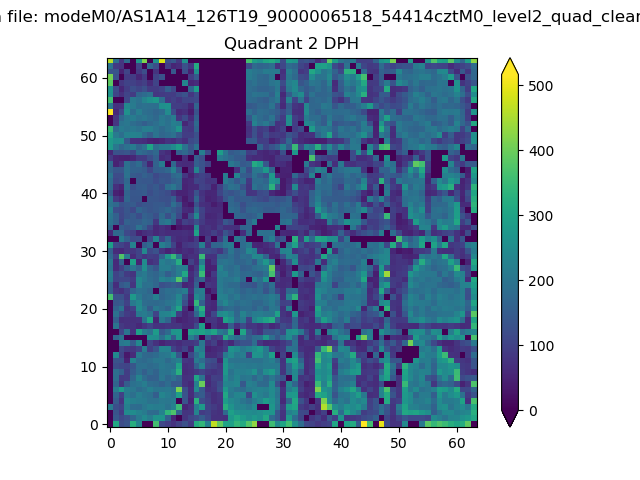 |
Quadrant C |
| Plot type | Count rate plots | Images |
|---|---|---|
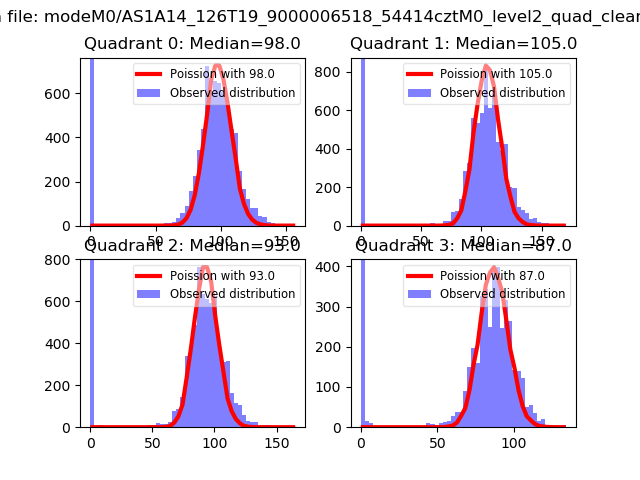
| Comparison with Poisson distribution Blue bars denote a histogram of data divided into 1 sec bins. Red curve is a Poisson curve with rate = median count rate of data. |
 |
 |
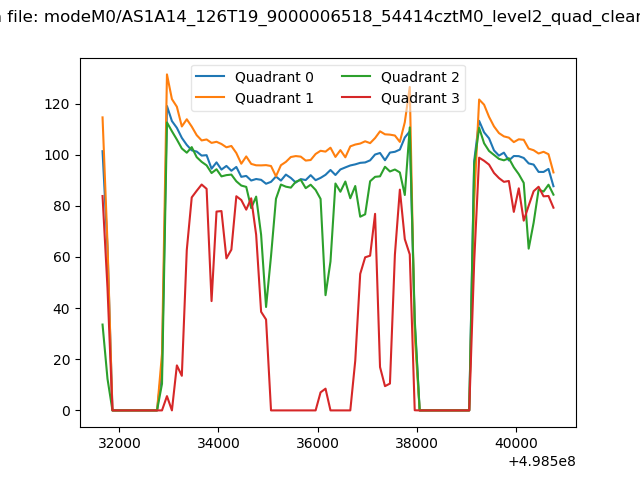
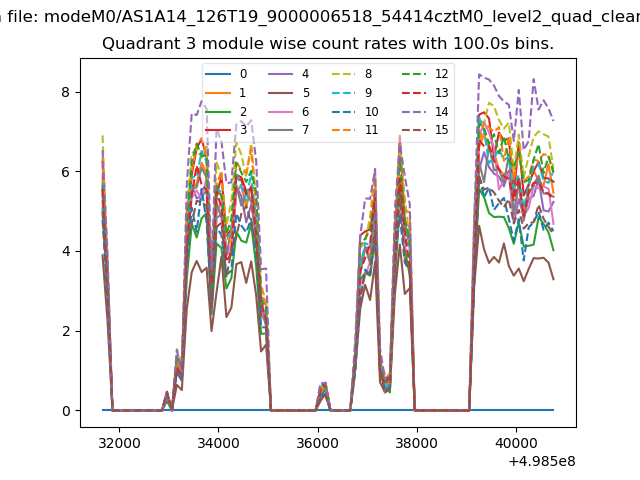
| Quadrant-wise count rates Data is divided into 100 sec bins |
 |
|
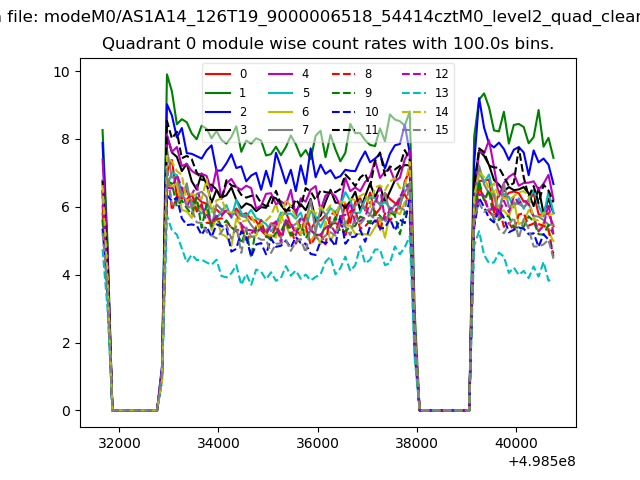
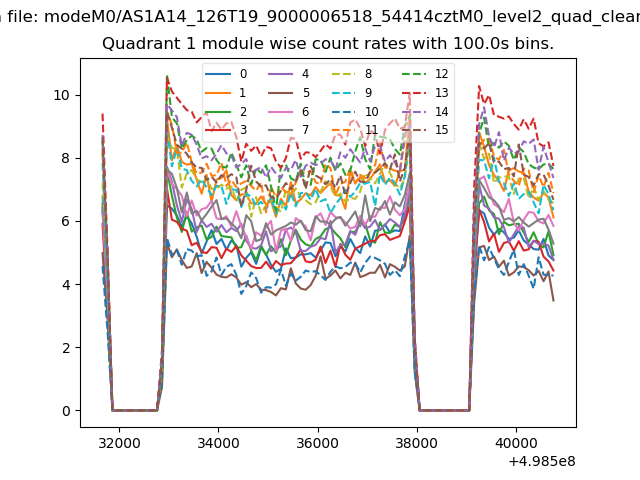
| Module-wise count rates for Quadrant A Data is divided into 100 sec bins |
 |
 |
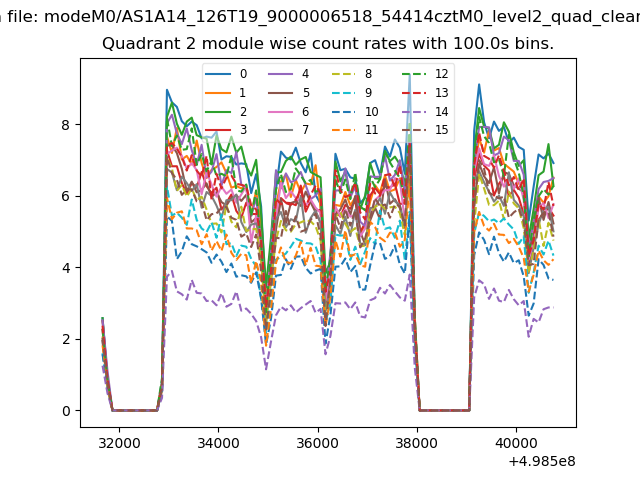
| Module-wise count rates for Quadrant B Data is divided into 100 sec bins |
 |
 |
| Module-wise count rates for Quadrant C Data is divided into 100 sec bins |
 |
 |
| Module-wise count rates for Quadrant D Data is divided into 100 sec bins |
 |
 |
| Parameter | Plot |
|---|---|
| CZT HV Monitor | 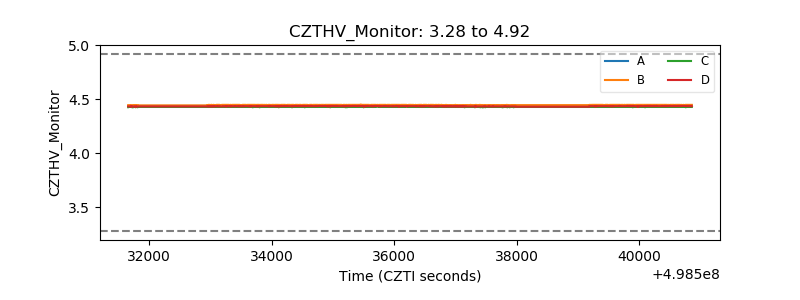 |
| D_VDD | 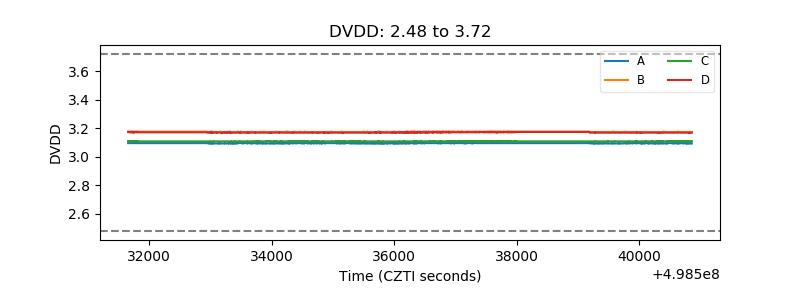 |
| Temperature 1 | 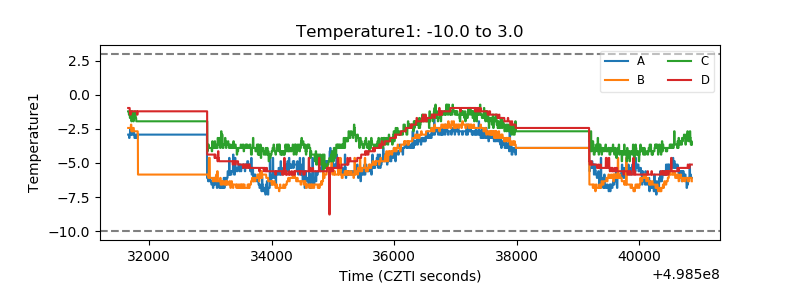 |
| Veto HV Monitor |  |
| Veto LLD | 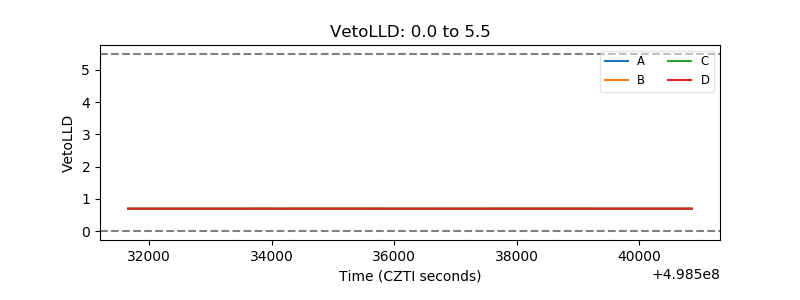 |
| Alpha Counter | 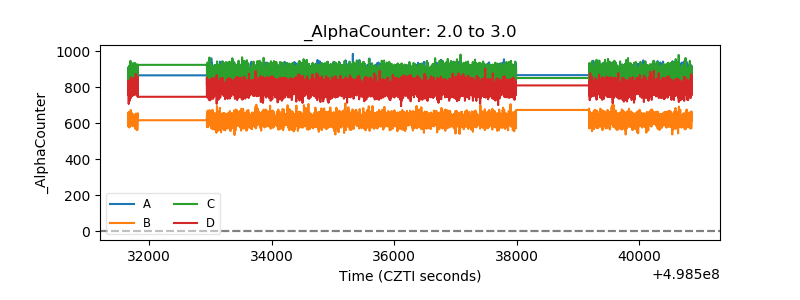 |
| _CPM_Rate | 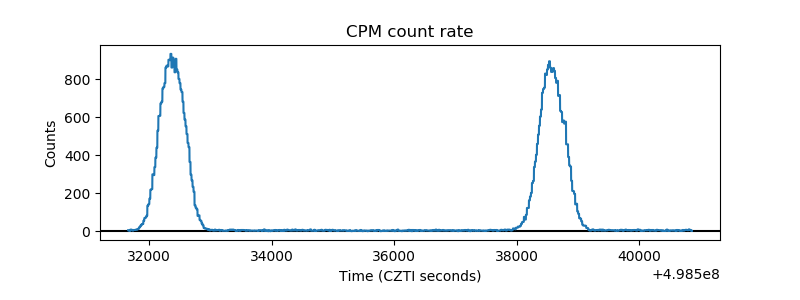 |
| CZT Counter | 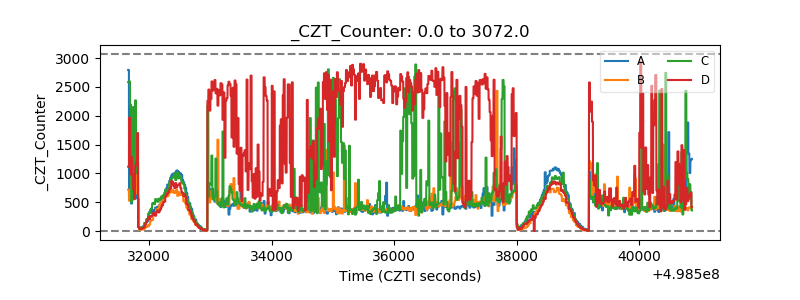 |
| +2.5 Volts monitor | 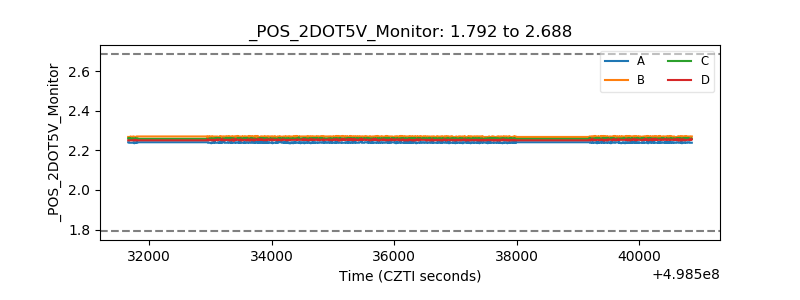 |
| +5 Volts monitor | 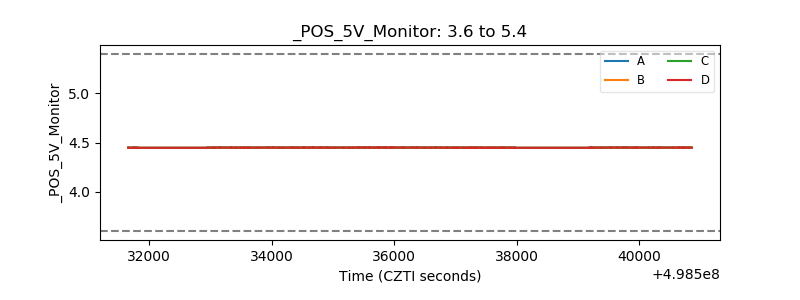 |
| _ROLL_ROT | 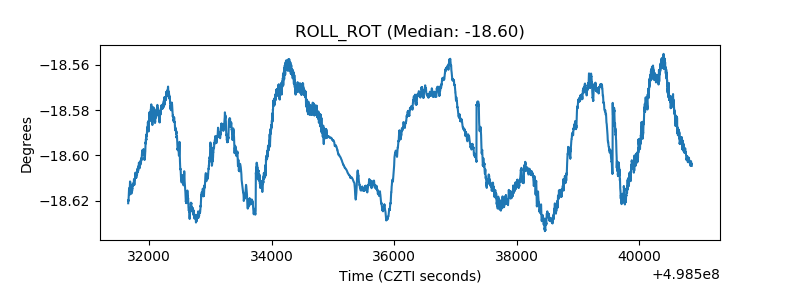 |
| _Roll_DEC | 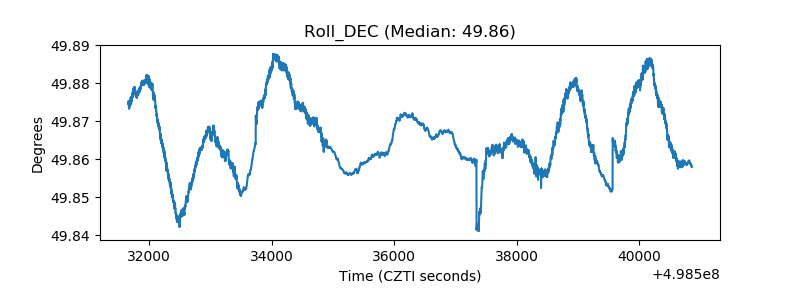 |
| _Roll_RA | 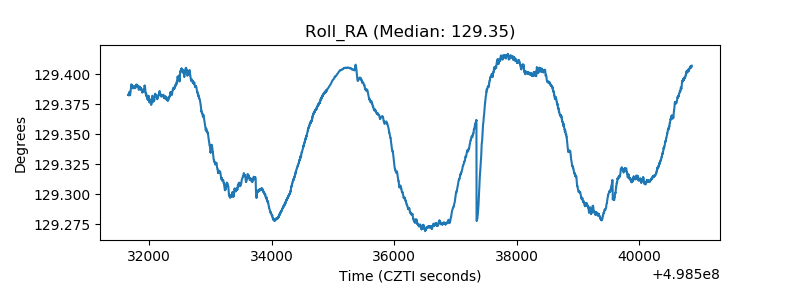 |
| Veto Counter | 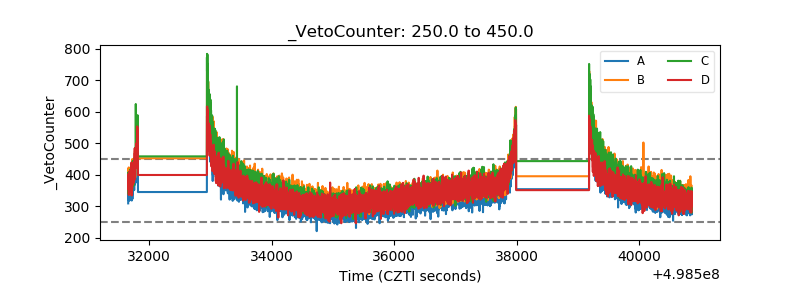 |