| Param | Original file | Final file |
|---|---|---|
| Filename | modeM0/AS1A14_126T19_9000006518_54415cztM0_level2.fits | modeM0/AS1A14_126T19_9000006518_54415cztM0_level2_quad_clean.evt |
| Size (bytes) | 724,008,960 | 83,923,200 |
| Size | 690.5 MB | 80.0 MB |
| Events in quadrant A | 3,290,331 | 646,177 |
| Events in quadrant B | 3,853,425 | 680,734 |
| Events in quadrant C | 10,799,470 | 309,119 |
| Events in quadrant D | 8,344,542 | 443,974 |
| Mode SS | |||
|---|---|---|---|
| Quadrant | BADHDUFLAG | Total packets | Discarded packets |
| A | 0 | 134 | 0 |
| B | 0 | 134 | 0 |
| C | 0 | 134 | 0 |
| D | 0 | 134 | 0 |
| Mode M0 | |||
|---|---|---|---|
| Quadrant | BADHDUFLAG | Total packets | Discarded packets |
| A | 0 | 14867 | 1 |
| B | 0 | 16424 | 1 |
| C | 0 | 36796 | 1 |
| D | 0 | 29353 | 1 |
| Mode M9 | |||
|---|---|---|---|
| Quadrant | BADHDUFLAG | Total packets | Discarded packets |
| A | 0 | 11 | 0 |
| B | 0 | 11 | 0 |
| C | 0 | 11 | 0 |
| D | 0 | 11 | 0 |
| Quadrant | Total seconds | Saturated seconds | Saturation percentage |
|---|---|---|---|
| A | 6613 | 38 | 0.574626% |
| B | 6613 | 234 | 3.538485% |
| C | 6613 | 3383 | 51.156812% |
| D | 6613 | 1602 | 24.225011% |
Noise dominated data is calculated using 1-second bins in cleaned event files. If a bin has >2000 counts, and if more than 50% of those come from <1% of pixels, then it is considered to be noise-dominated and hence unusable.
| Quadrant | # 1 sec bins | Bins with >0 counts | Bins with >2000 counts | High rate bins dominated by noise | Noise dominated (total time) | Noise dominated (detector-on time) | Marked lightcurve |
|---|---|---|---|---|---|---|---|
| A | 7743 | 6614 | 27 | 27 | 0.35% | 0.41% | 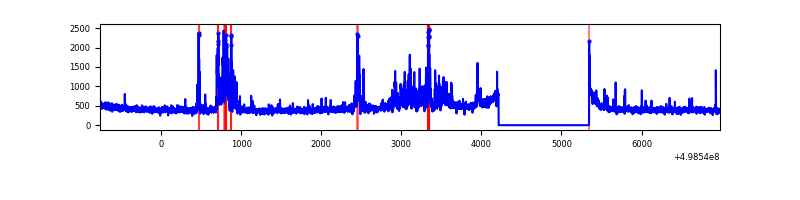 |
| B | 7743 | 6613 | 132 | 132 | 1.70% | 2.00% | 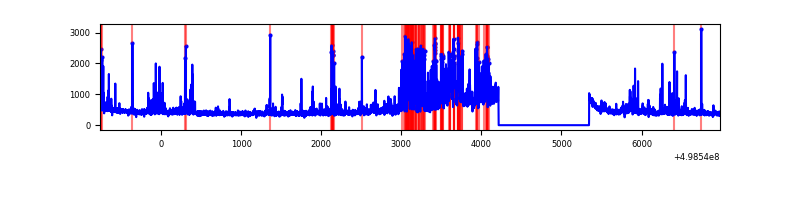 |
| C | 7743 | 6613 | 3402 | 3402 | 43.94% | 51.44% | 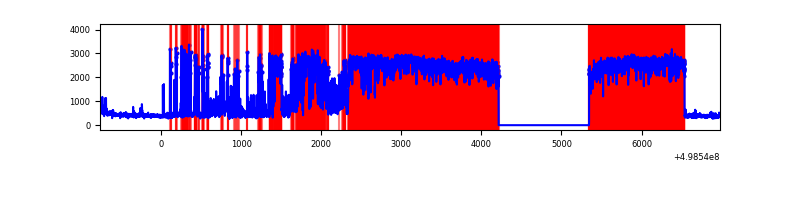 |
| D | 7743 | 6613 | 1638 | 1638 | 21.15% | 24.77% | 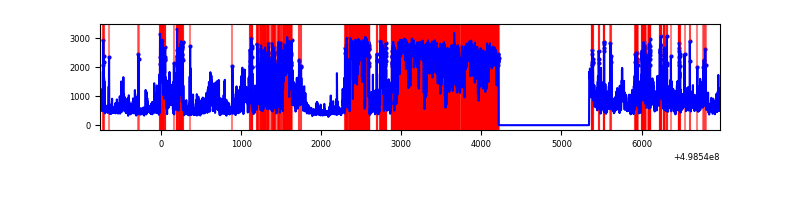 |
Top three noisy pixels from each quadrant. If the there are fewer than three noisy pixels in the level2.evt file, extra rows are filled as -1
| Pixel properties | Quadrant properties | ||||||
|---|---|---|---|---|---|---|---|
| Quadrant | DetID | PixID | Counts | Sigma | Mean | Median | Sigma |
| A | 7 | 206 | 470610 | 2688.11 | 700 | 683 | 174.8 |
| A | 7 | 237 | 40525 | 227.91 | 700 | 683 | 174.8 |
| A | 4 | 3 | 27746 | 154.81 | 700 | 683 | 174.8 |
| B | 5 | 185 | 660124 | 4485.9 | 688 | 665 | 147.0 |
| B | 7 | 0 | 133076 | 900.71 | 688 | 665 | 147.0 |
| B | 10 | 247 | 110007 | 743.79 | 688 | 665 | 147.0 |
| C | 4 | 5 | 5852905 | 40836.95 | 519 | 514 | 143.3 |
| C | 1 | 241 | 1240731 | 8654.02 | 519 | 514 | 143.3 |
| C | 5 | 10 | 1064462 | 7424.04 | 519 | 514 | 143.3 |
| D | 15 | 108 | 2416710 | 14244.95 | 589 | 562 | 169.6 |
| D | 7 | 70 | 2301697 | 13566.86 | 589 | 562 | 169.6 |
| D | 8 | 176 | 660346 | 3889.91 | 589 | 562 | 169.6 |
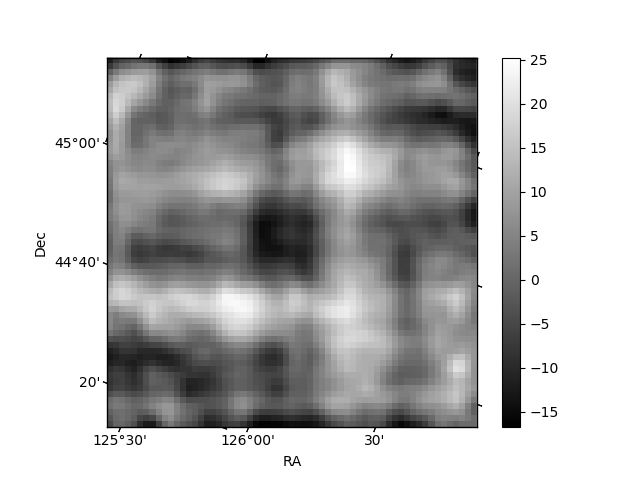
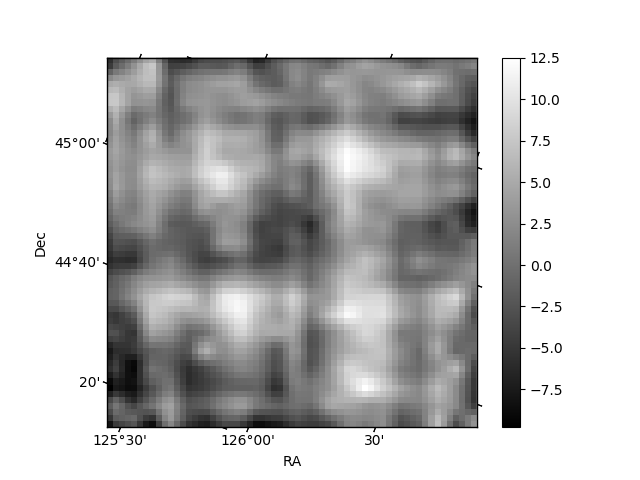
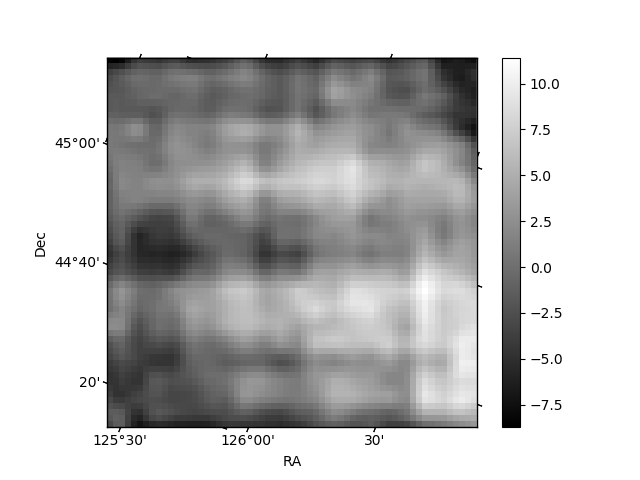
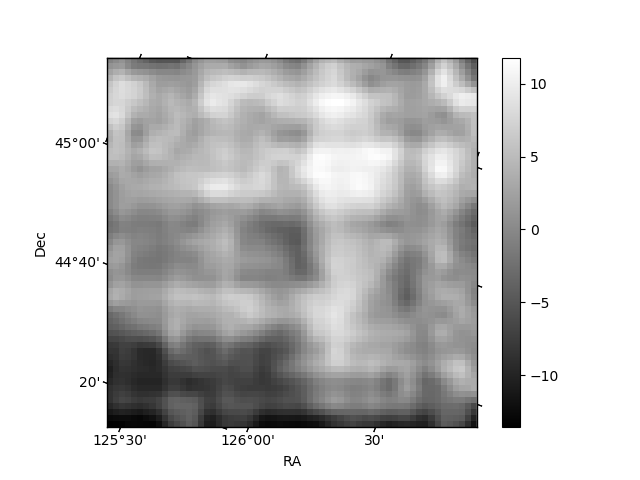
Histogram calculated using DETX and DETY for each event in the final _common_clean file
| Quadrant A | 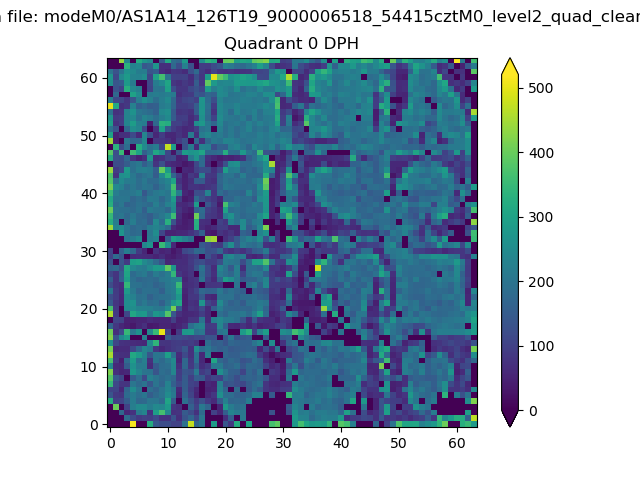 |
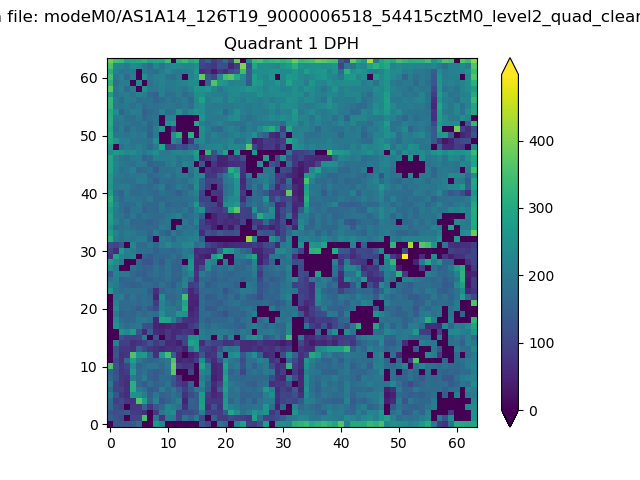 |
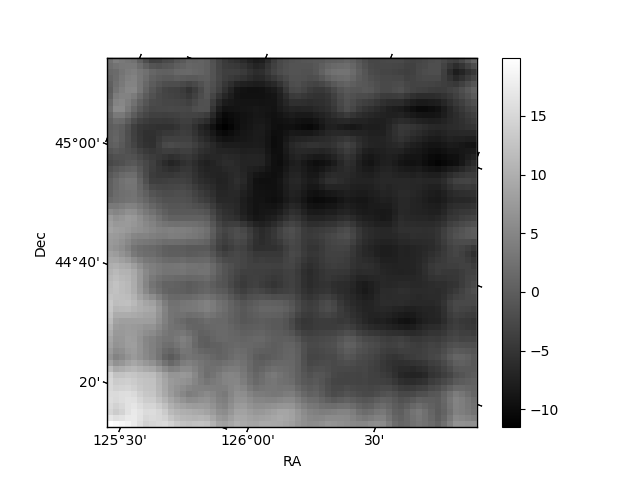
Quadrant B |
|---|---|---|---|
| Quadrant D | 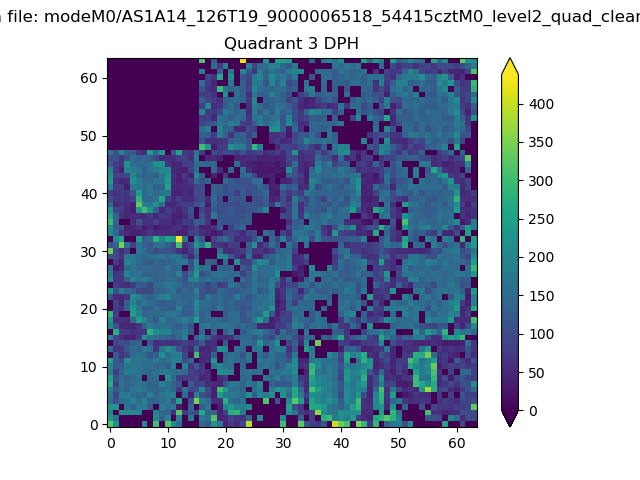 |
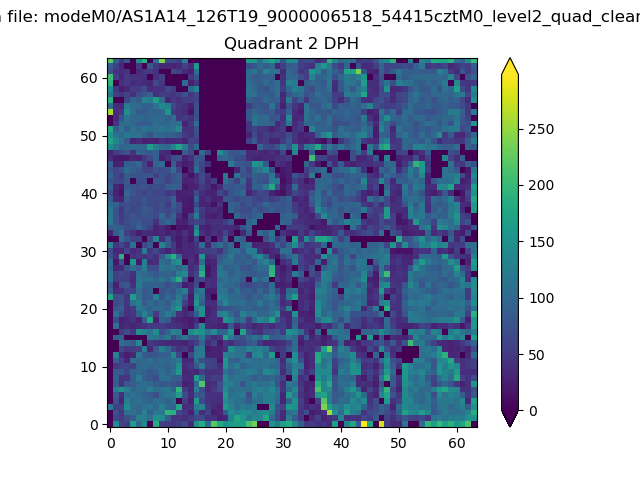 |
Quadrant C |
| Plot type | Count rate plots | Images |
|---|---|---|
| Comparison with Poisson distribution Blue bars denote a histogram of data divided into 1 sec bins. Red curve is a Poisson curve with rate = median count rate of data. |
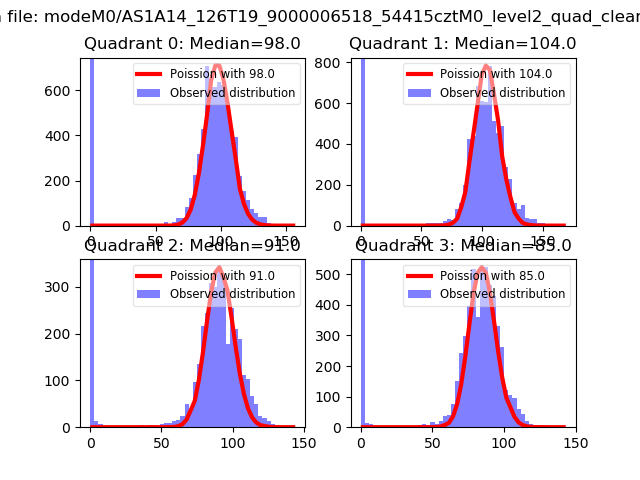 |
 |
| Quadrant-wise count rates Data is divided into 100 sec bins |
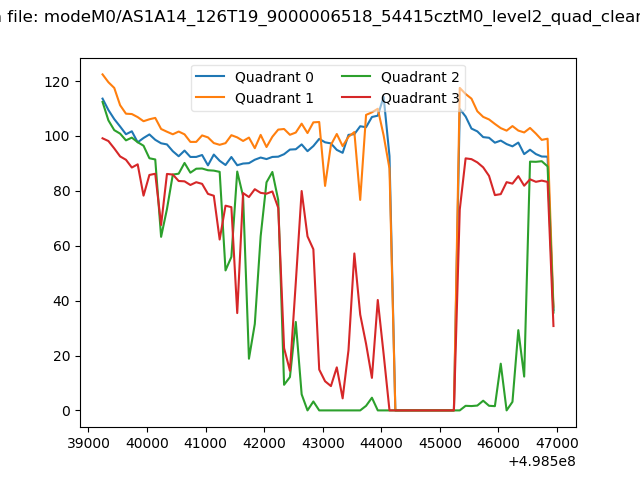 |
|
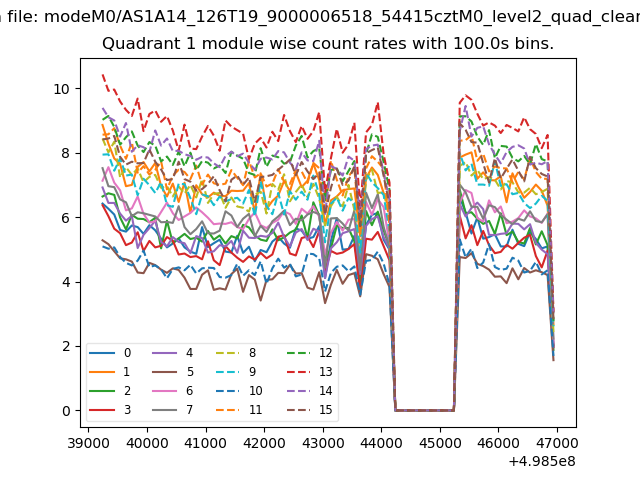
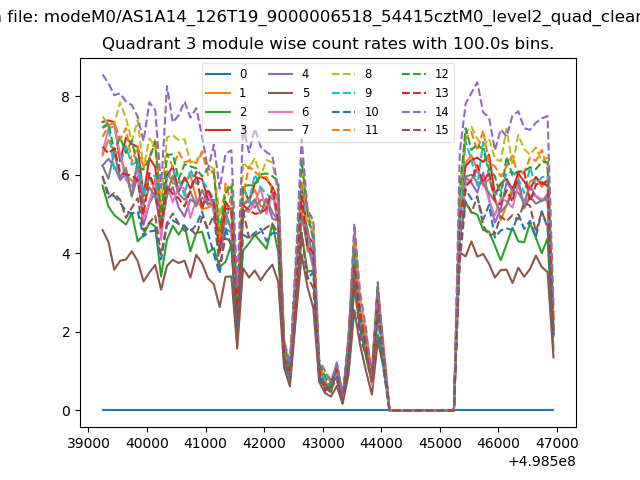
| Module-wise count rates for Quadrant A Data is divided into 100 sec bins |
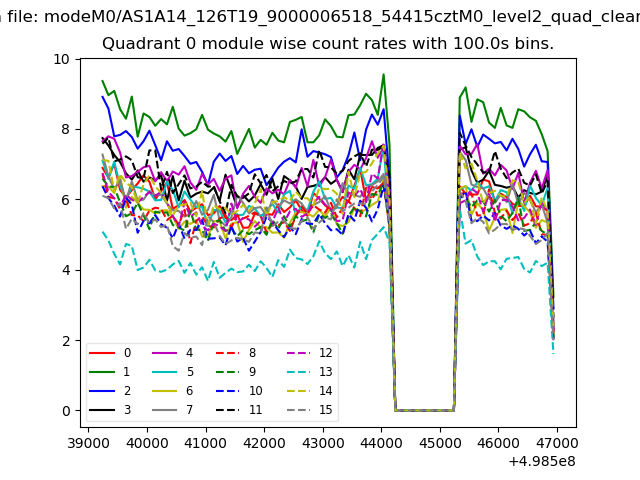 |
 |
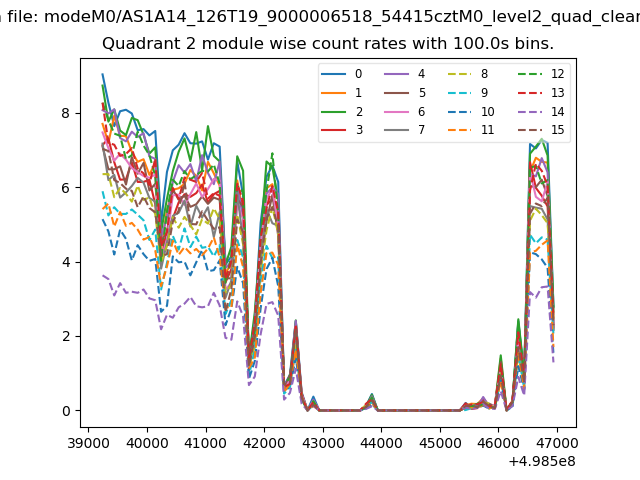
| Module-wise count rates for Quadrant B Data is divided into 100 sec bins |
 |
 |
| Module-wise count rates for Quadrant C Data is divided into 100 sec bins |
 |
 |
| Module-wise count rates for Quadrant D Data is divided into 100 sec bins |
 |
 |
| Parameter | Plot |
|---|---|
| CZT HV Monitor | 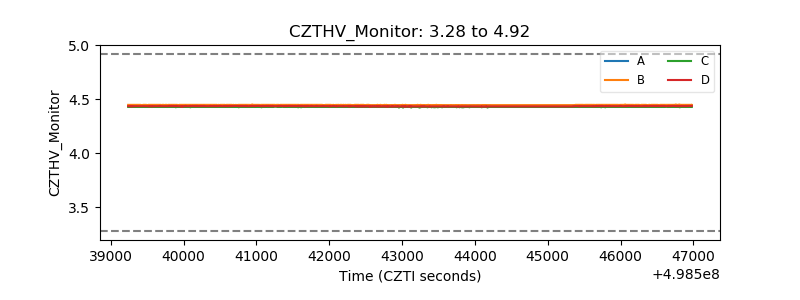 |
| D_VDD | 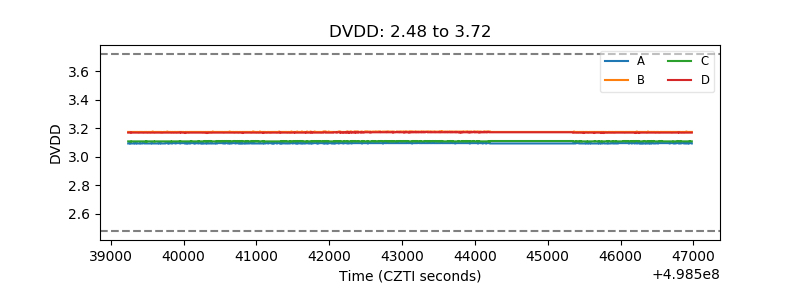 |
| Temperature 1 | 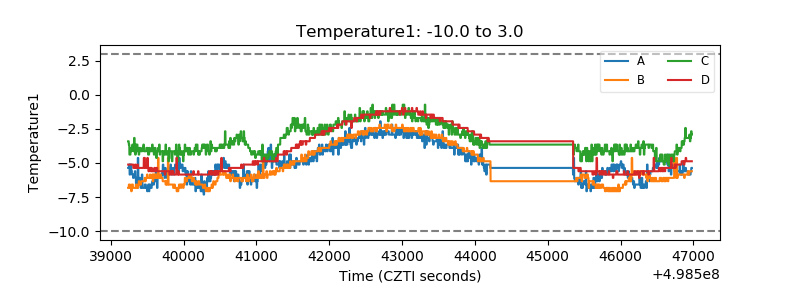 |
| Veto HV Monitor | 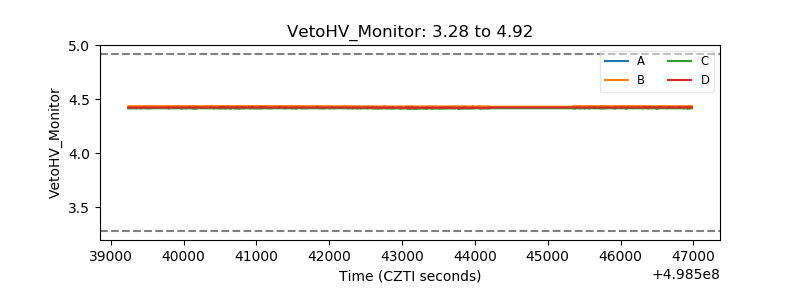 |
| Veto LLD | 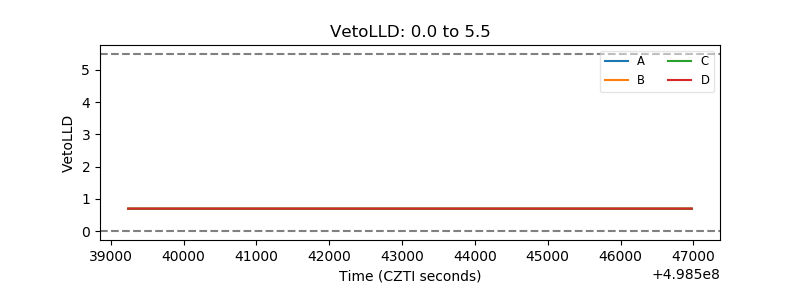 |
| Alpha Counter | 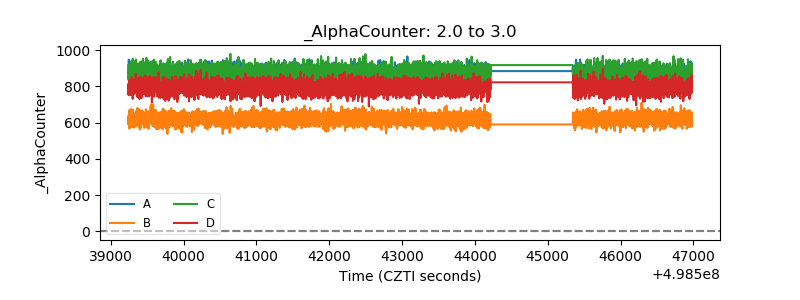 |
| _CPM_Rate | 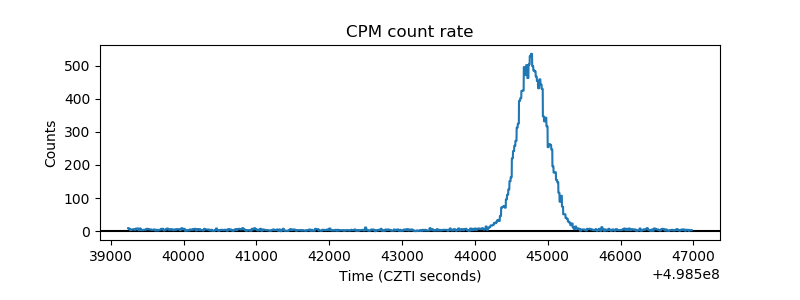 |
| CZT Counter | 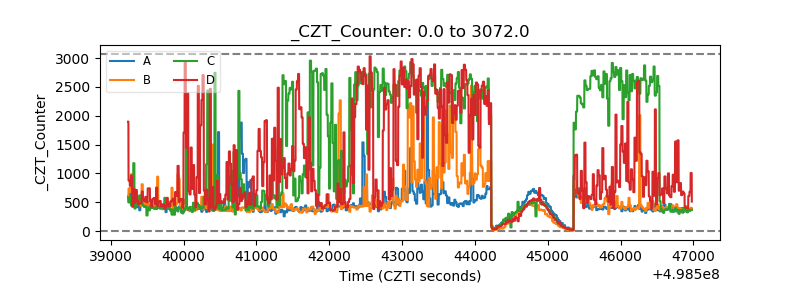 |
| +2.5 Volts monitor |  |
| +5 Volts monitor |  |
| _ROLL_ROT | 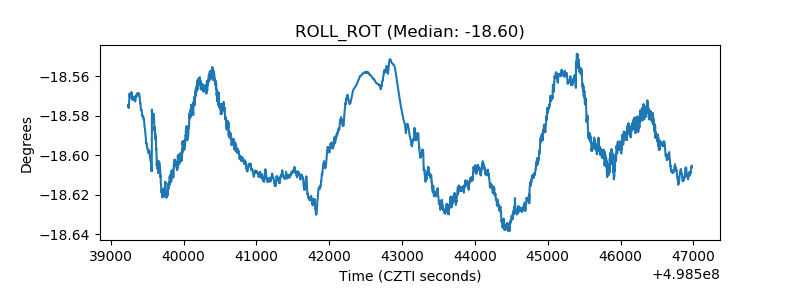 |
| _Roll_DEC | 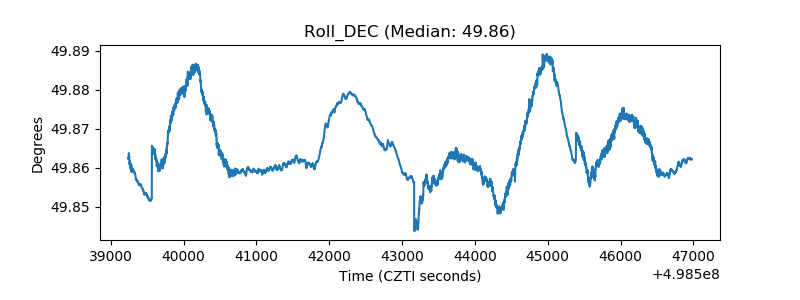 |
| _Roll_RA | 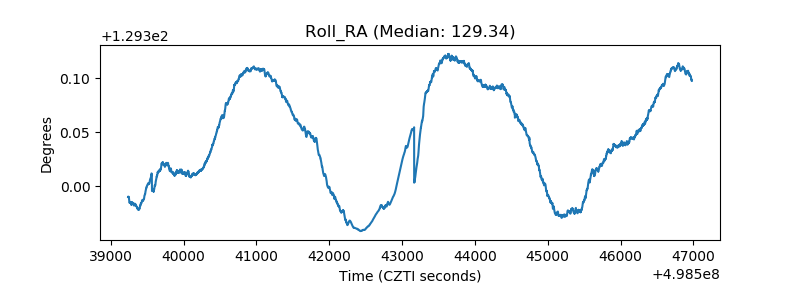 |
| Veto Counter | 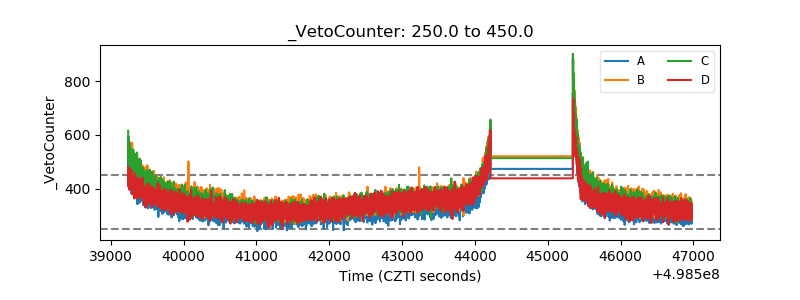 |