| Param | Original file | Final file |
|---|---|---|
| Filename | modeM0/AS1A14_126T19_9000006518_54417cztM0_level2.fits | modeM0/AS1A14_126T19_9000006518_54417cztM0_level2_quad_clean.evt |
| Size (bytes) | 448,623,360 | 91,054,080 |
| Size | 427.8 MB | 86.8 MB |
| Events in quadrant A | 2,832,764 | 612,414 |
| Events in quadrant B | 3,050,495 | 649,461 |
| Events in quadrant C | 4,100,202 | 553,045 |
| Events in quadrant D | 6,116,636 | 488,217 |
| Mode SS | |||
|---|---|---|---|
| Quadrant | BADHDUFLAG | Total packets | Discarded packets |
| A | 0 | 132 | 0 |
| B | 0 | 132 | 0 |
| C | 0 | 132 | 0 |
| D | 0 | 132 | 0 |
| Mode M0 | |||
|---|---|---|---|
| Quadrant | BADHDUFLAG | Total packets | Discarded packets |
| A | 0 | 13399 | 1 |
| B | 0 | 13996 | 1 |
| C | 0 | 17078 | 1 |
| D | 0 | 22683 | 1 |
| Mode M9 | |||
|---|---|---|---|
| Quadrant | BADHDUFLAG | Total packets | Discarded packets |
| A | 0 | 8 | 0 |
| B | 0 | 8 | 0 |
| C | 0 | 8 | 0 |
| D | 0 | 8 | 0 |
| Quadrant | Total seconds | Saturated seconds | Saturation percentage |
|---|---|---|---|
| A | 6508 | 33 | 0.507068% |
| B | 6509 | 97 | 1.490244% |
| C | 6509 | 396 | 6.083884% |
| D | 6509 | 795 | 12.213858% |
Noise dominated data is calculated using 1-second bins in cleaned event files. If a bin has >2000 counts, and if more than 50% of those come from <1% of pixels, then it is considered to be noise-dominated and hence unusable.
| Quadrant | # 1 sec bins | Bins with >0 counts | Bins with >2000 counts | High rate bins dominated by noise | Noise dominated (total time) | Noise dominated (detector-on time) | Marked lightcurve |
|---|---|---|---|---|---|---|---|
| A | 7278 | 6508 | 2 | 2 | 0.03% | 0.03% | 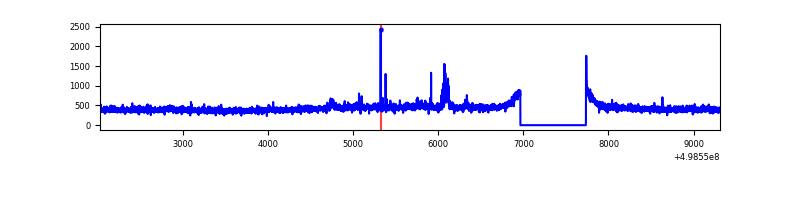 |
| B | 7279 | 6510 | 53 | 53 | 0.73% | 0.81% | 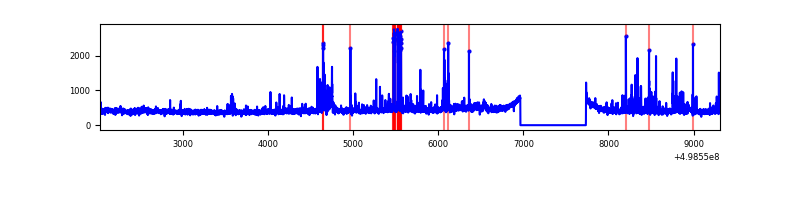 |
| C | 7279 | 6510 | 351 | 351 | 4.82% | 5.39% | 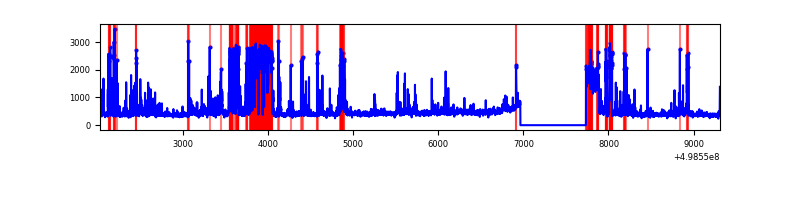 |
| D | 7279 | 6509 | 743 | 743 | 10.21% | 11.41% | 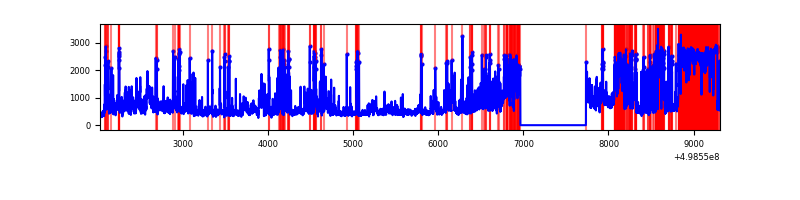 |
Top three noisy pixels from each quadrant. If the there are fewer than three noisy pixels in the level2.evt file, extra rows are filled as -1
| Pixel properties | Quadrant properties | ||||||
|---|---|---|---|---|---|---|---|
| Quadrant | DetID | PixID | Counts | Sigma | Mean | Median | Sigma |
| A | 11 | 3 | 99540 | 586.47 | 682 | 663 | 168.6 |
| A | 7 | 206 | 44235 | 258.44 | 682 | 663 | 168.6 |
| A | 4 | 3 | 28755 | 166.62 | 682 | 663 | 168.6 |
| B | 0 | 213 | 227456 | 1561.06 | 668 | 643 | 145.3 |
| B | 10 | 247 | 79132 | 540.21 | 668 | 643 | 145.3 |
| B | 0 | 197 | 36862 | 249.28 | 668 | 643 | 145.3 |
| C | 1 | 241 | 727190 | 4103.03 | 643 | 636 | 177.1 |
| C | 13 | 3 | 360942 | 2034.74 | 643 | 636 | 177.1 |
| C | 4 | 5 | 312567 | 1761.55 | 643 | 636 | 177.1 |
| D | 8 | 176 | 1948044 | 11325.74 | 607 | 579 | 172.0 |
| D | 7 | 70 | 1088451 | 6326.66 | 607 | 579 | 172.0 |
| D | 3 | 12 | 516670 | 3001.4 | 607 | 579 | 172.0 |
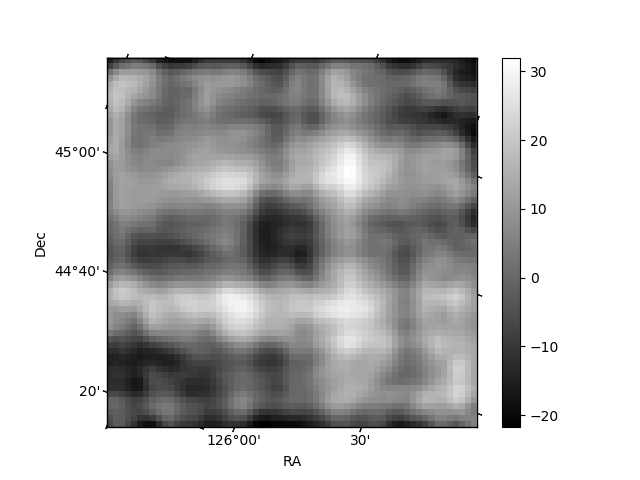
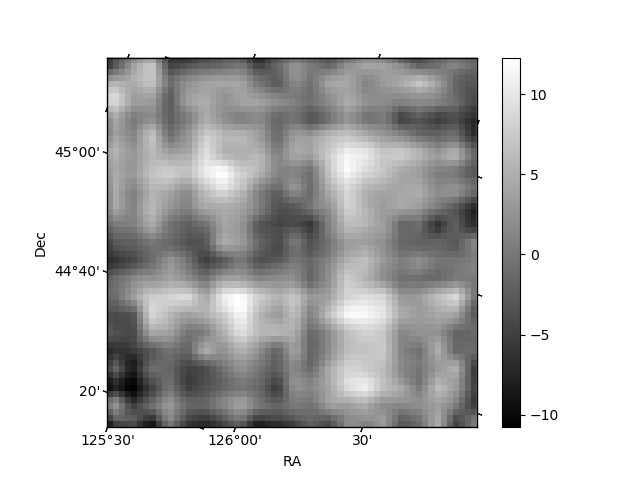
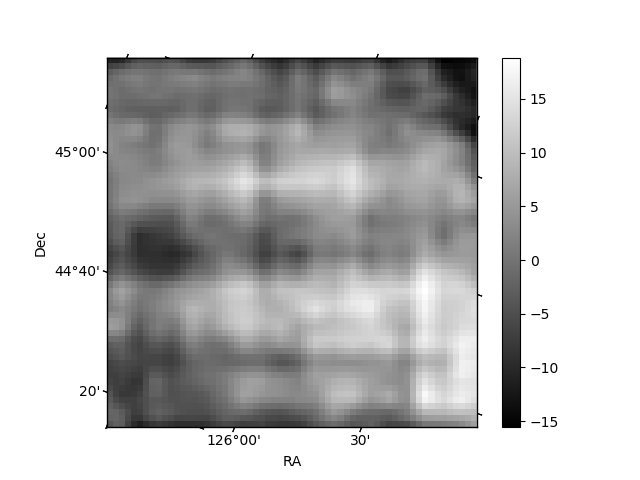
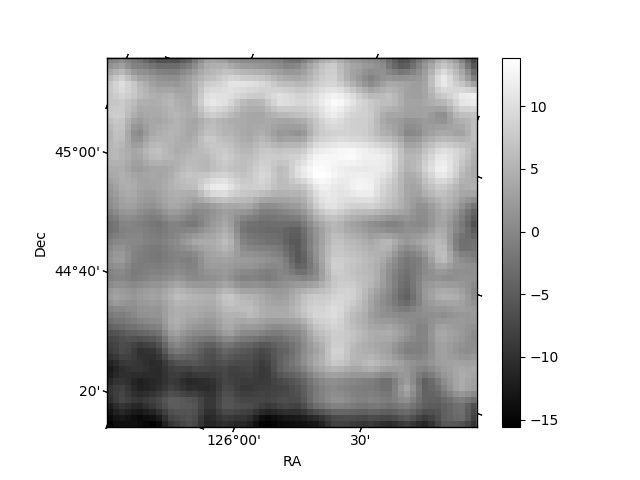
Histogram calculated using DETX and DETY for each event in the final _common_clean file
| Quadrant A | 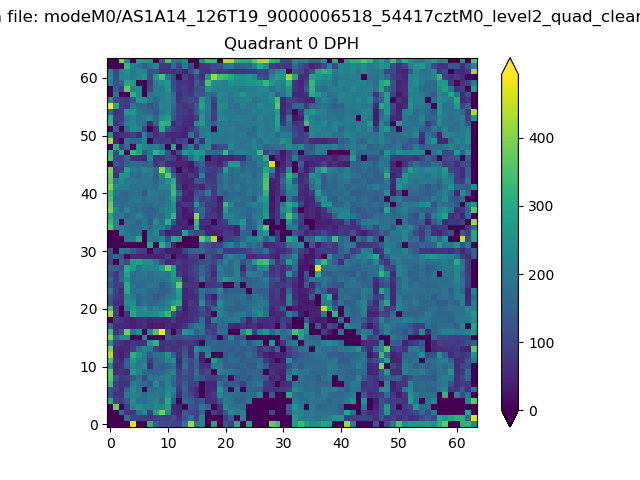 |
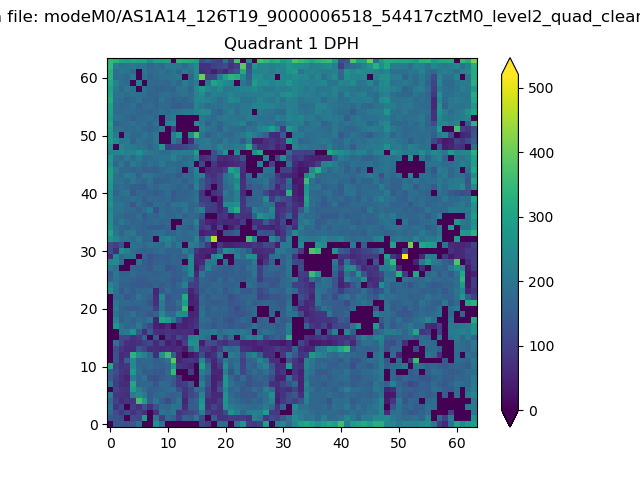 |
Quadrant B |
|---|---|---|---|
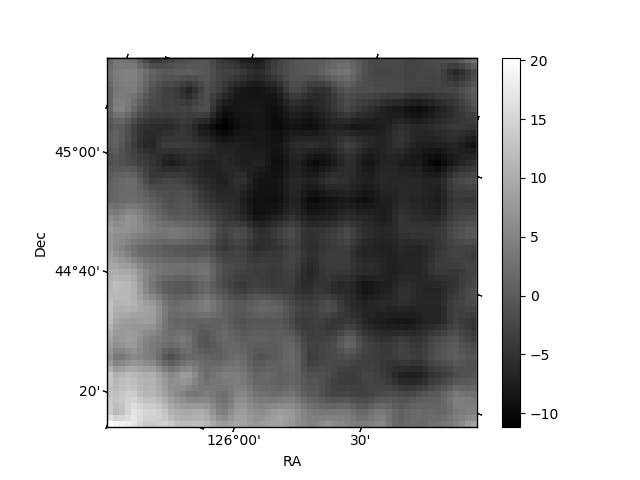
| Quadrant D | 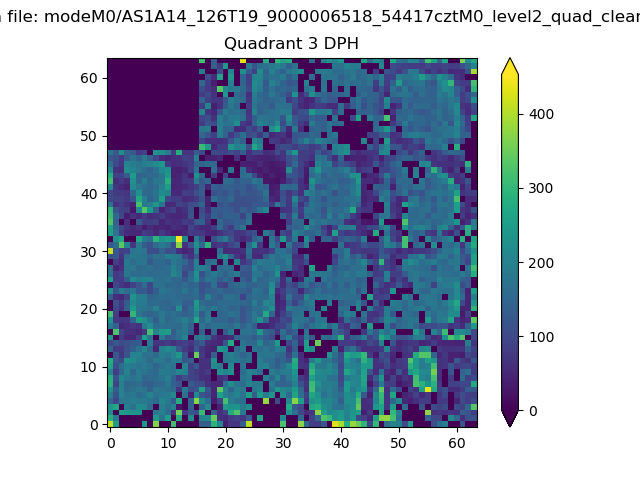 |
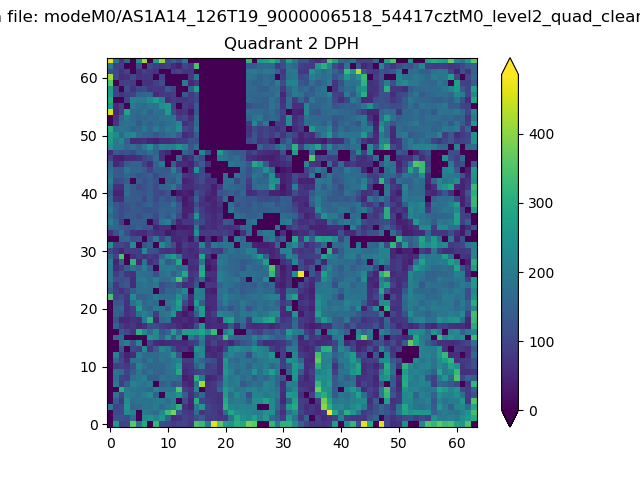 |
Quadrant C |
| Plot type | Count rate plots | Images |
|---|---|---|
| Comparison with Poisson distribution Blue bars denote a histogram of data divided into 1 sec bins. Red curve is a Poisson curve with rate = median count rate of data. |
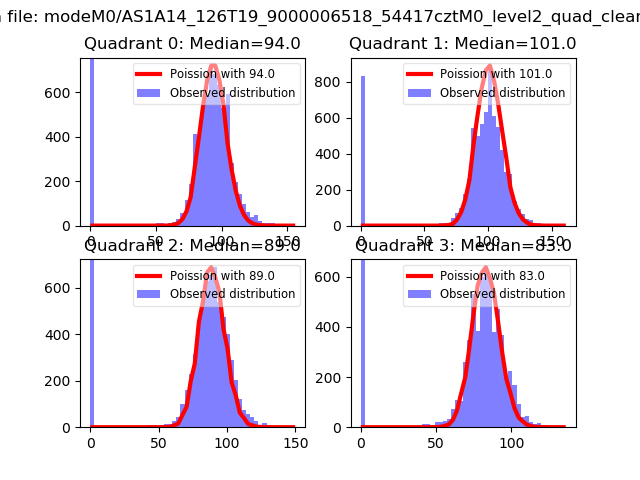 |
 |
| Quadrant-wise count rates Data is divided into 100 sec bins |
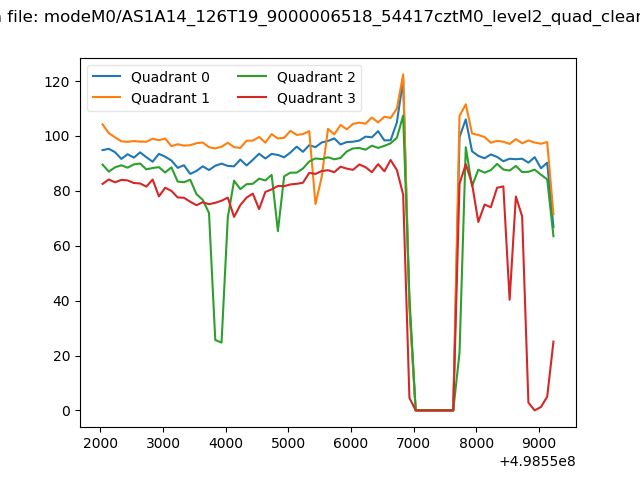 |
|
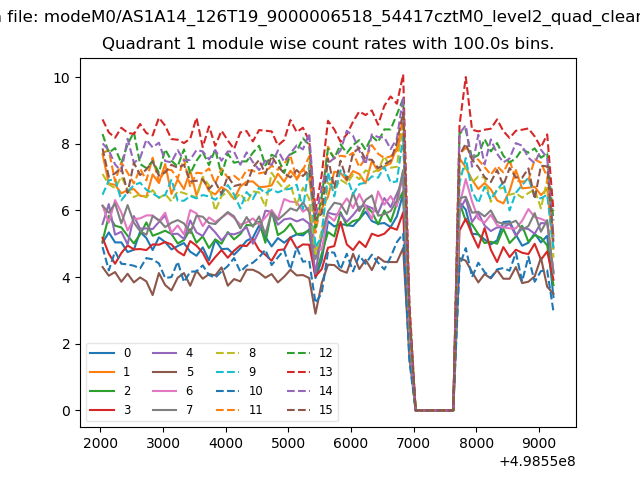
| Module-wise count rates for Quadrant A Data is divided into 100 sec bins |
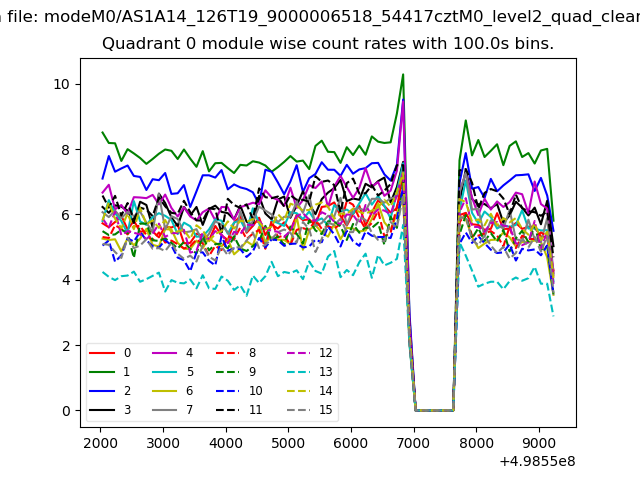 |
 |
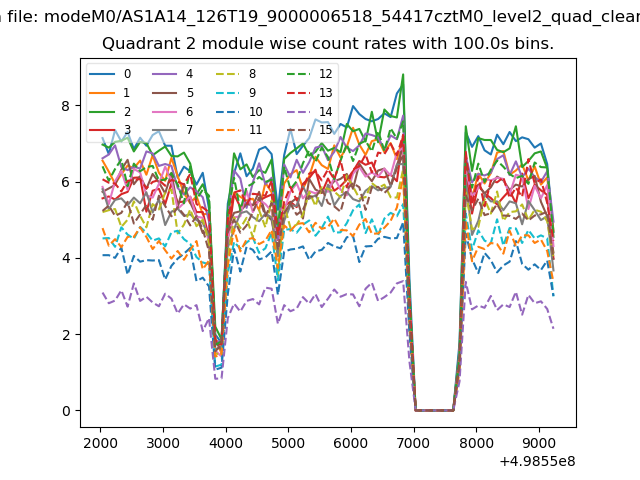
| Module-wise count rates for Quadrant B Data is divided into 100 sec bins |
 |
 |
| Module-wise count rates for Quadrant C Data is divided into 100 sec bins |
 |
 |
| Module-wise count rates for Quadrant D Data is divided into 100 sec bins |
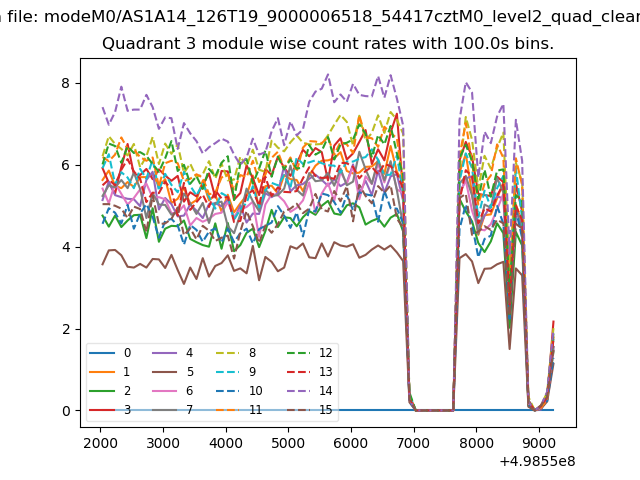 |
 |
| Parameter | Plot |
|---|---|
| CZT HV Monitor | 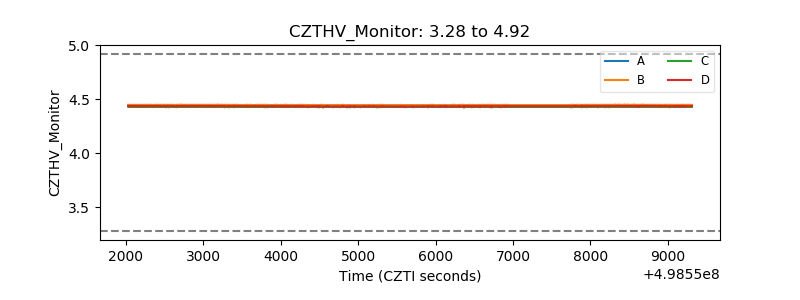 |
| D_VDD | 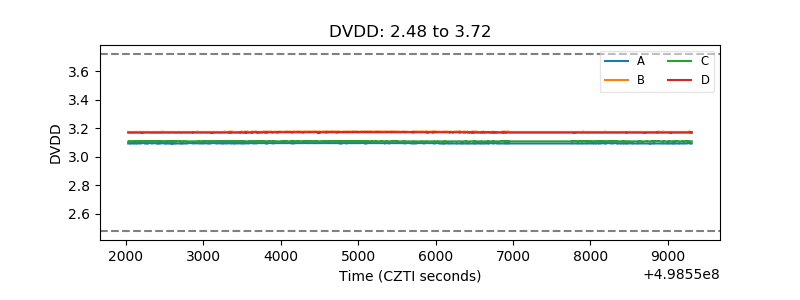 |
| Temperature 1 | 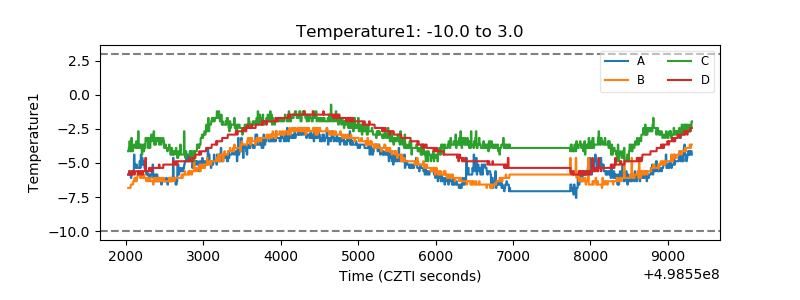 |
| Veto HV Monitor | 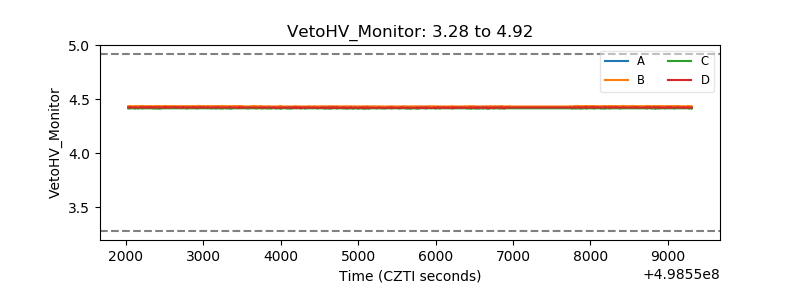 |
| Veto LLD | 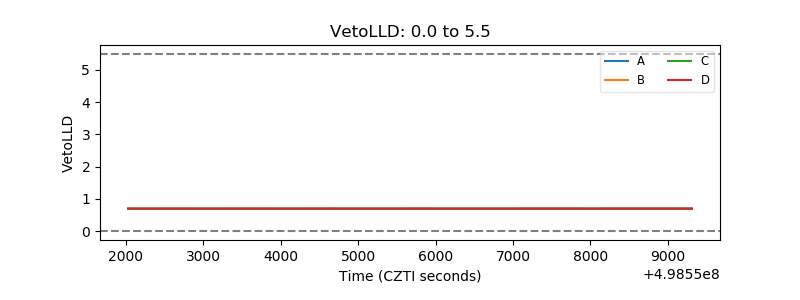 |
| Alpha Counter | 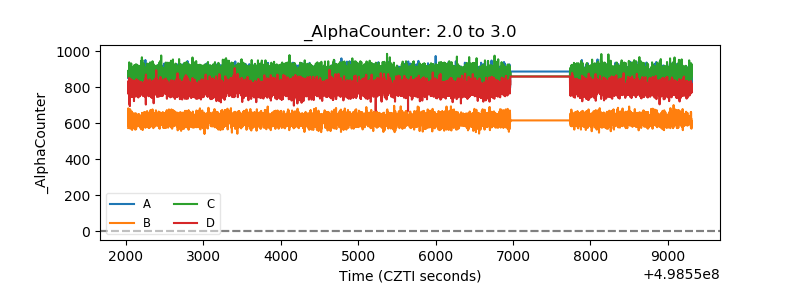 |
| _CPM_Rate | 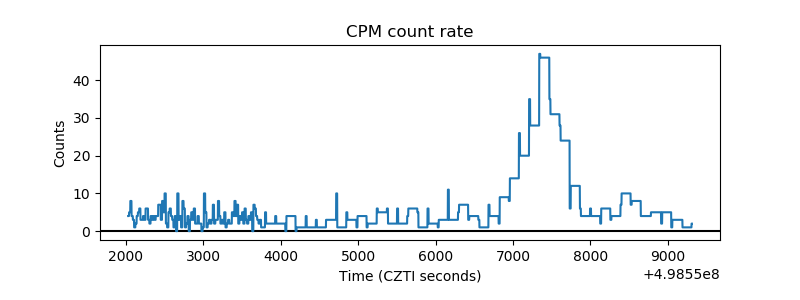 |
| CZT Counter | 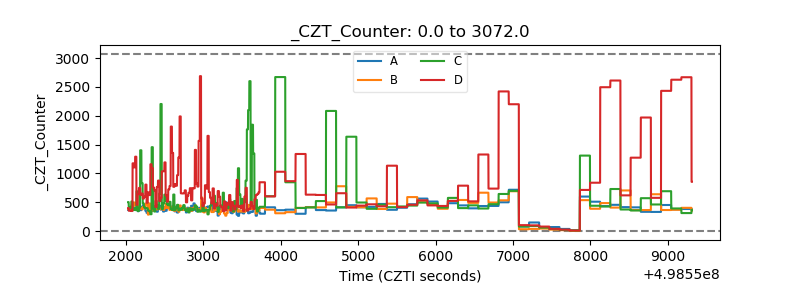 |
| +2.5 Volts monitor | 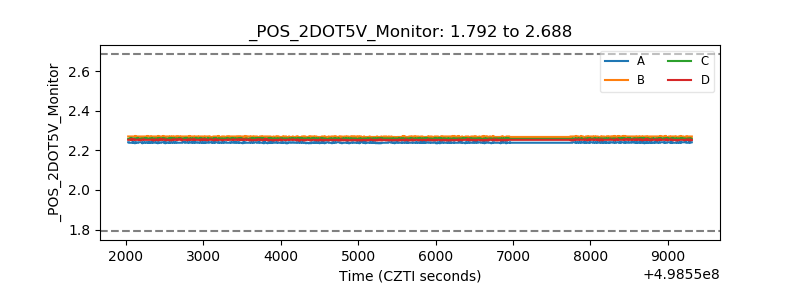 |
| +5 Volts monitor | 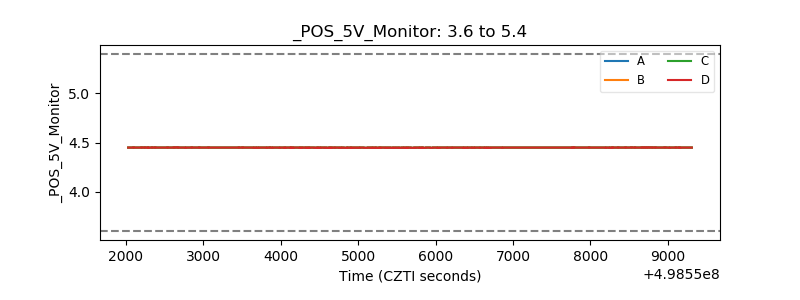 |
| _ROLL_ROT | 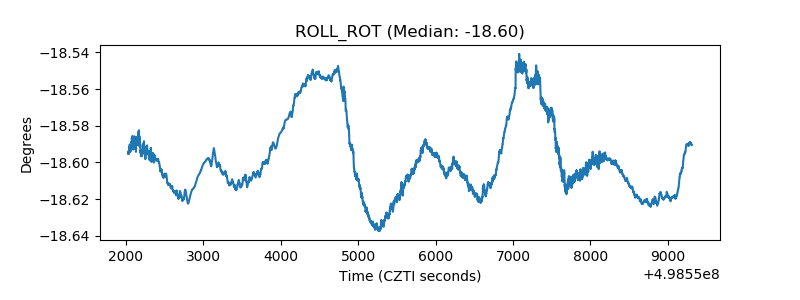 |
| _Roll_DEC | 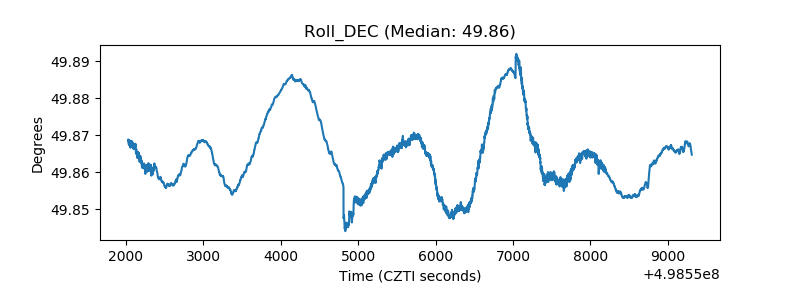 |
| _Roll_RA | 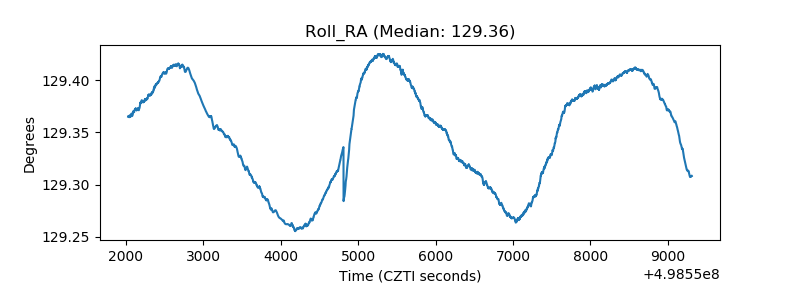 |
| Veto Counter | 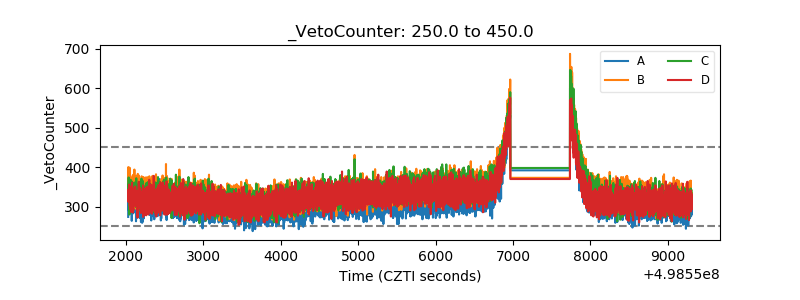 |