| Param | Original file | Final file |
|---|---|---|
| Filename | modeM0/AS1A14_126T19_9000006518_54418cztM0_level2.fits | modeM0/AS1A14_126T19_9000006518_54418cztM0_level2_quad_clean.evt |
| Size (bytes) | 551,422,080 | 93,879,360 |
| Size | 525.9 MB | 89.5 MB |
| Events in quadrant A | 3,381,555 | 639,801 |
| Events in quadrant B | 3,474,107 | 682,608 |
| Events in quadrant C | 3,672,242 | 616,289 |
| Events in quadrant D | 9,342,832 | 418,963 |
| Mode SS | |||
|---|---|---|---|
| Quadrant | BADHDUFLAG | Total packets | Discarded packets |
| A | 0 | 140 | 0 |
| B | 0 | 140 | 0 |
| C | 0 | 140 | 0 |
| D | 0 | 140 | 0 |
| Mode M0 | |||
|---|---|---|---|
| Quadrant | BADHDUFLAG | Total packets | Discarded packets |
| A | 0 | 15137 | 0 |
| B | 0 | 15563 | 0 |
| C | 0 | 16311 | 0 |
| D | 0 | 32615 | 0 |
| Quadrant | Total seconds | Saturated seconds | Saturation percentage |
|---|---|---|---|
| A | 6956 | 210 | 3.018976% |
| B | 6955 | 271 | 3.896477% |
| C | 6956 | 189 | 2.717079% |
| D | 6956 | 2250 | 32.346176% |
Noise dominated data is calculated using 1-second bins in cleaned event files. If a bin has >2000 counts, and if more than 50% of those come from <1% of pixels, then it is considered to be noise-dominated and hence unusable.
| Quadrant | # 1 sec bins | Bins with >0 counts | Bins with >2000 counts | High rate bins dominated by noise | Noise dominated (total time) | Noise dominated (detector-on time) | Marked lightcurve |
|---|---|---|---|---|---|---|---|
| A | 6956 | 6956 | 21 | 21 | 0.30% | 0.30% | 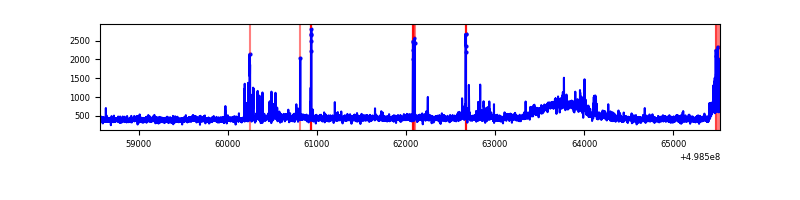 |
| B | 6955 | 6955 | 59 | 59 | 0.85% | 0.85% | 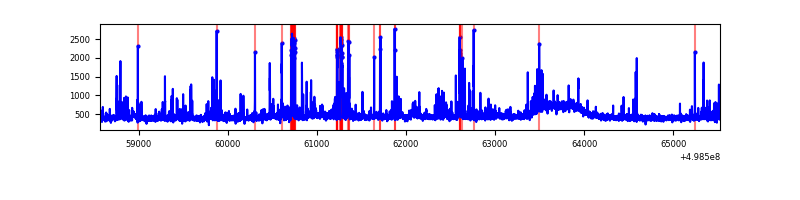 |
| C | 6956 | 6956 | 115 | 115 | 1.65% | 1.65% | 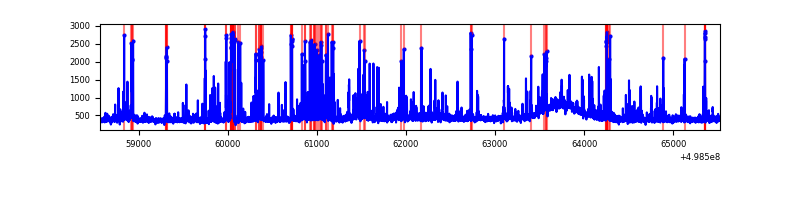 |
| D | 6956 | 6956 | 2160 | 2160 | 31.05% | 31.05% | 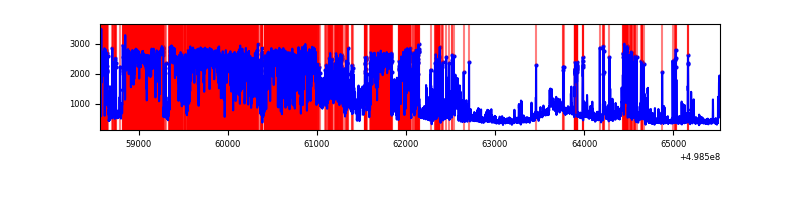 |
Top three noisy pixels from each quadrant. If the there are fewer than three noisy pixels in the level2.evt file, extra rows are filled as -1
| Pixel properties | Quadrant properties | ||||||
|---|---|---|---|---|---|---|---|
| Quadrant | DetID | PixID | Counts | Sigma | Mean | Median | Sigma |
| A | 11 | 3 | 130447 | 697.33 | 756 | 738 | 186.0 |
| A | 7 | 206 | 120459 | 643.64 | 756 | 738 | 186.0 |
| A | 0 | 8 | 65056 | 345.78 | 756 | 738 | 186.0 |
| B | 10 | 247 | 174131 | 1088.16 | 738 | 709 | 159.4 |
| B | 5 | 185 | 160324 | 1001.53 | 738 | 709 | 159.4 |
| B | 0 | 213 | 136938 | 854.79 | 738 | 709 | 159.4 |
| C | 13 | 3 | 297076 | 1512.27 | 725 | 719 | 196.0 |
| C | 1 | 241 | 267052 | 1359.07 | 725 | 719 | 196.0 |
| C | 14 | 254 | 159877 | 812.16 | 725 | 719 | 196.0 |
| D | 8 | 176 | 4225480 | 24612.12 | 607 | 577 | 171.7 |
| D | 7 | 70 | 1155308 | 6726.87 | 607 | 577 | 171.7 |
| D | 3 | 12 | 911854 | 5308.63 | 607 | 577 | 171.7 |
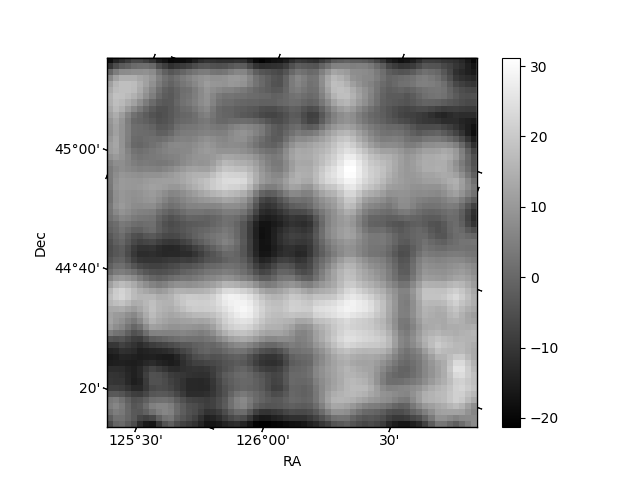
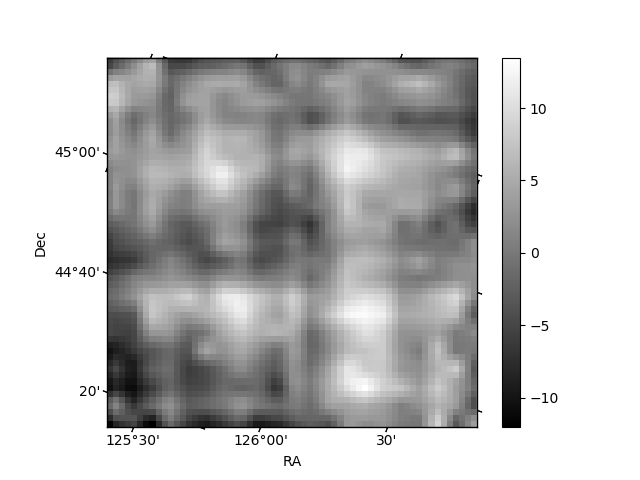
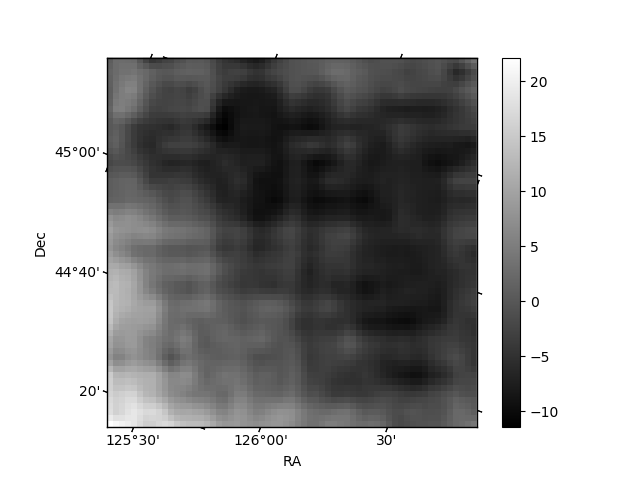
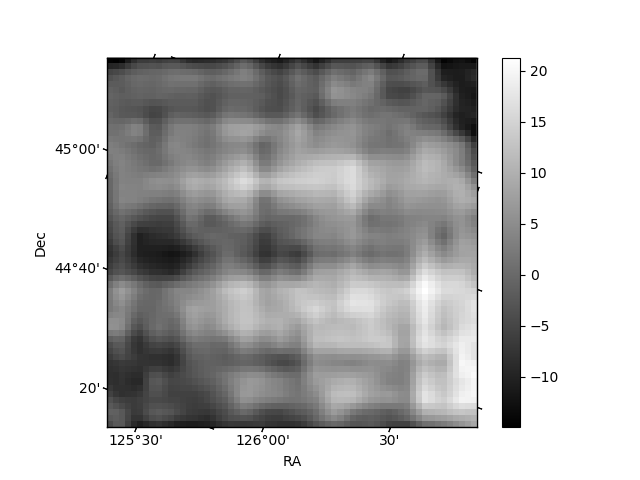
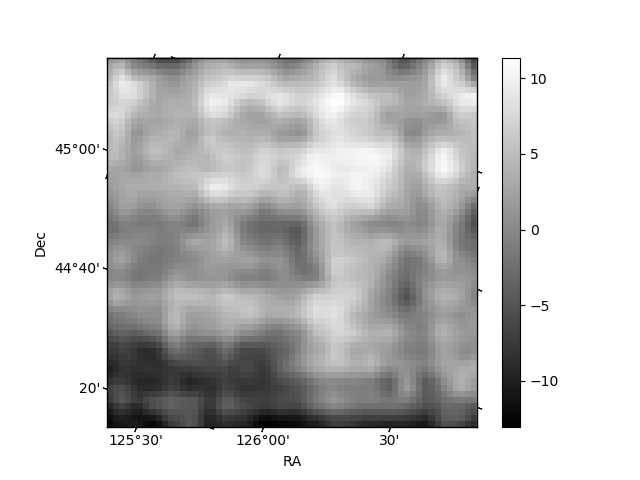
Histogram calculated using DETX and DETY for each event in the final _common_clean file
| Quadrant A | 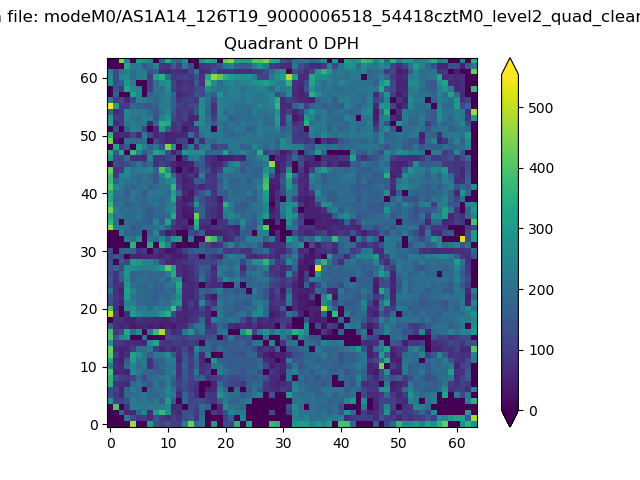 |
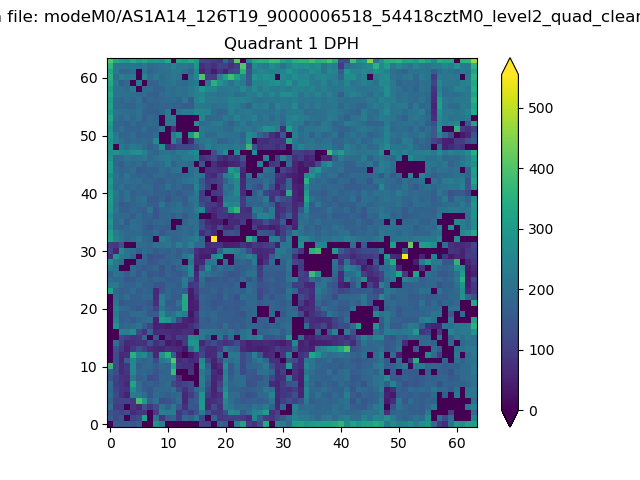 |
Quadrant B |
|---|---|---|---|
| Quadrant D | 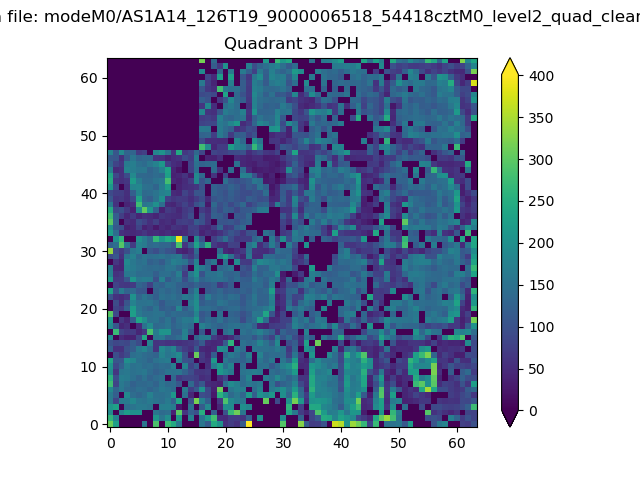 |
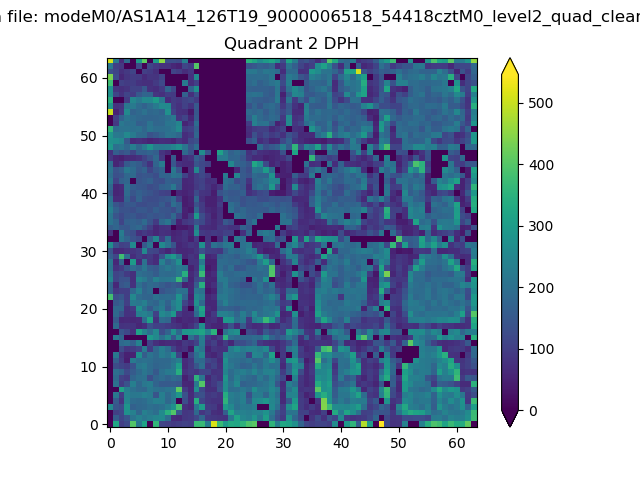 |
Quadrant C |
| Plot type | Count rate plots | Images |
|---|---|---|
| Comparison with Poisson distribution Blue bars denote a histogram of data divided into 1 sec bins. Red curve is a Poisson curve with rate = median count rate of data. |
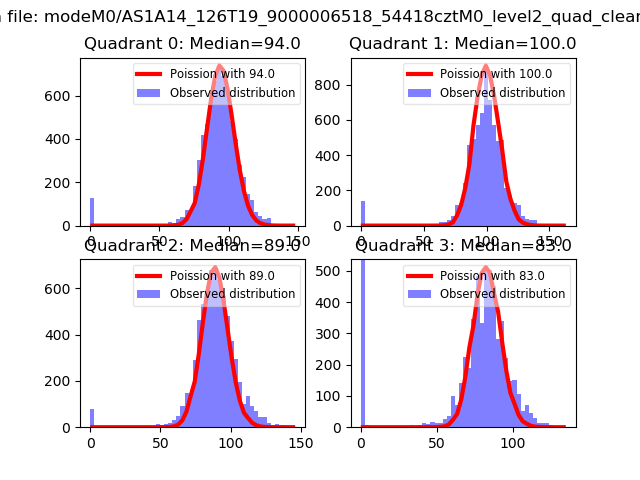 |
 |
| Quadrant-wise count rates Data is divided into 100 sec bins |
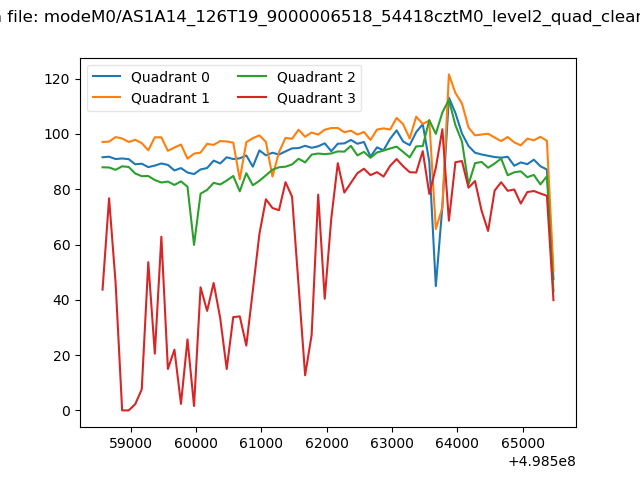 |
|
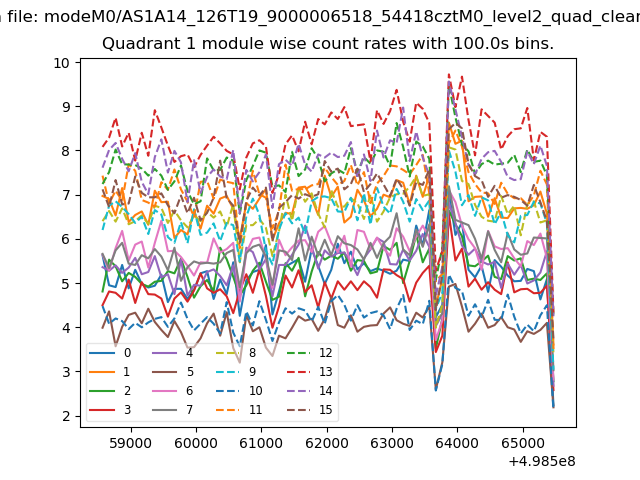
| Module-wise count rates for Quadrant A Data is divided into 100 sec bins |
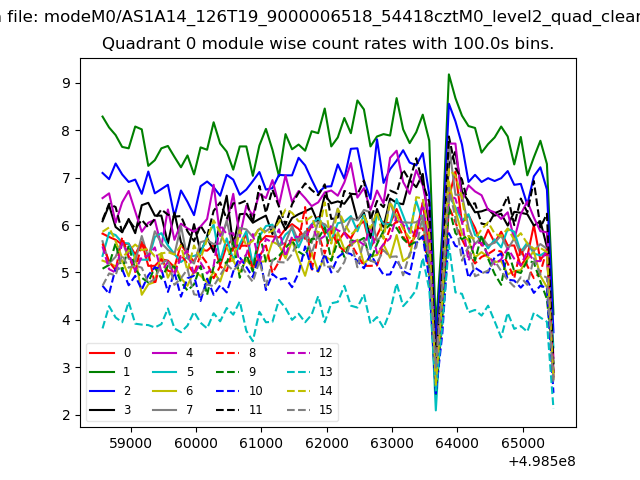 |
 |
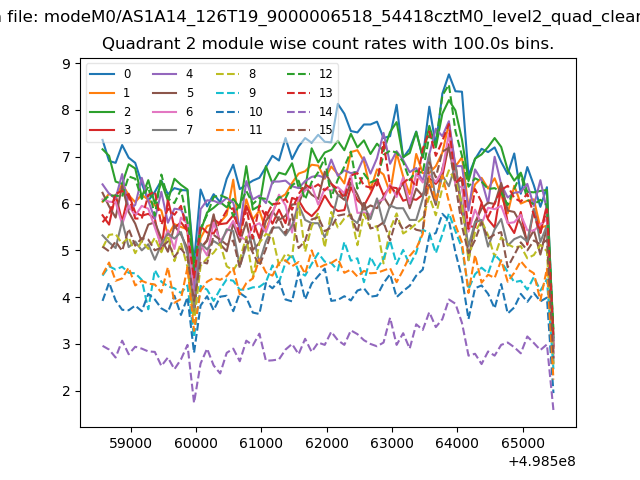
| Module-wise count rates for Quadrant B Data is divided into 100 sec bins |
 |
 |
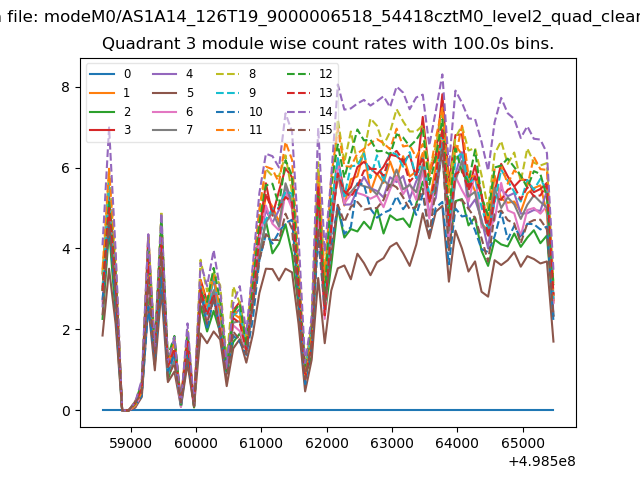
| Module-wise count rates for Quadrant C Data is divided into 100 sec bins |
 |
 |
| Module-wise count rates for Quadrant D Data is divided into 100 sec bins |
 |
 |
| Parameter | Plot |
|---|---|
| CZT HV Monitor |  |
| D_VDD | 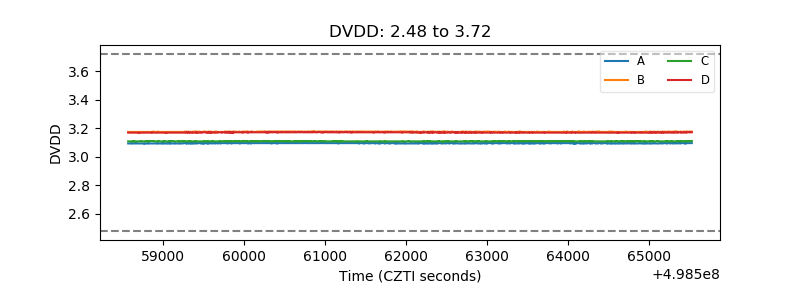 |
| Temperature 1 | 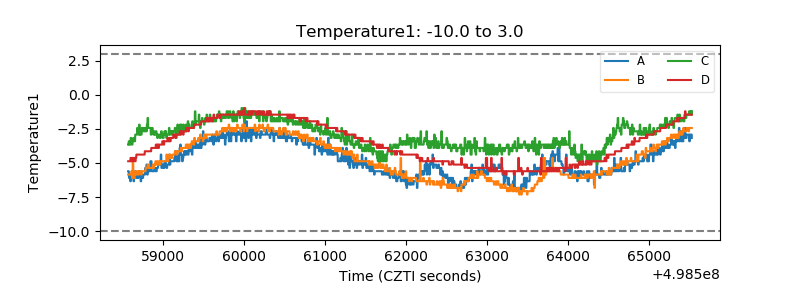 |
| Veto HV Monitor | 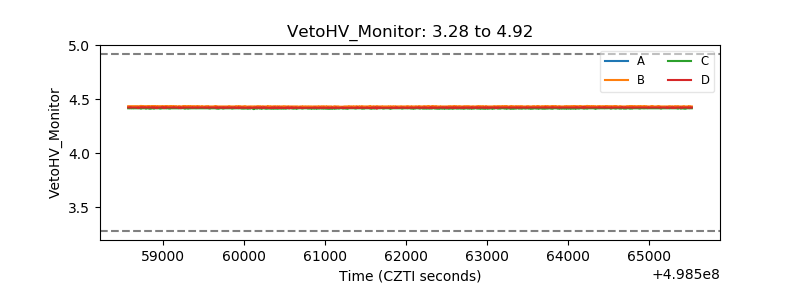 |
| Veto LLD | 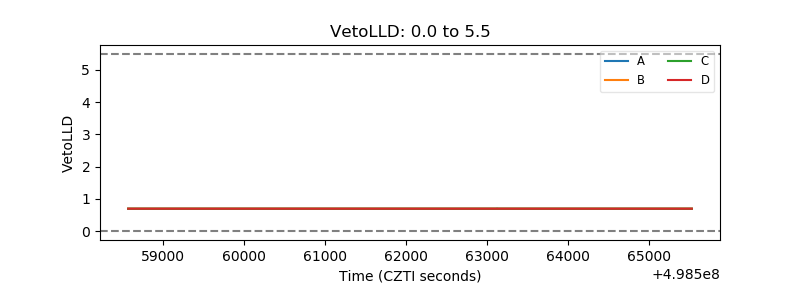 |
| Alpha Counter | 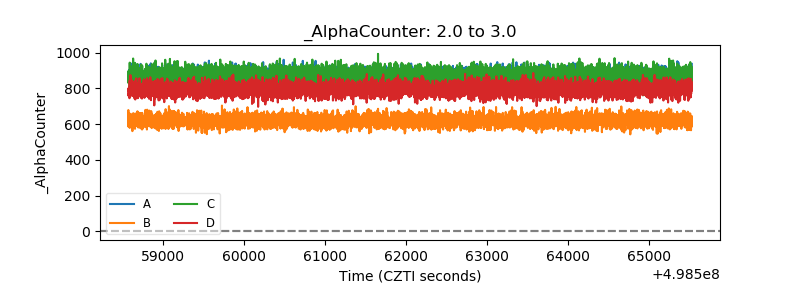 |
| _CPM_Rate | 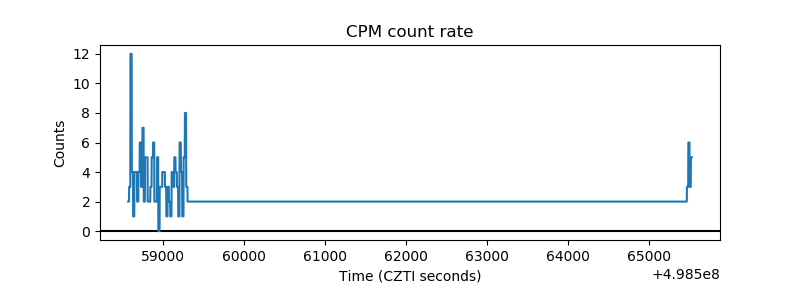 |
| CZT Counter | 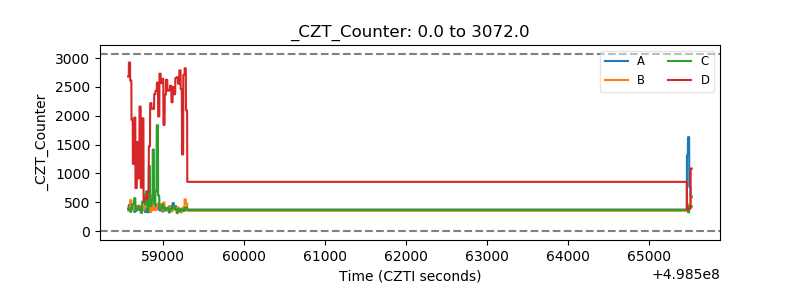 |
| +2.5 Volts monitor |  |
| +5 Volts monitor |  |
| _ROLL_ROT | 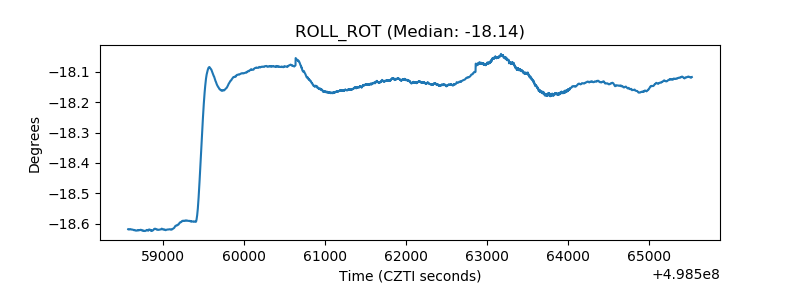 |
| _Roll_DEC | 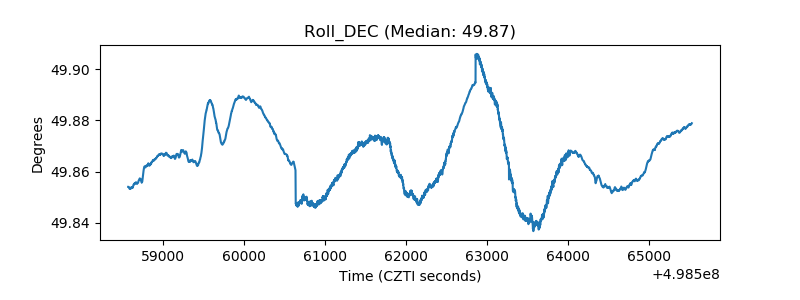 |
| _Roll_RA | 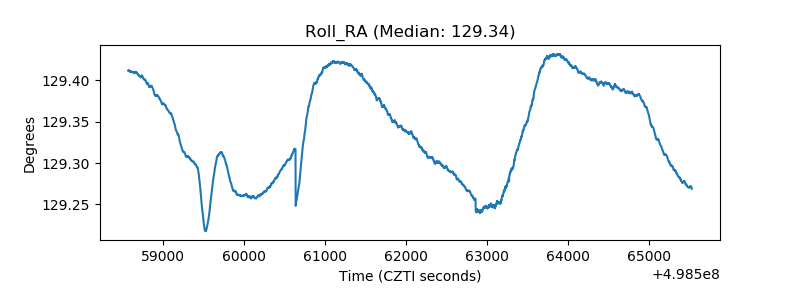 |
| Veto Counter | 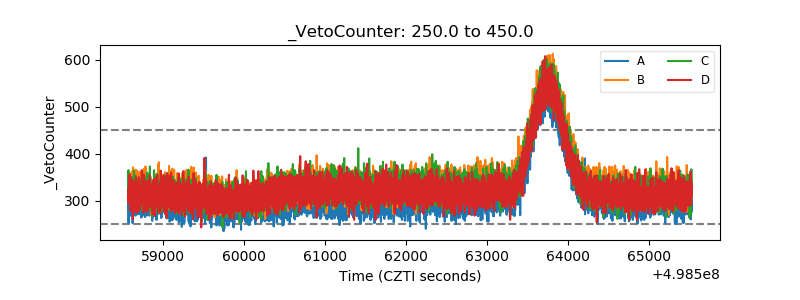 |