| Param | Original file | Final file |
|---|---|---|
| Filename | modeM0/AS1A14_126T19_9000006518_54419cztM0_level2.fits | modeM0/AS1A14_126T19_9000006518_54419cztM0_level2_quad_clean.evt |
| Size (bytes) | 631,779,840 | 94,916,160 |
| Size | 602.5 MB | 90.5 MB |
| Events in quadrant A | 3,711,993 | 674,611 |
| Events in quadrant B | 3,431,131 | 721,065 |
| Events in quadrant C | 4,341,865 | 610,306 |
| Events in quadrant D | 11,334,301 | 359,634 |
| Mode SS | |||
|---|---|---|---|
| Quadrant | BADHDUFLAG | Total packets | Discarded packets |
| A | 0 | 146 | 0 |
| B | 0 | 146 | 0 |
| C | 0 | 146 | 0 |
| D | 0 | 146 | 0 |
| Mode M0 | |||
|---|---|---|---|
| Quadrant | BADHDUFLAG | Total packets | Discarded packets |
| A | 0 | 16247 | 0 |
| B | 0 | 15641 | 0 |
| C | 0 | 18434 | 0 |
| D | 0 | 38745 | 0 |
| Quadrant | Total seconds | Saturated seconds | Saturation percentage |
|---|---|---|---|
| A | 7300 | 29 | 0.397260% |
| B | 7300 | 36 | 0.493151% |
| C | 7300 | 382 | 5.232877% |
| D | 7300 | 3124 | 42.794521% |
Noise dominated data is calculated using 1-second bins in cleaned event files. If a bin has >2000 counts, and if more than 50% of those come from <1% of pixels, then it is considered to be noise-dominated and hence unusable.
| Quadrant | # 1 sec bins | Bins with >0 counts | Bins with >2000 counts | High rate bins dominated by noise | Noise dominated (total time) | Noise dominated (detector-on time) | Marked lightcurve |
|---|---|---|---|---|---|---|---|
| A | 7300 | 7300 | 21 | 21 | 0.29% | 0.29% | 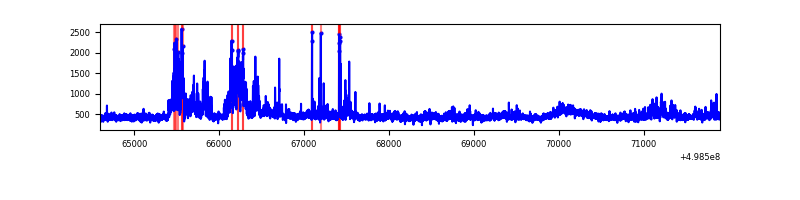 |
| B | 7300 | 7300 | 30 | 30 | 0.41% | 0.41% | 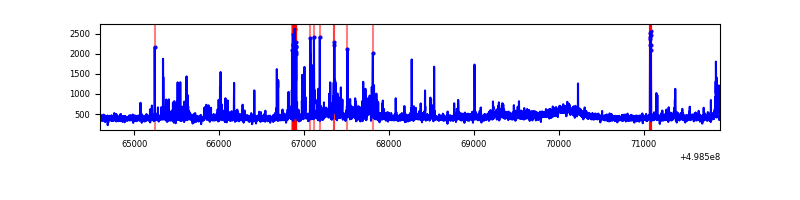 |
| C | 7300 | 7300 | 387 | 387 | 5.30% | 5.30% | 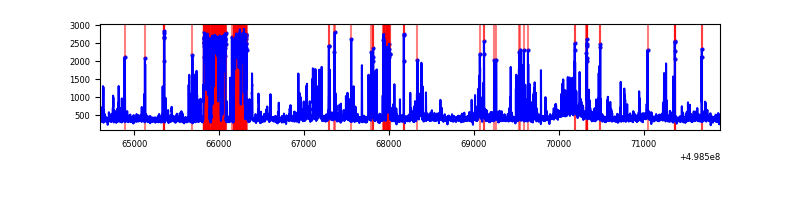 |
| D | 7299 | 7299 | 3009 | 3009 | 41.22% | 41.22% | 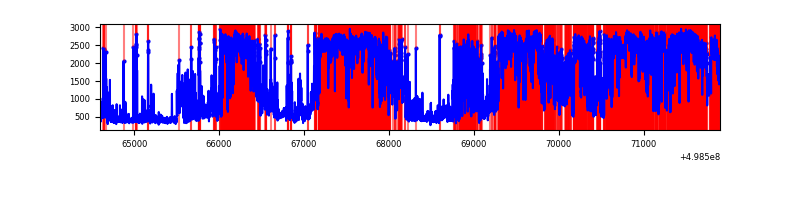 |
Top three noisy pixels from each quadrant. If the there are fewer than three noisy pixels in the level2.evt file, extra rows are filled as -1
| Pixel properties | Quadrant properties | ||||||
|---|---|---|---|---|---|---|---|
| Quadrant | DetID | PixID | Counts | Sigma | Mean | Median | Sigma |
| A | 7 | 206 | 505049 | 2680.44 | 758 | 739 | 188.1 |
| A | 11 | 3 | 72509 | 381.46 | 758 | 739 | 188.1 |
| A | 0 | 8 | 69748 | 366.79 | 758 | 739 | 188.1 |
| B | 5 | 185 | 157780 | 977.06 | 747 | 719 | 160.7 |
| B | 10 | 247 | 95226 | 587.92 | 747 | 719 | 160.7 |
| B | 0 | 171 | 69060 | 425.14 | 747 | 719 | 160.7 |
| C | 1 | 241 | 899371 | 4535.73 | 720 | 712 | 198.1 |
| C | 13 | 3 | 338252 | 1703.64 | 720 | 712 | 198.1 |
| C | 14 | 254 | 132676 | 666.05 | 720 | 712 | 198.1 |
| D | 8 | 176 | 4817506 | 30966.43 | 542 | 517 | 155.6 |
| D | 7 | 70 | 3339199 | 21463.01 | 542 | 517 | 155.6 |
| D | 15 | 108 | 384504 | 2468.49 | 542 | 517 | 155.6 |
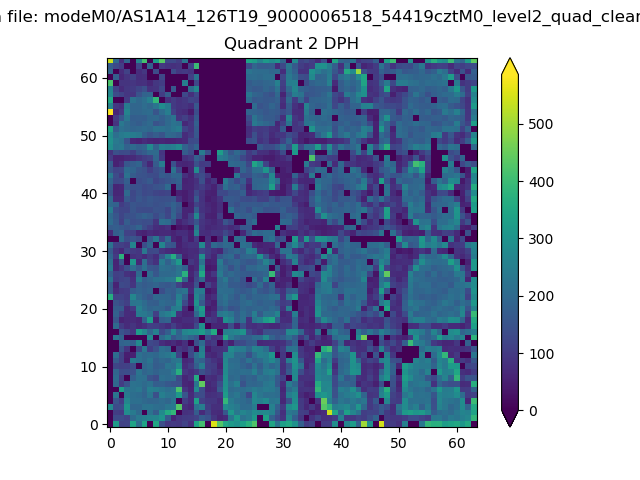
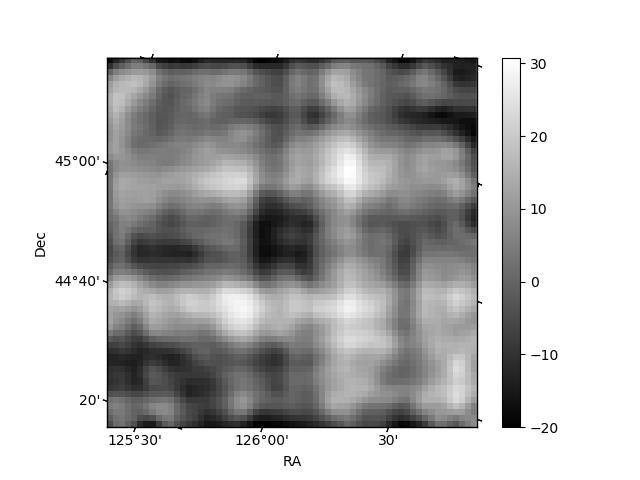
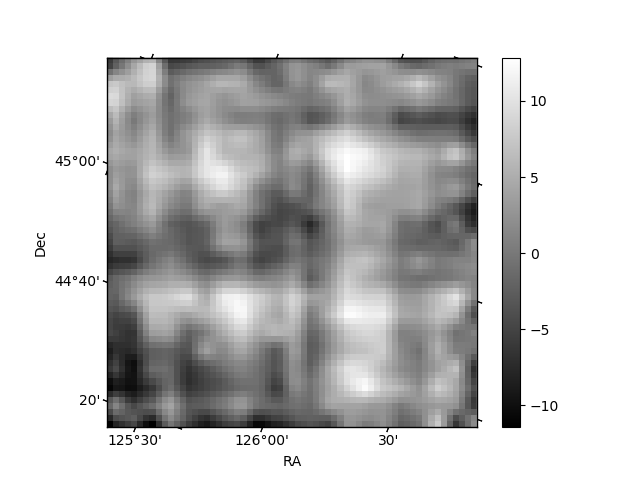
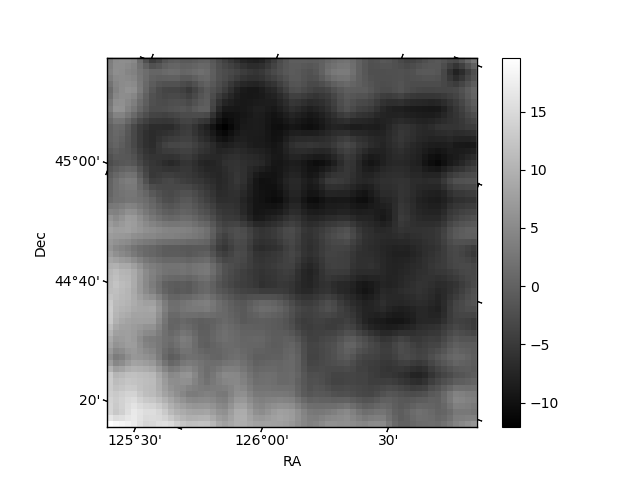
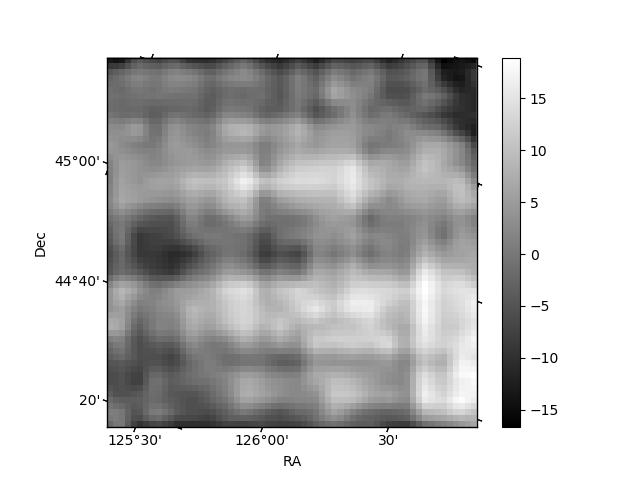
Histogram calculated using DETX and DETY for each event in the final _common_clean file
| Quadrant A | 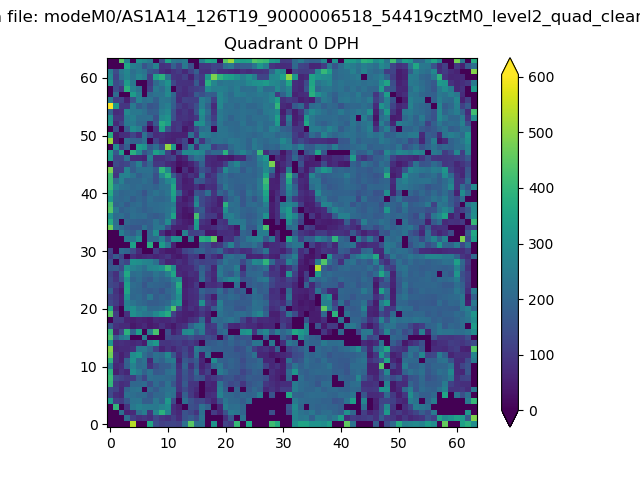 |
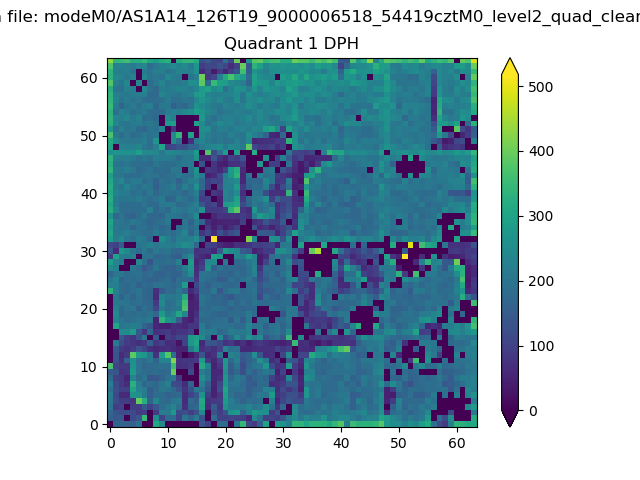 |
Quadrant B |
|---|---|---|---|
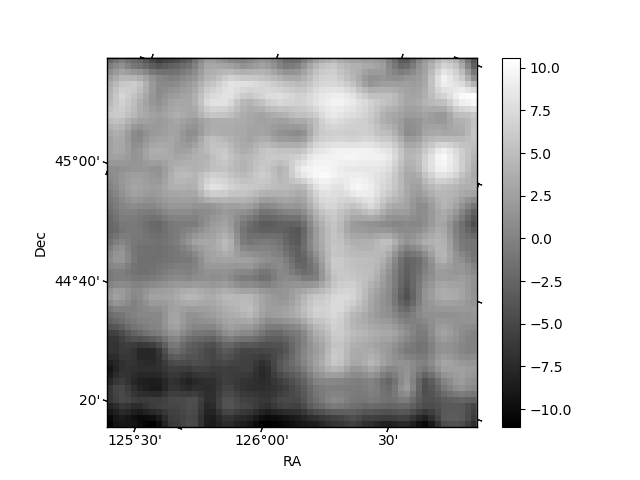
| Quadrant D | 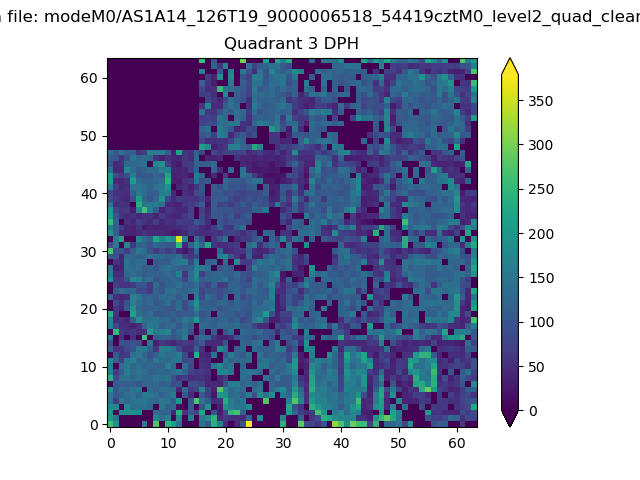 |
 |
Quadrant C |
| Plot type | Count rate plots | Images |
|---|---|---|
| Comparison with Poisson distribution Blue bars denote a histogram of data divided into 1 sec bins. Red curve is a Poisson curve with rate = median count rate of data. |
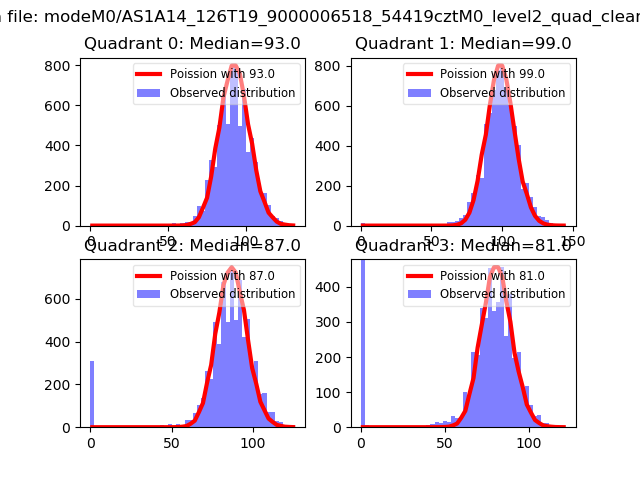 |
 |
| Quadrant-wise count rates Data is divided into 100 sec bins |
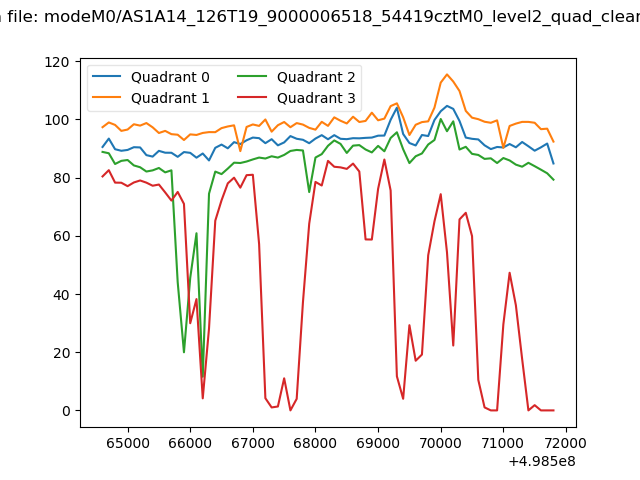 |
|
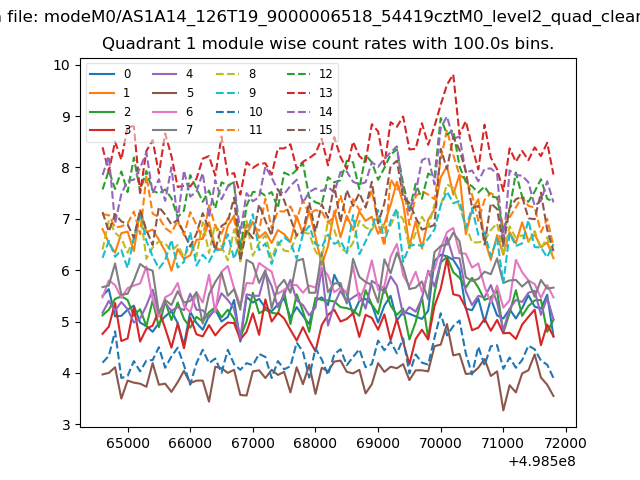
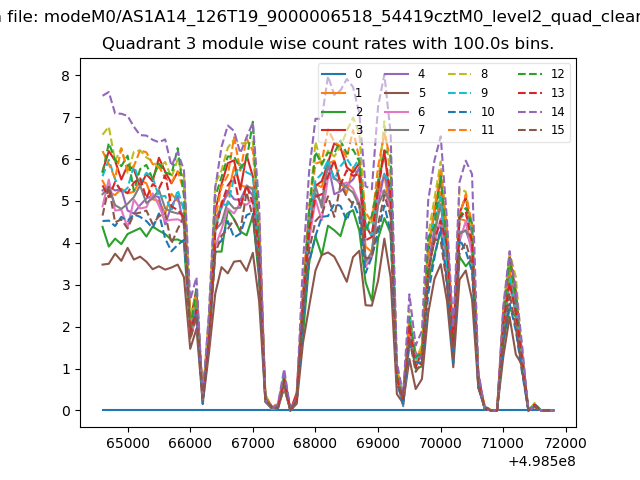
| Module-wise count rates for Quadrant A Data is divided into 100 sec bins |
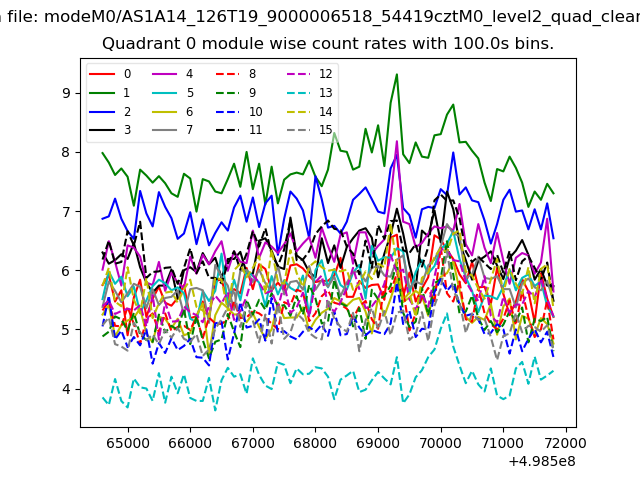 |
 |
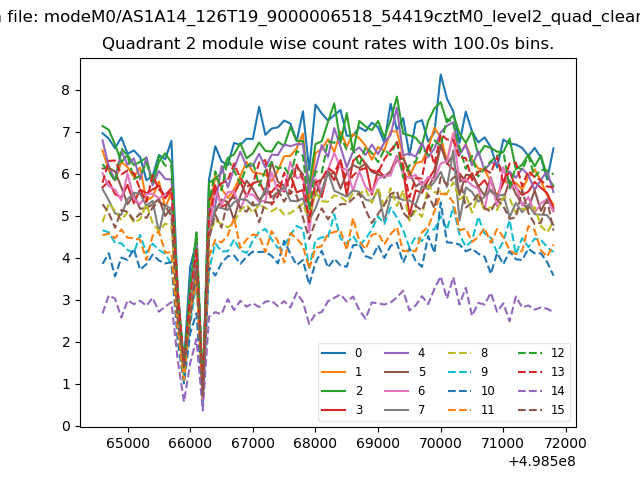
| Module-wise count rates for Quadrant B Data is divided into 100 sec bins |
 |
 |
| Module-wise count rates for Quadrant C Data is divided into 100 sec bins |
 |
 |
| Module-wise count rates for Quadrant D Data is divided into 100 sec bins |
 |
 |
| Parameter | Plot |
|---|---|
| CZT HV Monitor |  |
| D_VDD | 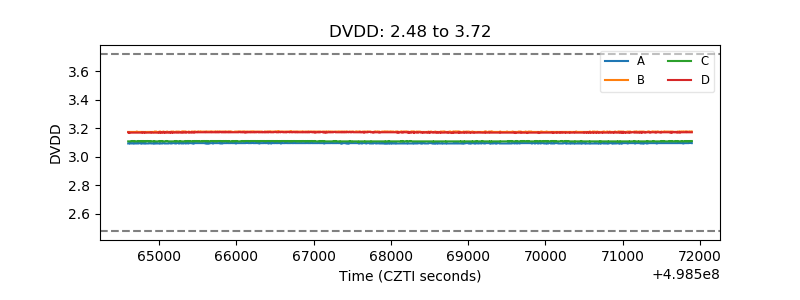 |
| Temperature 1 | 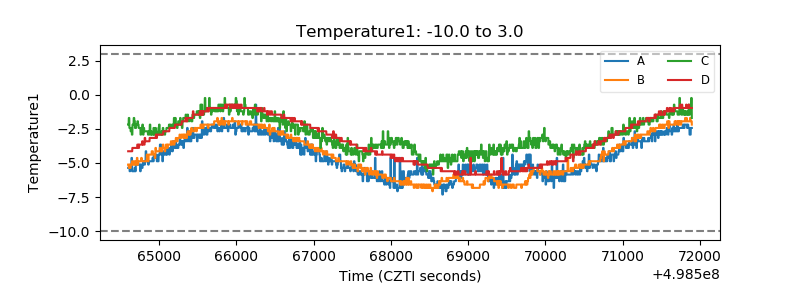 |
| Veto HV Monitor | 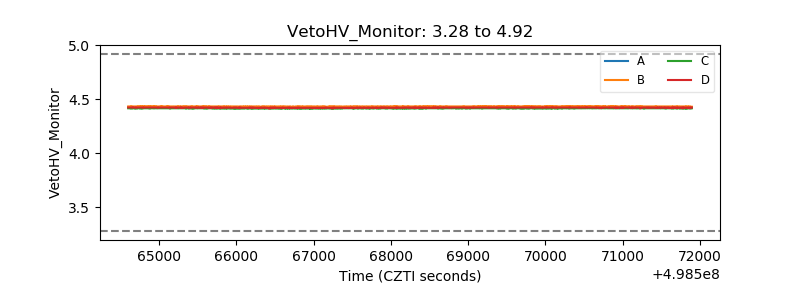 |
| Veto LLD | 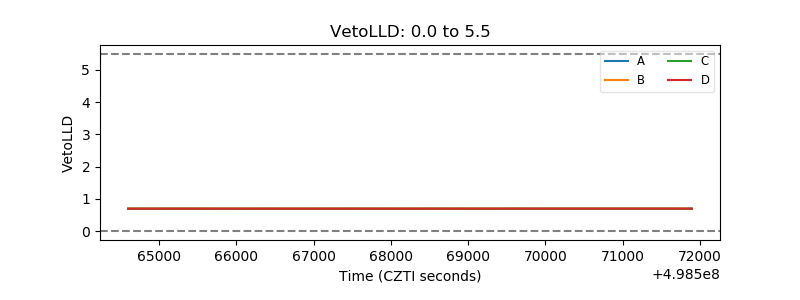 |
| Alpha Counter | 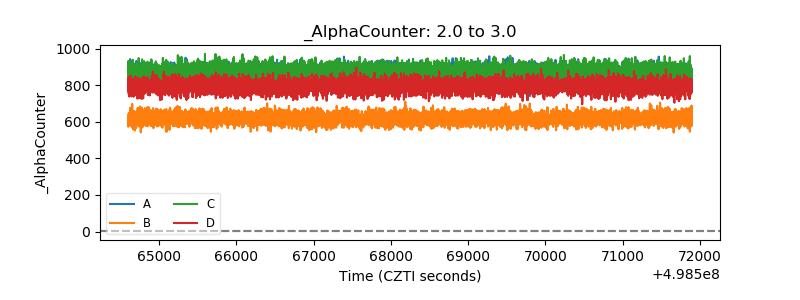 |
| _CPM_Rate | 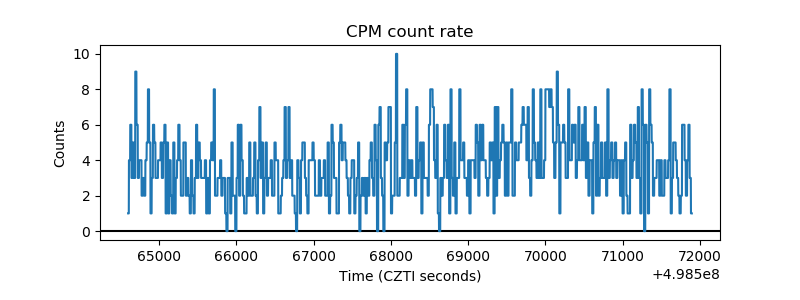 |
| CZT Counter | 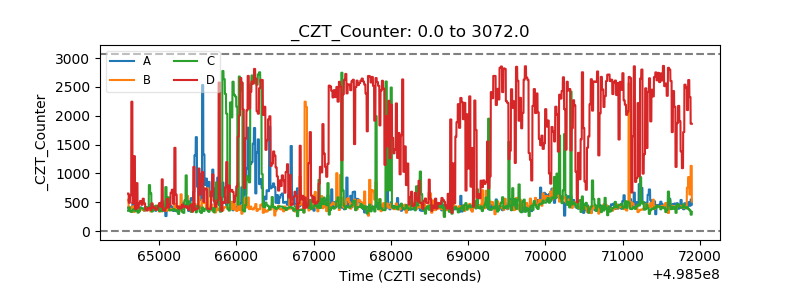 |
| +2.5 Volts monitor |  |
| +5 Volts monitor |  |
| _ROLL_ROT | 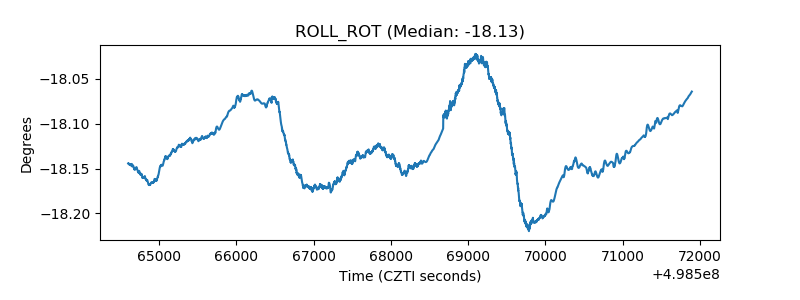 |
| _Roll_DEC | 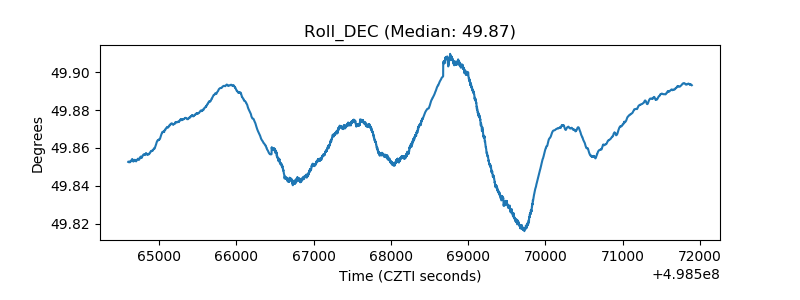 |
| _Roll_RA | 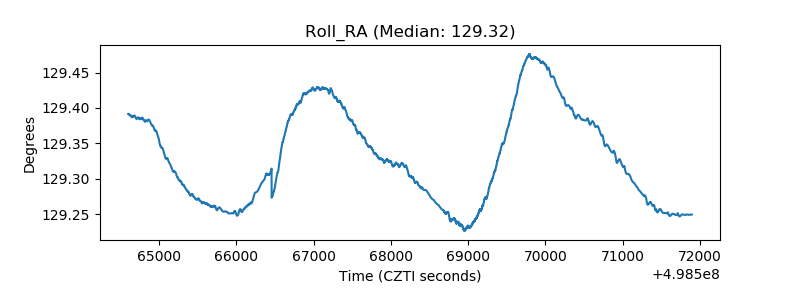 |
| Veto Counter | 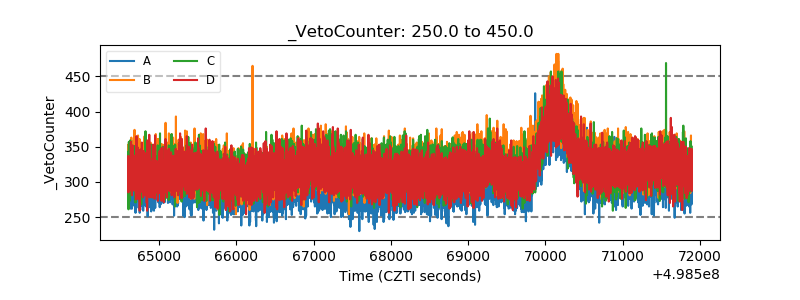 |