| Param | Original file | Final file |
|---|---|---|
| Filename | modeM0/AS1A14_126T19_9000006518_54420cztM0_level2.fits | modeM0/AS1A14_126T19_9000006518_54420cztM0_level2_quad_clean.evt |
| Size (bytes) | 651,490,560 | 97,882,560 |
| Size | 621.3 MB | 93.3 MB |
| Events in quadrant A | 3,687,307 | 696,179 |
| Events in quadrant B | 3,542,434 | 742,753 |
| Events in quadrant C | 4,080,910 | 652,737 |
| Events in quadrant D | 12,219,912 | 347,941 |
| Mode SS | |||
|---|---|---|---|
| Quadrant | BADHDUFLAG | Total packets | Discarded packets |
| A | 0 | 150 | 0 |
| B | 0 | 150 | 0 |
| C | 0 | 150 | 0 |
| D | 0 | 150 | 0 |
| Mode M0 | |||
|---|---|---|---|
| Quadrant | BADHDUFLAG | Total packets | Discarded packets |
| A | 0 | 16128 | 0 |
| B | 0 | 16168 | 0 |
| C | 0 | 17724 | 0 |
| D | 0 | 41521 | 0 |
| Quadrant | Total seconds | Saturated seconds | Saturation percentage |
|---|---|---|---|
| A | 7533 | 22 | 0.292048% |
| B | 7534 | 54 | 0.716751% |
| C | 7534 | 132 | 1.752057% |
| D | 7534 | 3561 | 47.265729% |
Noise dominated data is calculated using 1-second bins in cleaned event files. If a bin has >2000 counts, and if more than 50% of those come from <1% of pixels, then it is considered to be noise-dominated and hence unusable.
| Quadrant | # 1 sec bins | Bins with >0 counts | Bins with >2000 counts | High rate bins dominated by noise | Noise dominated (total time) | Noise dominated (detector-on time) | Marked lightcurve |
|---|---|---|---|---|---|---|---|
| A | 7533 | 7533 | 17 | 17 | 0.23% | 0.23% | 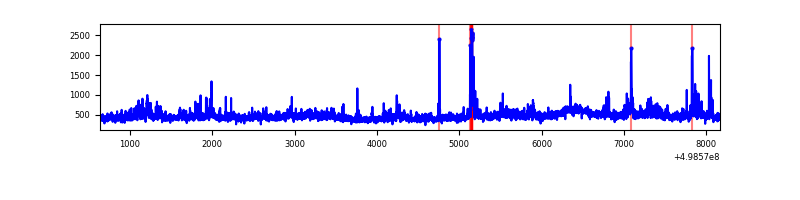 |
| B | 7533 | 7533 | 37 | 37 | 0.49% | 0.49% | 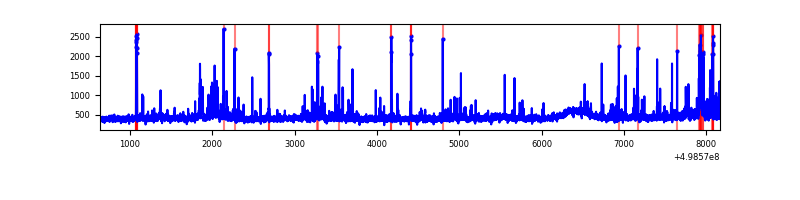 |
| C | 7534 | 7534 | 126 | 126 | 1.67% | 1.67% | 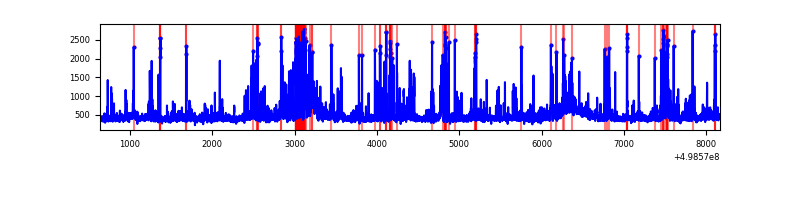 |
| D | 7533 | 7533 | 3137 | 3137 | 41.64% | 41.64% | 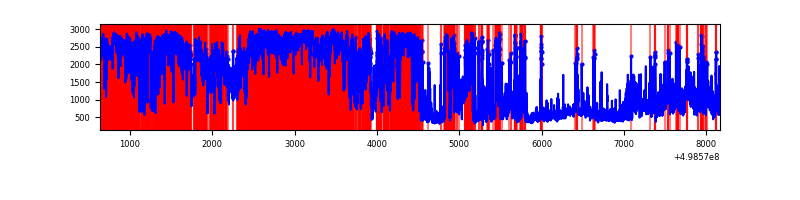 |
Top three noisy pixels from each quadrant. If the there are fewer than three noisy pixels in the level2.evt file, extra rows are filled as -1
| Pixel properties | Quadrant properties | ||||||
|---|---|---|---|---|---|---|---|
| Quadrant | DetID | PixID | Counts | Sigma | Mean | Median | Sigma |
| A | 7 | 206 | 199547 | 1023.14 | 790 | 771 | 194.3 |
| A | 11 | 3 | 91296 | 465.95 | 790 | 771 | 194.3 |
| A | 7 | 237 | 78721 | 401.23 | 790 | 771 | 194.3 |
| B | 5 | 185 | 190183 | 1124.05 | 780 | 751 | 168.5 |
| B | 0 | 213 | 92505 | 544.45 | 780 | 751 | 168.5 |
| B | 10 | 247 | 71411 | 419.28 | 780 | 751 | 168.5 |
| C | 13 | 3 | 567599 | 2707.46 | 760 | 752 | 209.4 |
| C | 14 | 254 | 312454 | 1488.8 | 760 | 752 | 209.4 |
| C | 12 | 249 | 81044 | 383.5 | 760 | 752 | 209.4 |
| D | 8 | 176 | 5070568 | 34665.12 | 511 | 489 | 146.3 |
| D | 15 | 108 | 3230030 | 22081.0 | 511 | 489 | 146.3 |
| D | 7 | 70 | 1217801 | 8323.0 | 511 | 489 | 146.3 |
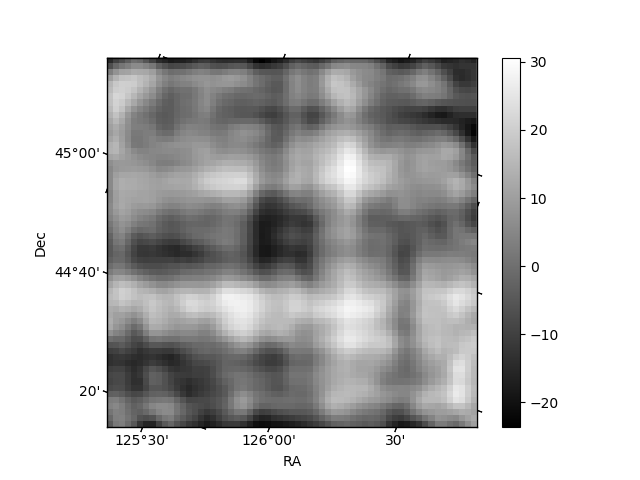
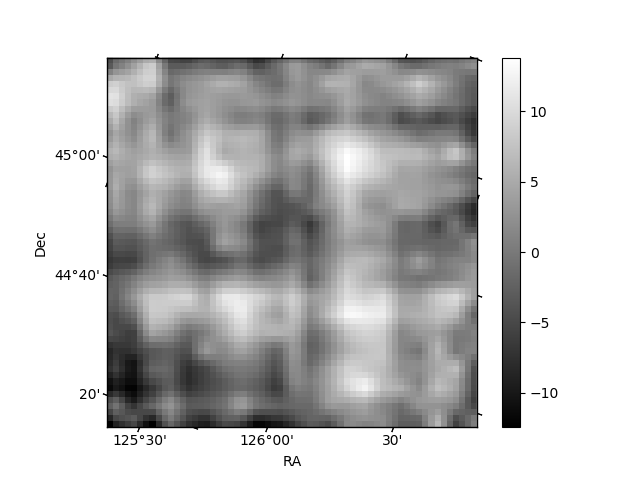
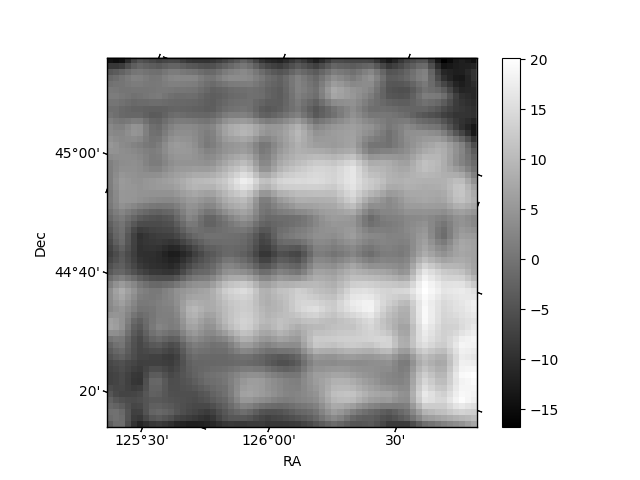
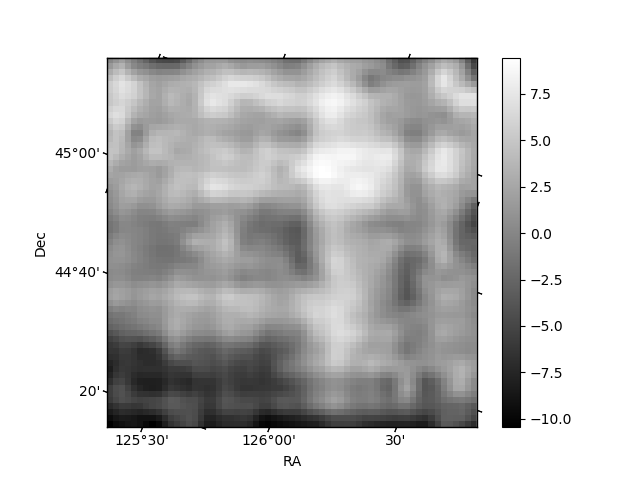
Histogram calculated using DETX and DETY for each event in the final _common_clean file
| Quadrant A | 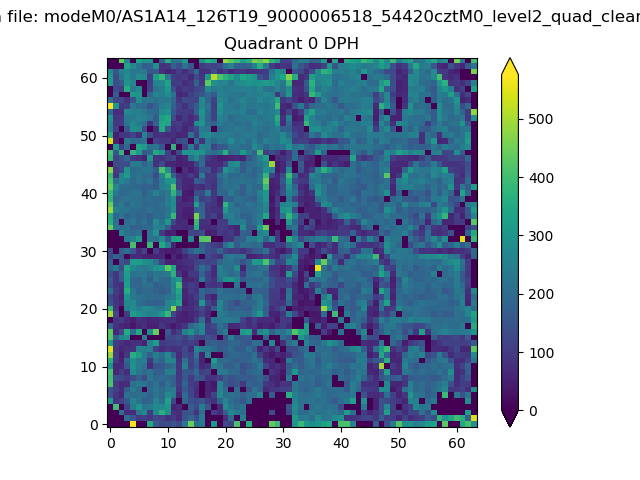 |
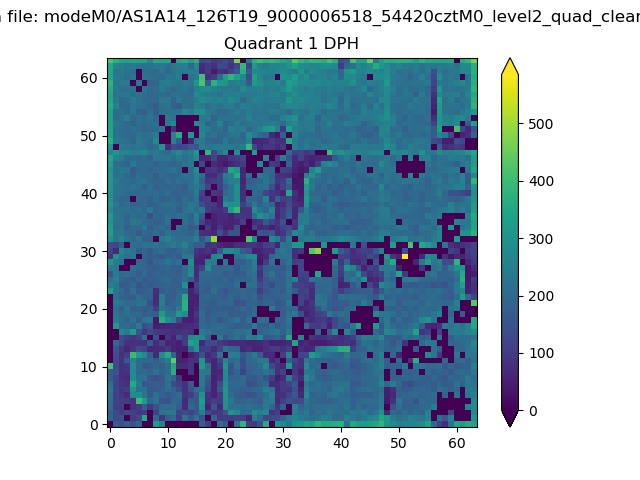 |
Quadrant B |
|---|---|---|---|
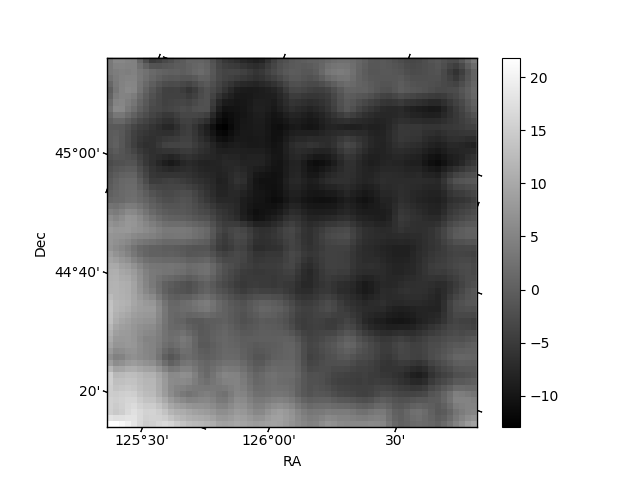
| Quadrant D | 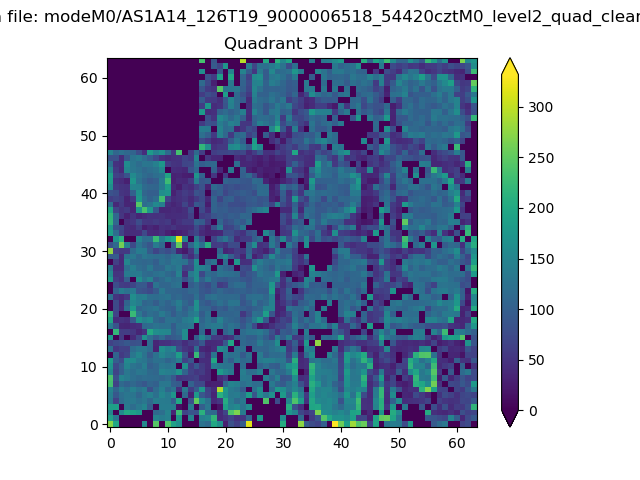 |
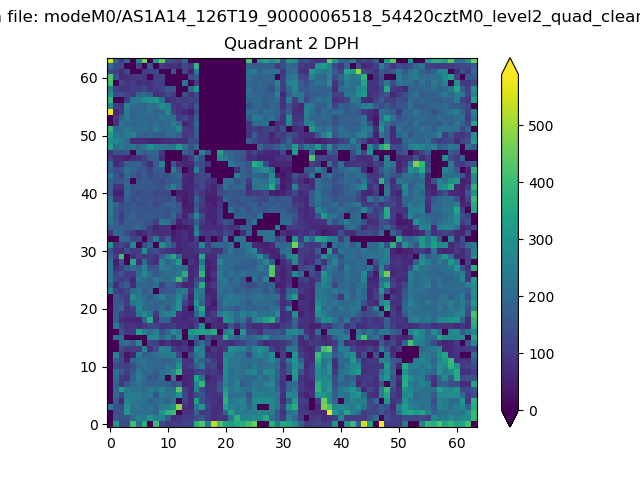 |
Quadrant C |
| Plot type | Count rate plots | Images |
|---|---|---|
| Comparison with Poisson distribution Blue bars denote a histogram of data divided into 1 sec bins. Red curve is a Poisson curve with rate = median count rate of data. |
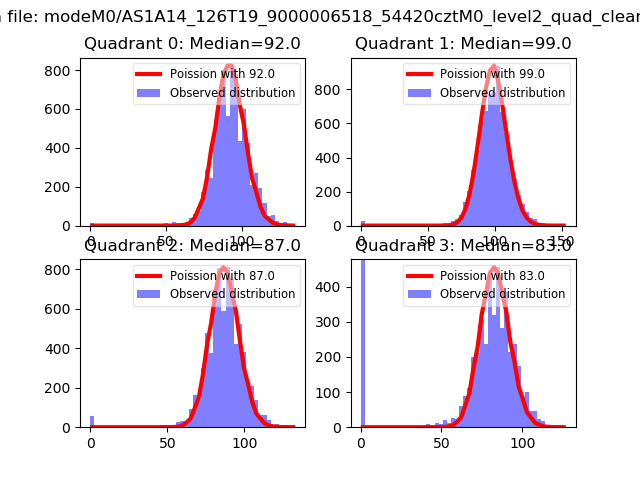 |
 |
| Quadrant-wise count rates Data is divided into 100 sec bins |
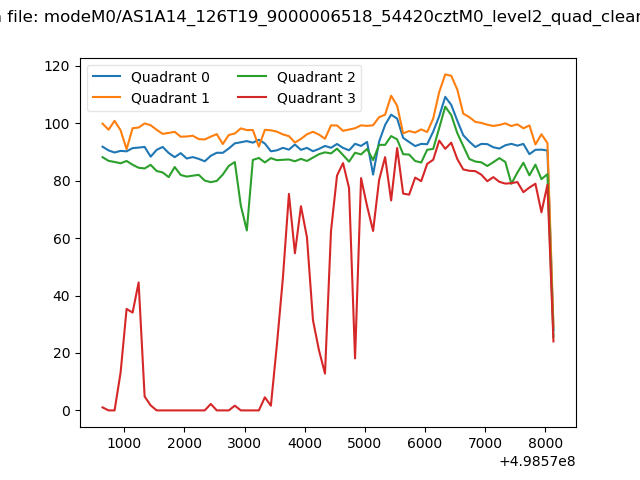 |
|
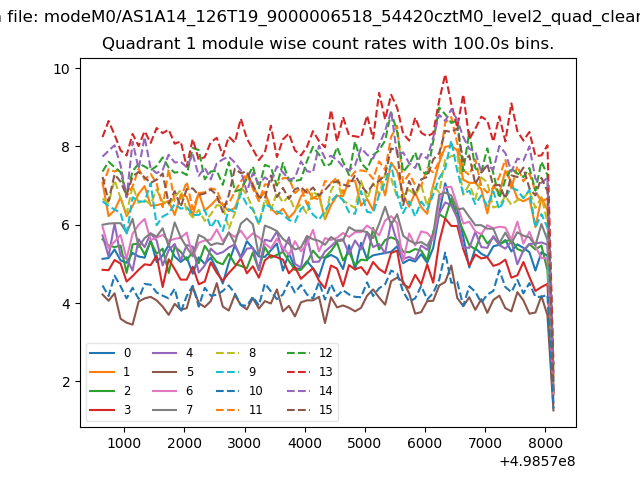
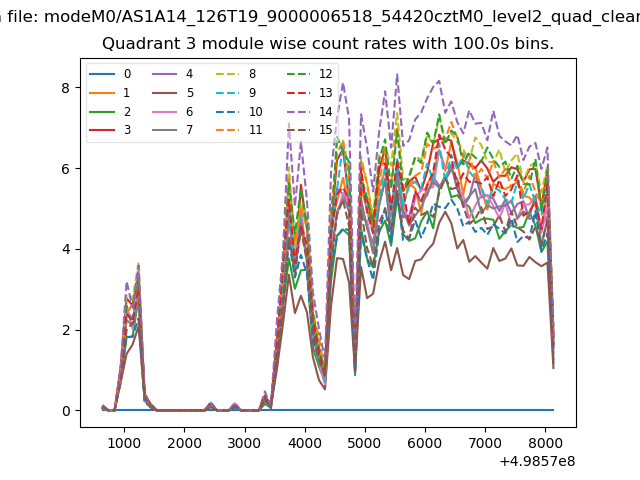
| Module-wise count rates for Quadrant A Data is divided into 100 sec bins |
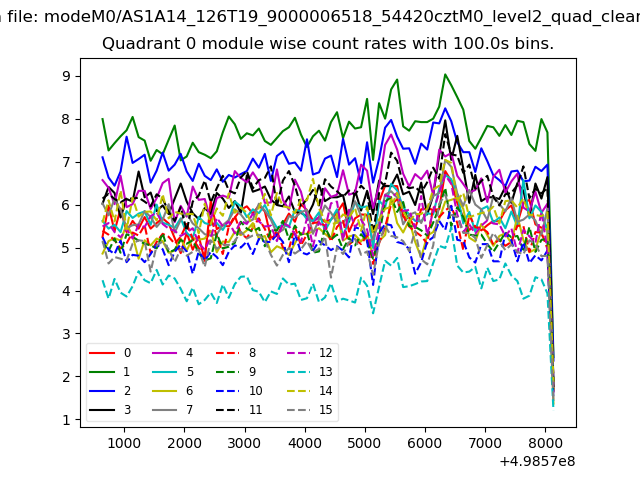 |
 |
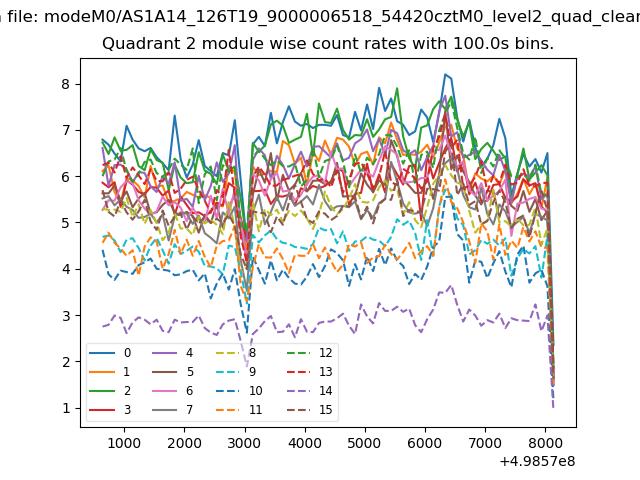
| Module-wise count rates for Quadrant B Data is divided into 100 sec bins |
 |
 |
| Module-wise count rates for Quadrant C Data is divided into 100 sec bins |
 |
 |
| Module-wise count rates for Quadrant D Data is divided into 100 sec bins |
 |
 |
| Parameter | Plot |
|---|---|
| CZT HV Monitor | 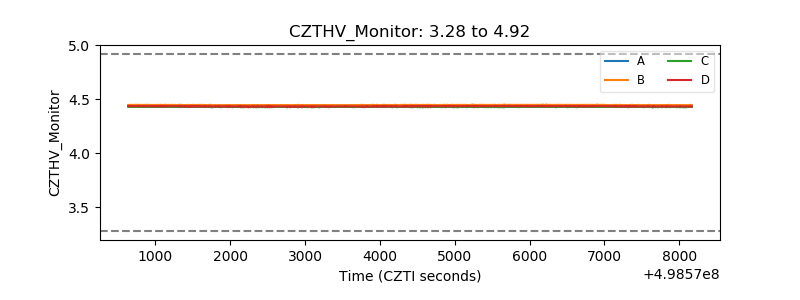 |
| D_VDD | 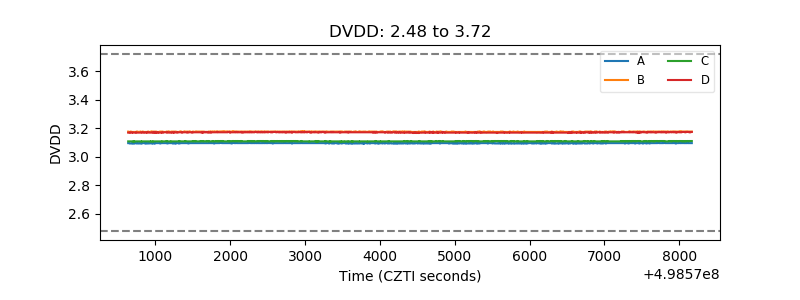 |
| Temperature 1 | 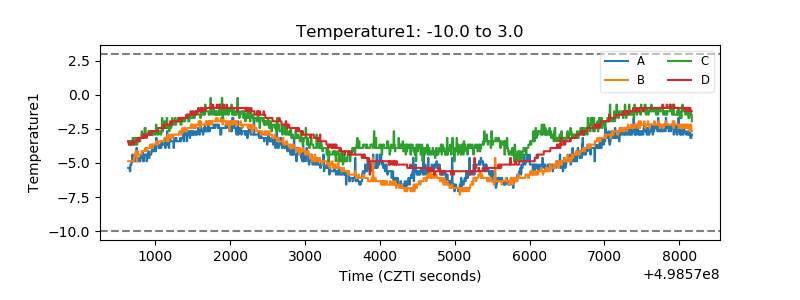 |
| Veto HV Monitor |  |
| Veto LLD | 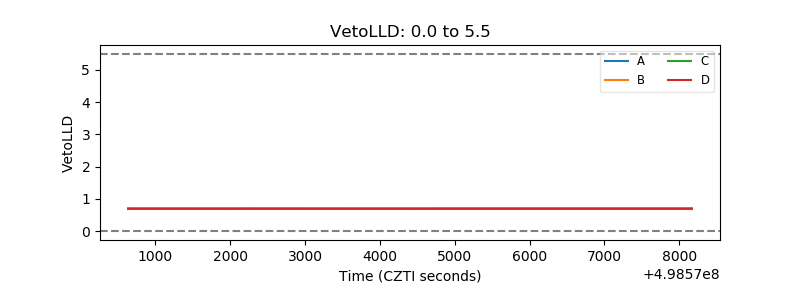 |
| Alpha Counter | 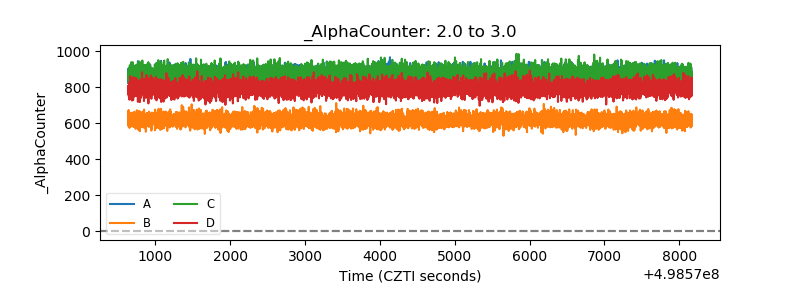 |
| _CPM_Rate | 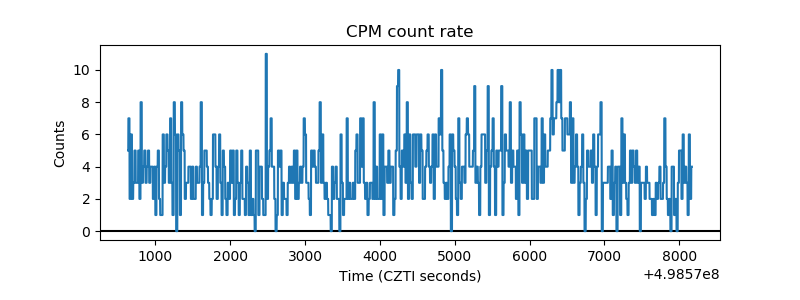 |
| CZT Counter | 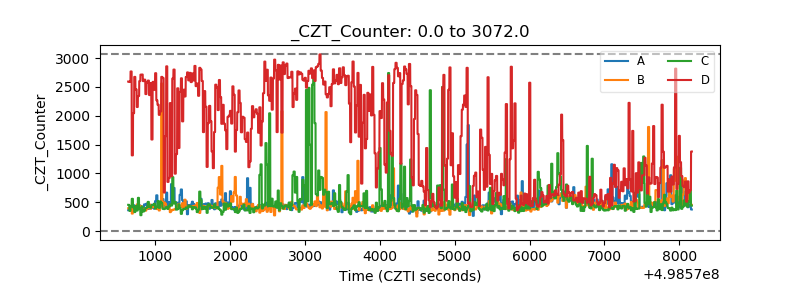 |
| +2.5 Volts monitor | 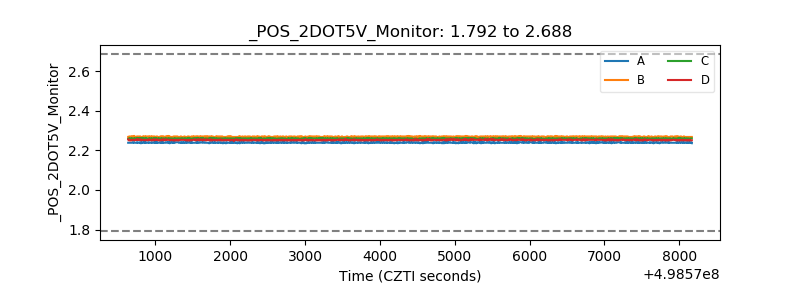 |
| +5 Volts monitor | 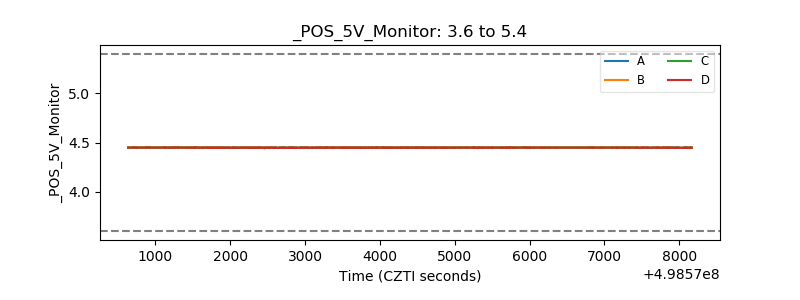 |
| _ROLL_ROT | 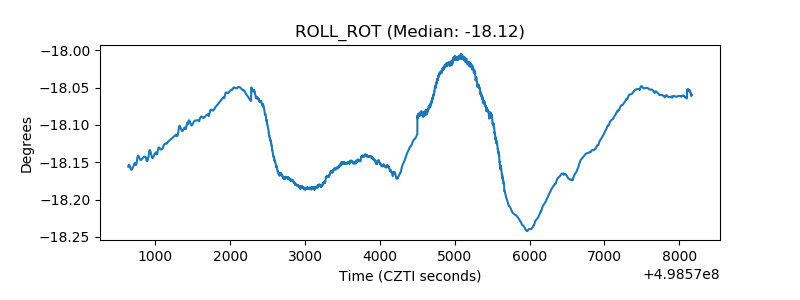 |
| _Roll_DEC | 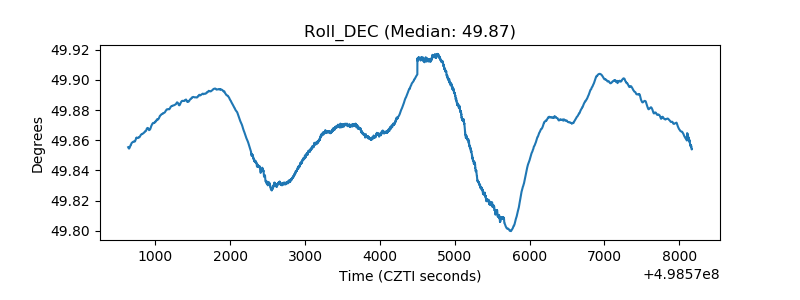 |
| _Roll_RA | 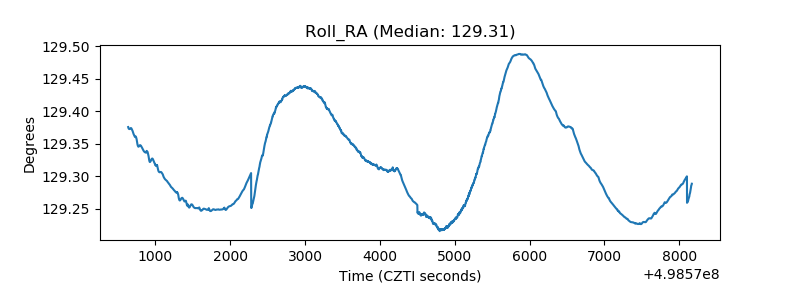 |
| Veto Counter | 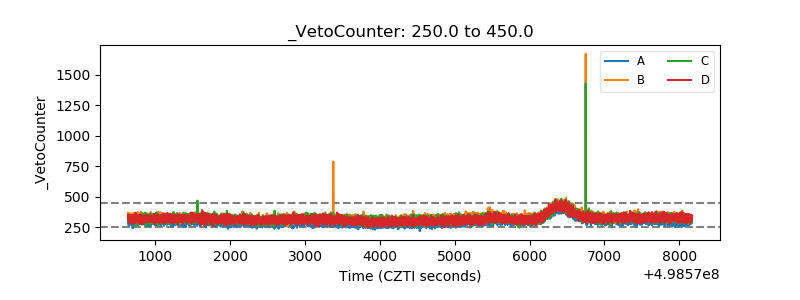 |