| Param | Original file | Final file |
|---|---|---|
| Filename | modeM0/AS1A14_126T19_9000006518_54426cztM0_level2.fits | modeM0/AS1A14_126T19_9000006518_54426cztM0_level2_quad_clean.evt |
| Size (bytes) | 510,301,440 | 94,397,760 |
| Size | 486.7 MB | 90.0 MB |
| Events in quadrant A | 2,993,937 | 655,082 |
| Events in quadrant B | 3,418,074 | 692,696 |
| Events in quadrant C | 4,845,172 | 568,055 |
| Events in quadrant D | 7,094,976 | 461,074 |
| Mode SS | |||
|---|---|---|---|
| Quadrant | BADHDUFLAG | Total packets | Discarded packets |
| A | 0 | 142 | 0 |
| B | 0 | 142 | 0 |
| C | 0 | 142 | 0 |
| D | 0 | 142 | 0 |
| Mode M0 | |||
|---|---|---|---|
| Quadrant | BADHDUFLAG | Total packets | Discarded packets |
| A | 0 | 14134 | 2 |
| B | 0 | 15183 | 2 |
| C | 0 | 19661 | 2 |
| D | 0 | 26155 | 2 |
| Mode M9 | |||
|---|---|---|---|
| Quadrant | BADHDUFLAG | Total packets | Discarded packets |
| A | 0 | 18 | 0 |
| B | 0 | 18 | 0 |
| C | 0 | 18 | 0 |
| D | 0 | 18 | 0 |
| Quadrant | Total seconds | Saturated seconds | Saturation percentage |
|---|---|---|---|
| A | 6907 | 51 | 0.738381% |
| B | 6908 | 129 | 1.867400% |
| C | 6908 | 702 | 10.162131% |
| D | 6908 | 1555 | 22.510133% |
Noise dominated data is calculated using 1-second bins in cleaned event files. If a bin has >2000 counts, and if more than 50% of those come from <1% of pixels, then it is considered to be noise-dominated and hence unusable.
| Quadrant | # 1 sec bins | Bins with >0 counts | Bins with >2000 counts | High rate bins dominated by noise | Noise dominated (total time) | Noise dominated (detector-on time) | Marked lightcurve |
|---|---|---|---|---|---|---|---|
| A | 8682 | 6909 | 1 | 1 | 0.01% | 0.01% | 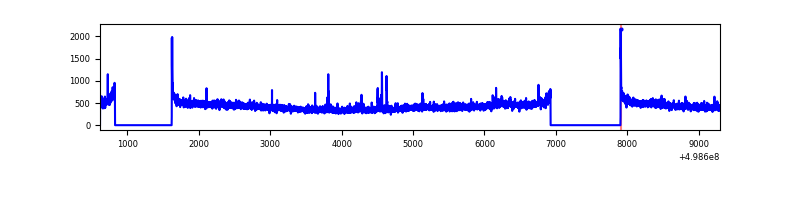 |
| B | 8683 | 6910 | 25 | 25 | 0.29% | 0.36% | 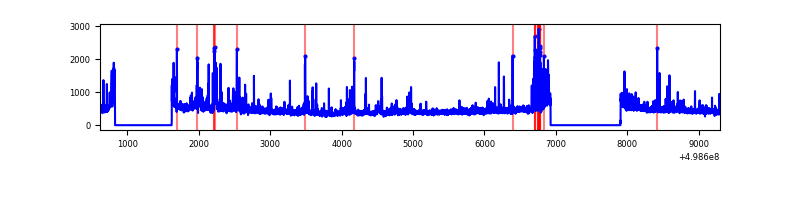 |
| C | 8683 | 6910 | 635 | 635 | 7.31% | 9.19% | 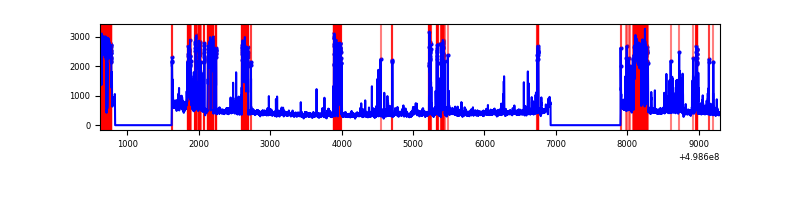 |
| D | 8683 | 6910 | 1406 | 1406 | 16.19% | 20.35% | 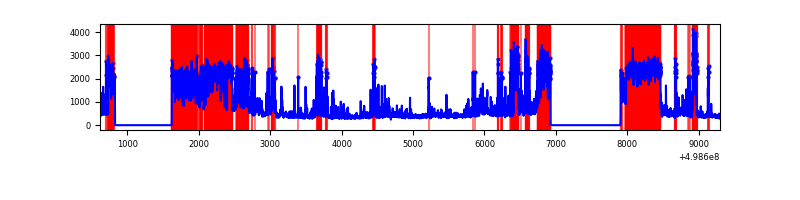 |
Top three noisy pixels from each quadrant. If the there are fewer than three noisy pixels in the level2.evt file, extra rows are filled as -1
| Pixel properties | Quadrant properties | ||||||
|---|---|---|---|---|---|---|---|
| Quadrant | DetID | PixID | Counts | Sigma | Mean | Median | Sigma |
| A | 11 | 3 | 28756 | 153.19 | 739 | 719 | 183.0 |
| A | 4 | 3 | 28180 | 150.04 | 739 | 719 | 183.0 |
| A | 0 | 8 | 20951 | 110.55 | 739 | 719 | 183.0 |
| B | 5 | 185 | 182296 | 1150.14 | 730 | 702 | 157.9 |
| B | 0 | 213 | 113426 | 713.95 | 730 | 702 | 157.9 |
| B | 10 | 247 | 91956 | 577.97 | 730 | 702 | 157.9 |
| C | 1 | 241 | 1669357 | 8778.91 | 690 | 683 | 190.1 |
| C | 1 | 16 | 100842 | 526.94 | 690 | 683 | 190.1 |
| C | 4 | 5 | 98538 | 514.82 | 690 | 683 | 190.1 |
| D | 7 | 70 | 2963389 | 16367.52 | 634 | 605 | 181.0 |
| D | 8 | 176 | 741200 | 4091.32 | 634 | 605 | 181.0 |
| D | 3 | 12 | 291646 | 1607.82 | 634 | 605 | 181.0 |
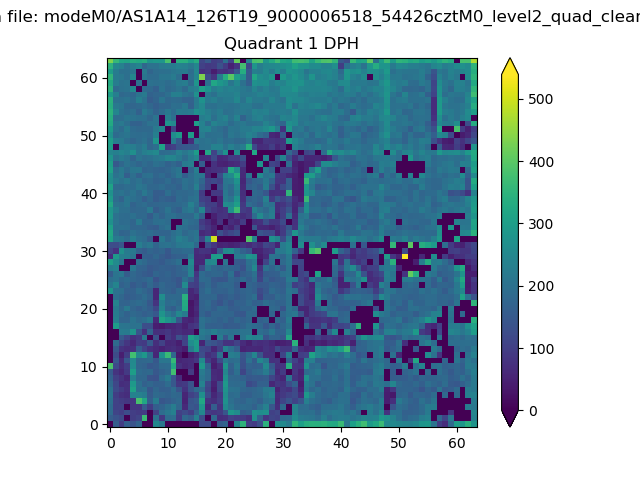
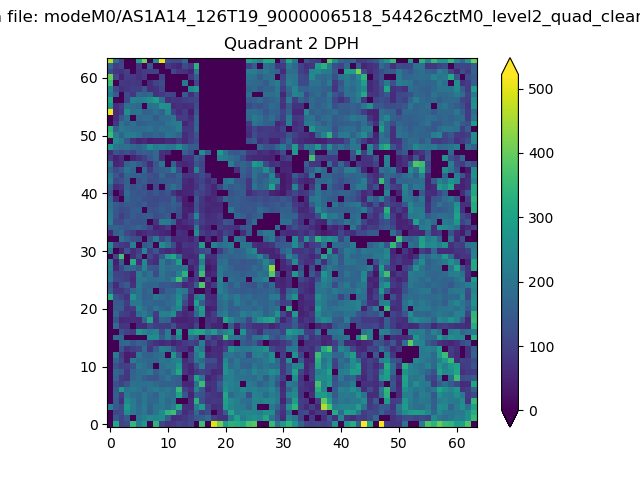
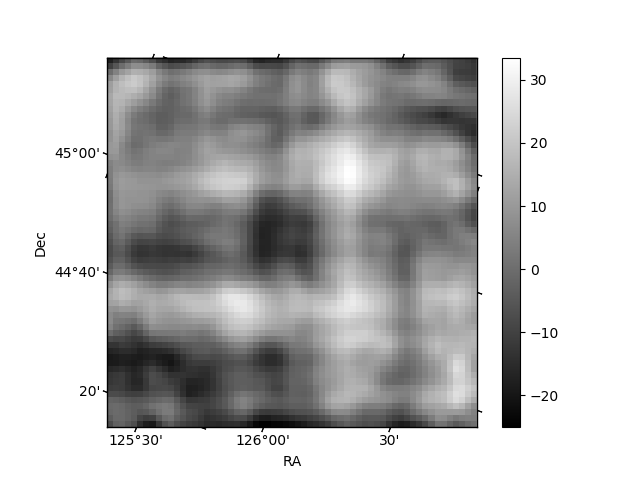
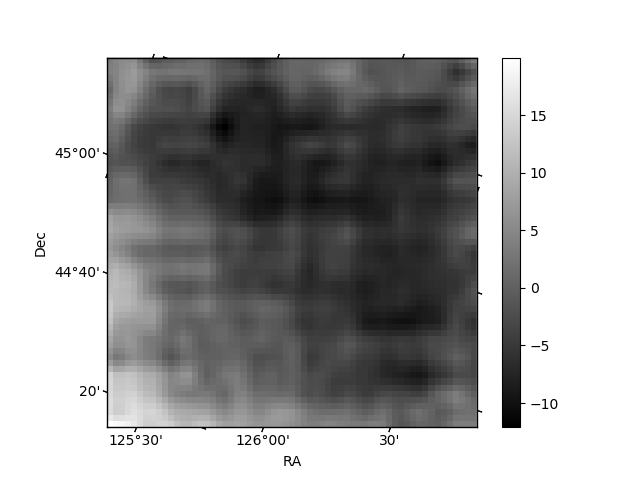
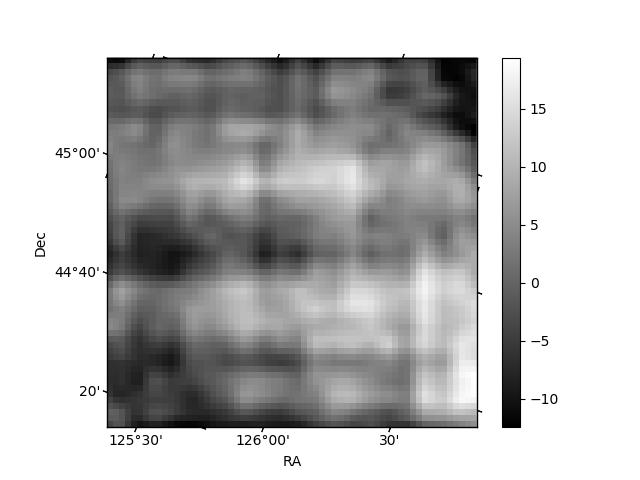
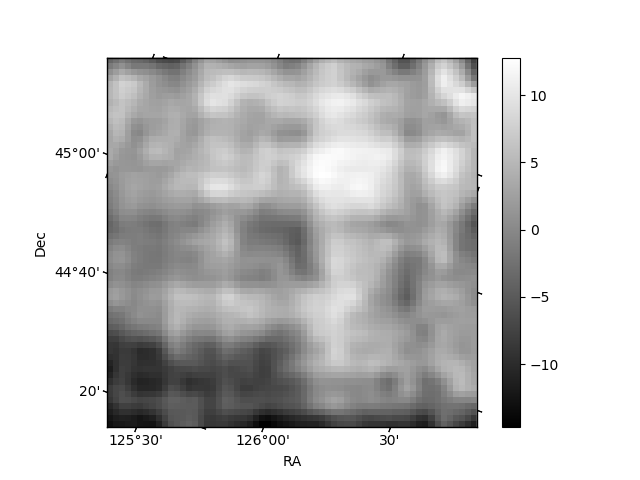
Histogram calculated using DETX and DETY for each event in the final _common_clean file
| Quadrant A |  |
 |
Quadrant B |
|---|---|---|---|
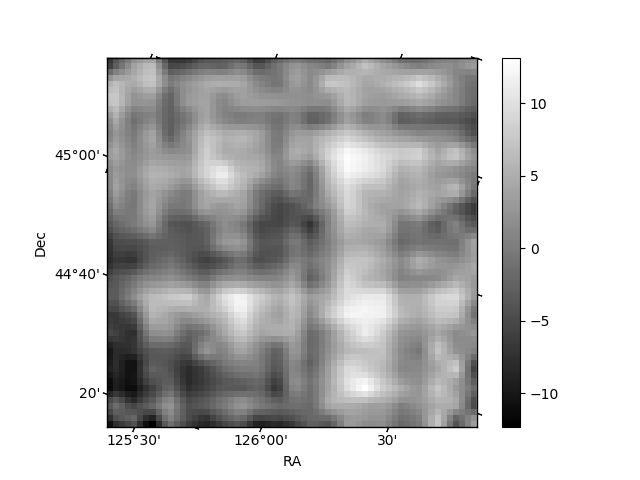
| Quadrant D | 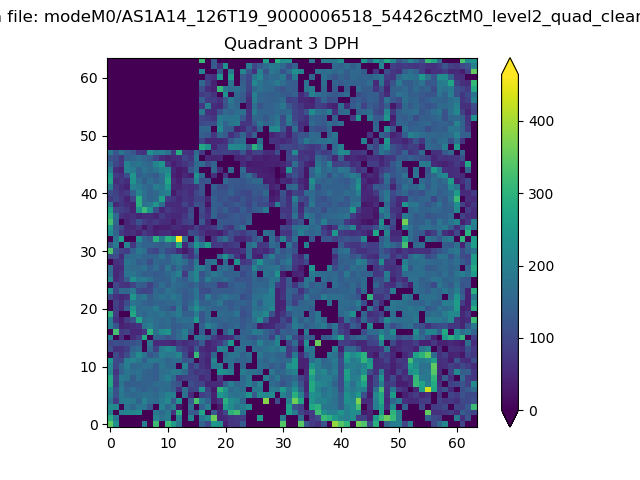 |
 |
Quadrant C |
| Plot type | Count rate plots | Images |
|---|---|---|
| Comparison with Poisson distribution Blue bars denote a histogram of data divided into 1 sec bins. Red curve is a Poisson curve with rate = median count rate of data. |
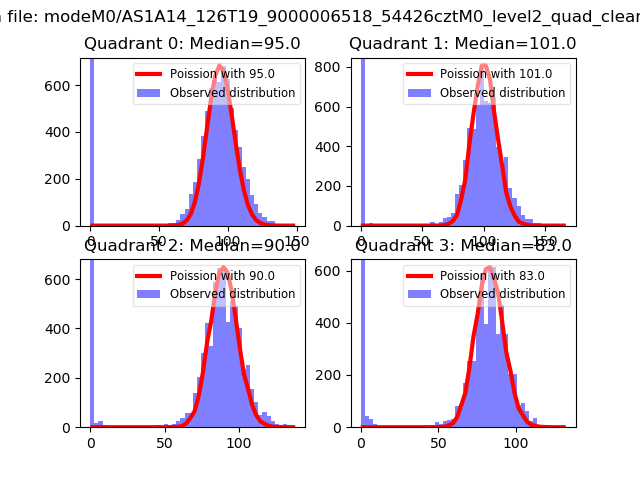 |
 |
| Quadrant-wise count rates Data is divided into 100 sec bins |
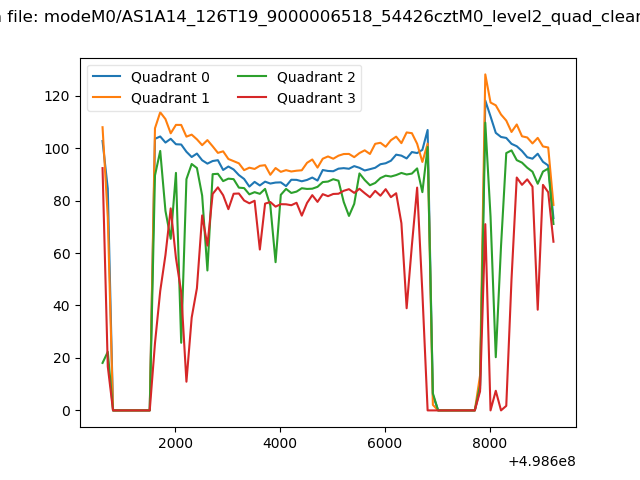 |
|
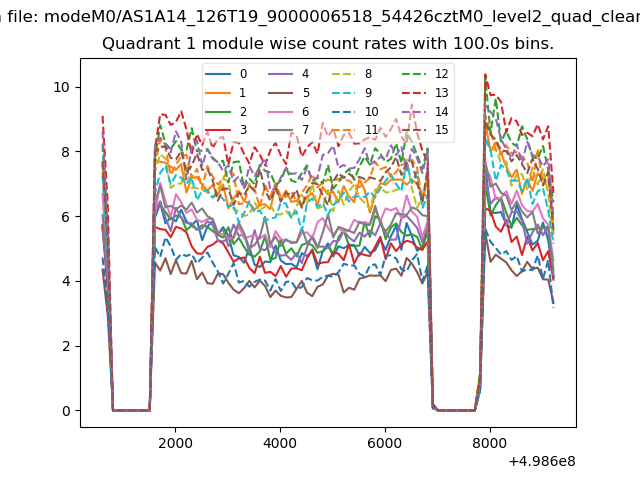
| Module-wise count rates for Quadrant A Data is divided into 100 sec bins |
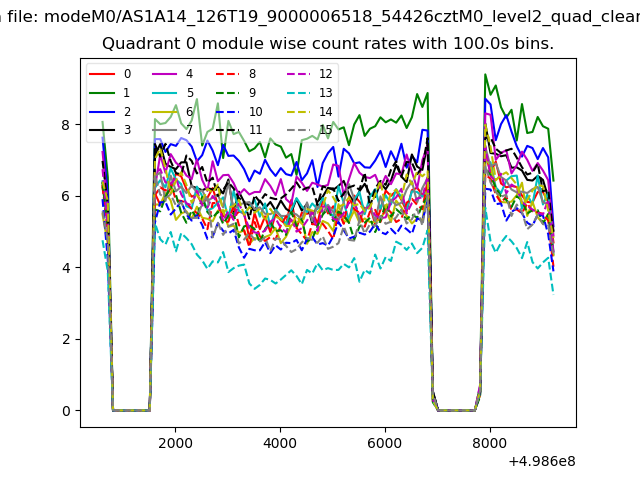 |
 |
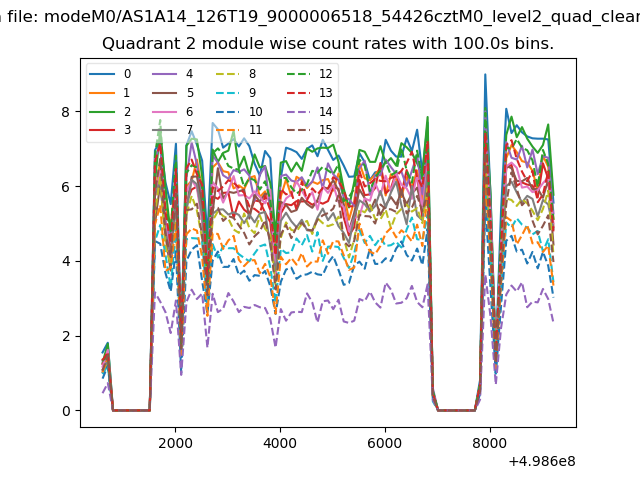
| Module-wise count rates for Quadrant B Data is divided into 100 sec bins |
 |
 |
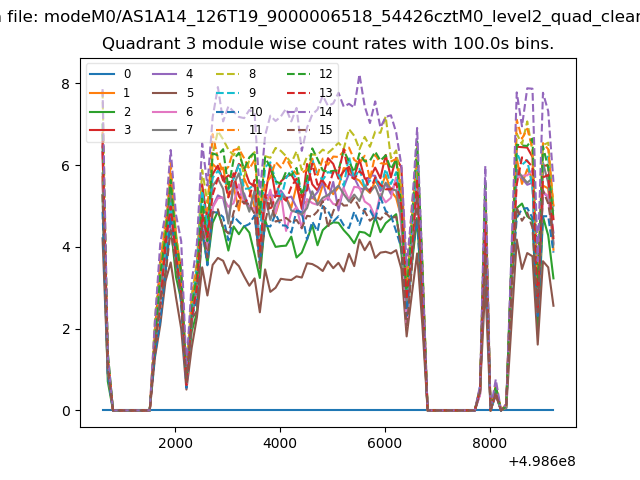
| Module-wise count rates for Quadrant C Data is divided into 100 sec bins |
 |
 |
| Module-wise count rates for Quadrant D Data is divided into 100 sec bins |
 |
 |
| Parameter | Plot |
|---|---|
| CZT HV Monitor | 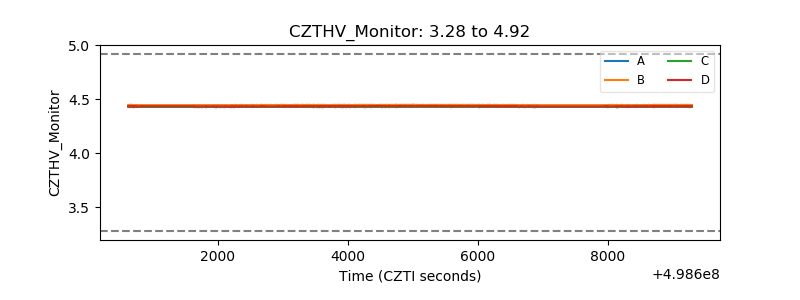 |
| D_VDD | 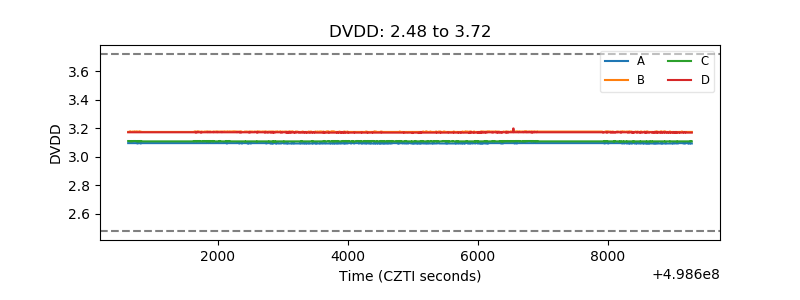 |
| Temperature 1 | 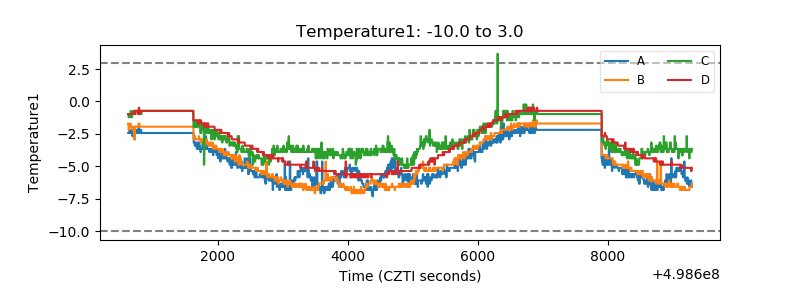 |
| Veto HV Monitor | 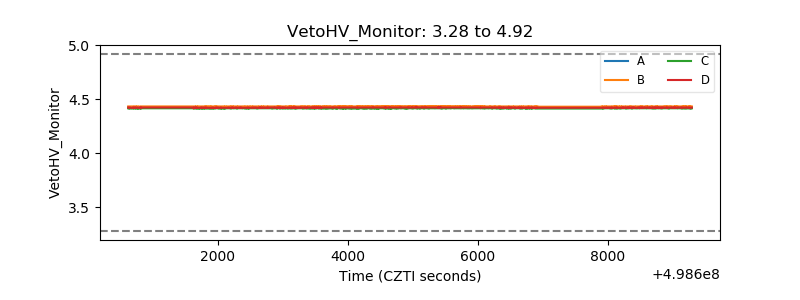 |
| Veto LLD | 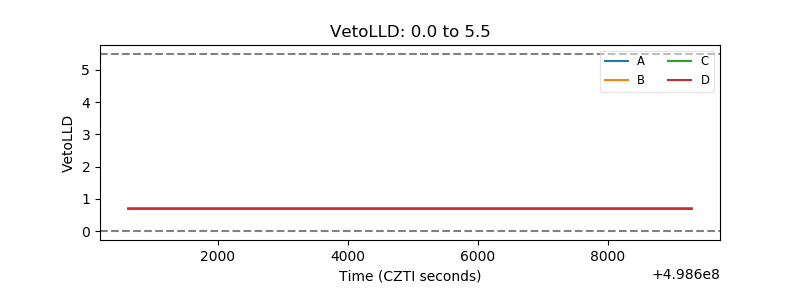 |
| Alpha Counter | 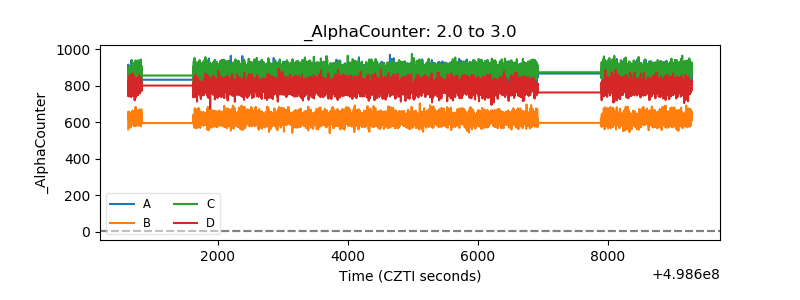 |
| _CPM_Rate | 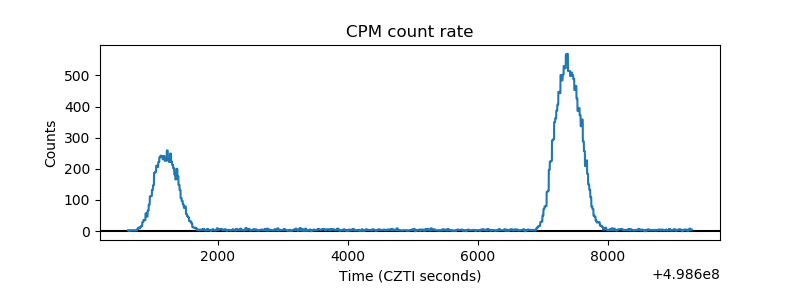 |
| CZT Counter | 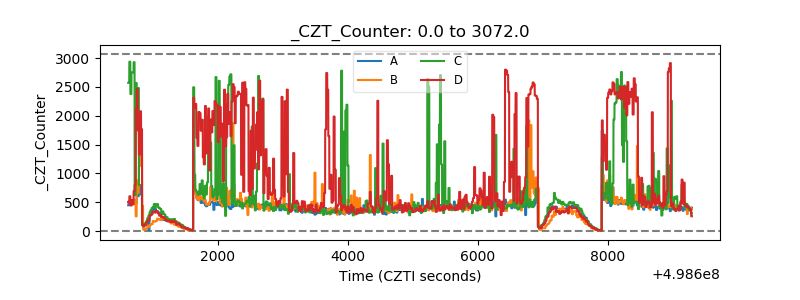 |
| +2.5 Volts monitor | 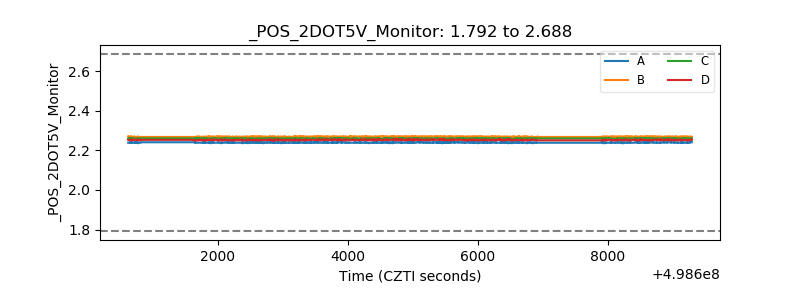 |
| +5 Volts monitor | 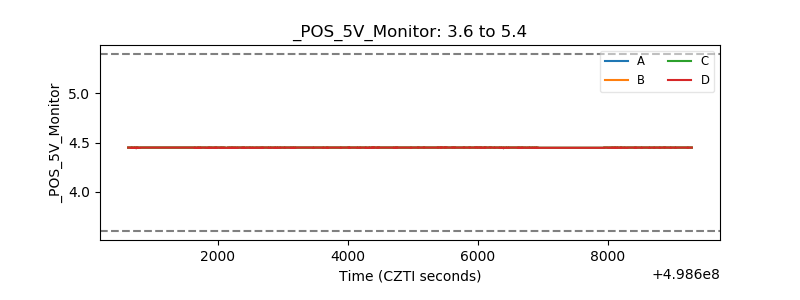 |
| _ROLL_ROT | 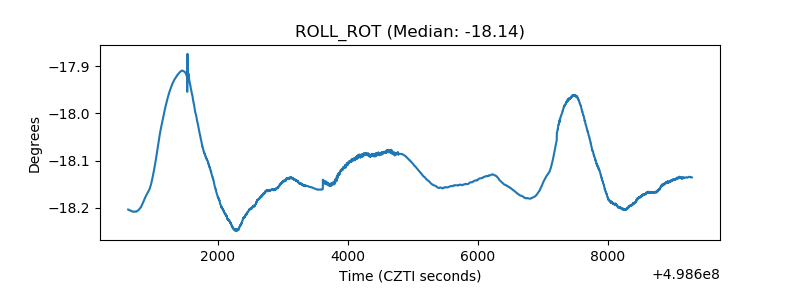 |
| _Roll_DEC | 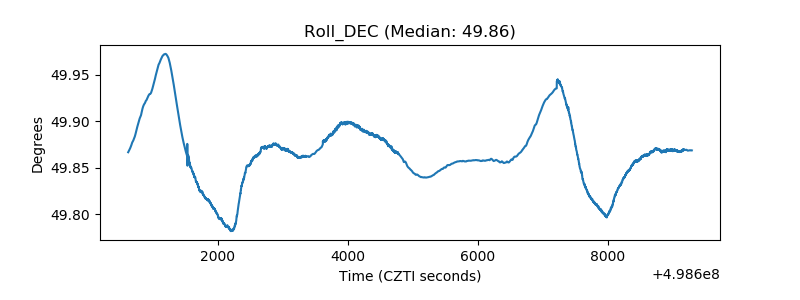 |
| _Roll_RA | 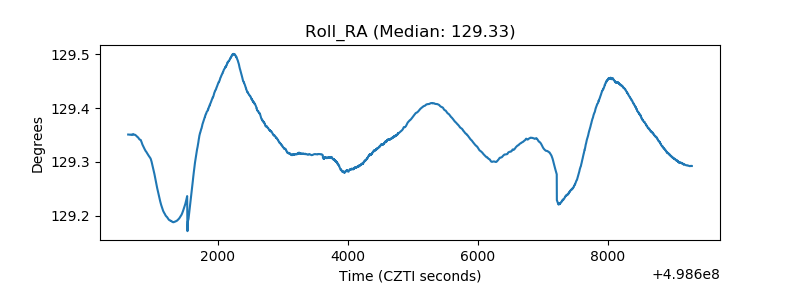 |
| Veto Counter | 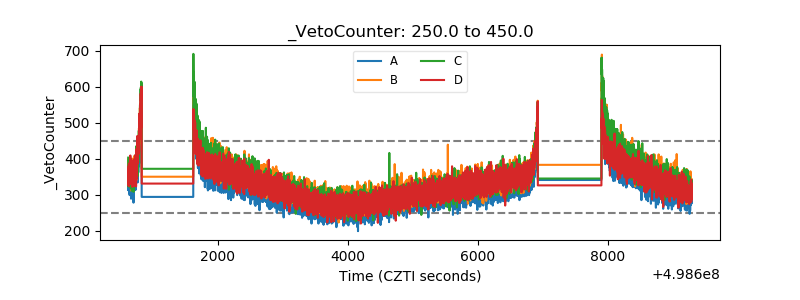 |