| Param | Original file | Final file |
|---|---|---|
| Filename | modeM0/AS1A14_126T19_9000006518_54428cztM0_level2.fits | modeM0/AS1A14_126T19_9000006518_54428cztM0_level2_quad_clean.evt |
| Size (bytes) | 526,409,280 | 88,162,560 |
| Size | 502.0 MB | 84.1 MB |
| Events in quadrant A | 2,923,260 | 622,667 |
| Events in quadrant B | 3,037,794 | 676,738 |
| Events in quadrant C | 6,824,023 | 476,115 |
| Events in quadrant D | 6,200,187 | 444,793 |
| Mode SS | |||
|---|---|---|---|
| Quadrant | BADHDUFLAG | Total packets | Discarded packets |
| A | 0 | 132 | 0 |
| B | 0 | 134 | 0 |
| C | 0 | 134 | 0 |
| D | 0 | 134 | 0 |
| Mode M0 | |||
|---|---|---|---|
| Quadrant | BADHDUFLAG | Total packets | Discarded packets |
| A | 0 | 13708 | 2 |
| B | 0 | 13794 | 2 |
| C | 0 | 24904 | 2 |
| D | 0 | 23030 | 2 |
| Mode M9 | |||
|---|---|---|---|
| Quadrant | BADHDUFLAG | Total packets | Discarded packets |
| A | 0 | 21 | 0 |
| B | 0 | 22 | 0 |
| C | 0 | 22 | 0 |
| D | 0 | 22 | 0 |
| Quadrant | Total seconds | Saturated seconds | Saturation percentage |
|---|---|---|---|
| A | 6435 | 88 | 1.367521% |
| B | 6435 | 49 | 0.761461% |
| C | 6435 | 1504 | 23.372183% |
| D | 6434 | 1414 | 21.976997% |
Noise dominated data is calculated using 1-second bins in cleaned event files. If a bin has >2000 counts, and if more than 50% of those come from <1% of pixels, then it is considered to be noise-dominated and hence unusable.
| Quadrant | # 1 sec bins | Bins with >0 counts | Bins with >2000 counts | High rate bins dominated by noise | Noise dominated (total time) | Noise dominated (detector-on time) | Marked lightcurve |
|---|---|---|---|---|---|---|---|
| A | 7595 | 6436 | 73 | 73 | 0.96% | 1.13% | 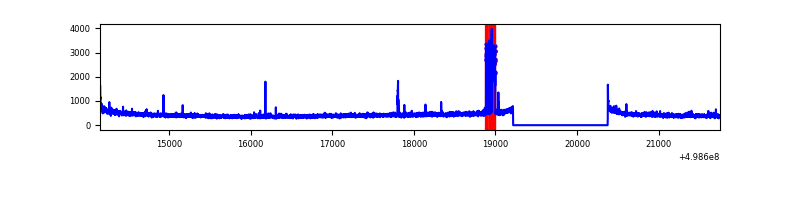 |
| B | 7595 | 6436 | 14 | 14 | 0.18% | 0.22% | 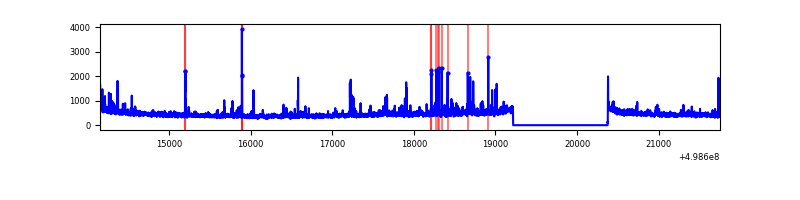 |
| C | 7595 | 6436 | 1473 | 1473 | 19.39% | 22.89% | 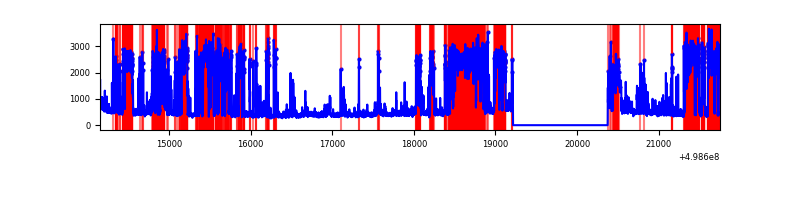 |
| D | 7594 | 6435 | 1124 | 1124 | 14.80% | 17.47% | 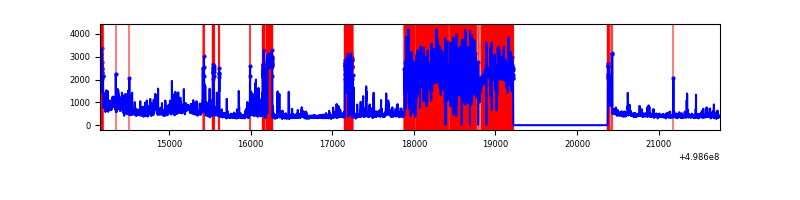 |
Top three noisy pixels from each quadrant. If the there are fewer than three noisy pixels in the level2.evt file, extra rows are filled as -1
| Pixel properties | Quadrant properties | ||||||
|---|---|---|---|---|---|---|---|
| Quadrant | DetID | PixID | Counts | Sigma | Mean | Median | Sigma |
| A | 5 | 243 | 207394 | 1243.42 | 673 | 657 | 166.3 |
| A | 4 | 3 | 28366 | 166.66 | 673 | 657 | 166.3 |
| A | 13 | 254 | 19877 | 115.6 | 673 | 657 | 166.3 |
| B | 10 | 247 | 87056 | 595.25 | 680 | 656 | 145.1 |
| B | 0 | 213 | 74364 | 507.81 | 680 | 656 | 145.1 |
| B | 0 | 171 | 50517 | 343.52 | 680 | 656 | 145.1 |
| C | 1 | 241 | 3578417 | 22042.67 | 591 | 585 | 162.3 |
| C | 13 | 3 | 412329 | 2536.71 | 591 | 585 | 162.3 |
| C | 1 | 16 | 168983 | 1037.48 | 591 | 585 | 162.3 |
| D | 8 | 176 | 2963600 | 18983.38 | 541 | 516 | 156.1 |
| D | 10 | 181 | 422462 | 2703.25 | 541 | 516 | 156.1 |
| D | 5 | 113 | 243934 | 1559.49 | 541 | 516 | 156.1 |
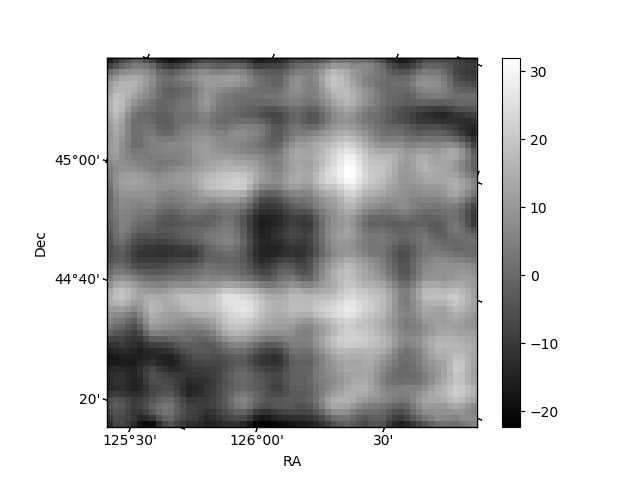
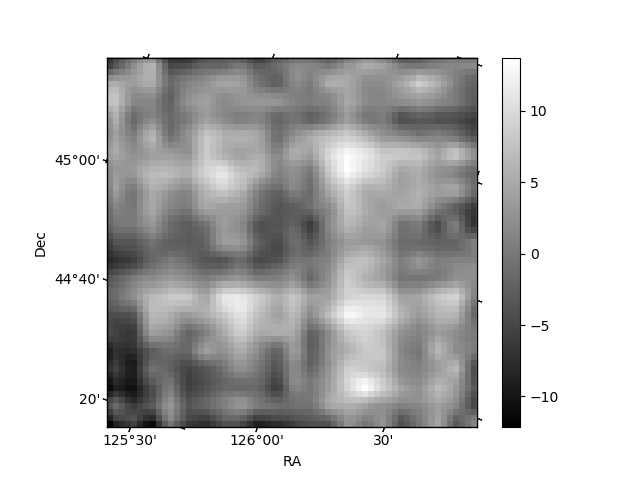
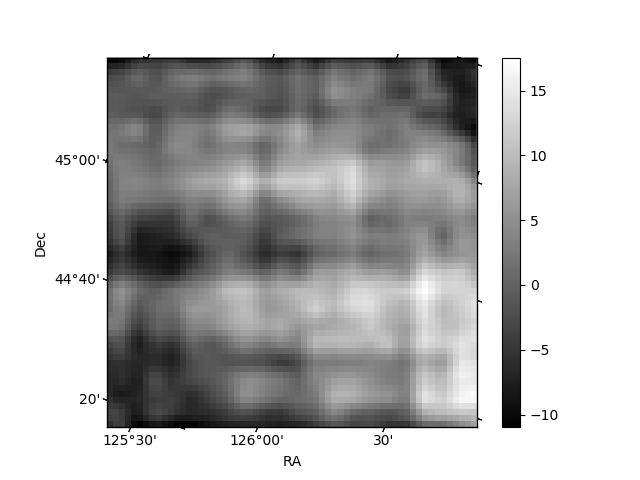
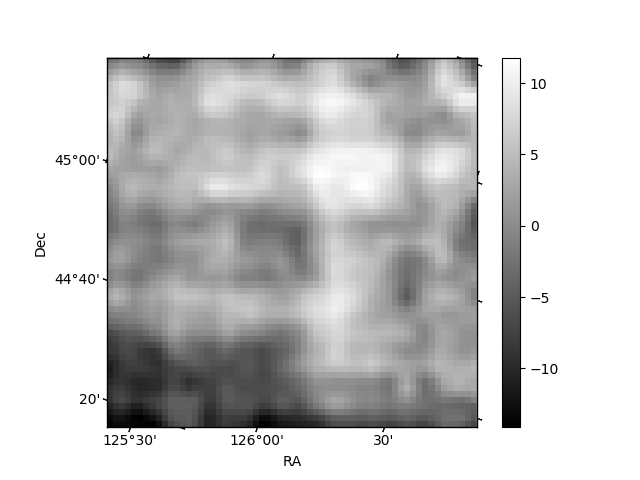
Histogram calculated using DETX and DETY for each event in the final _common_clean file
| Quadrant A | 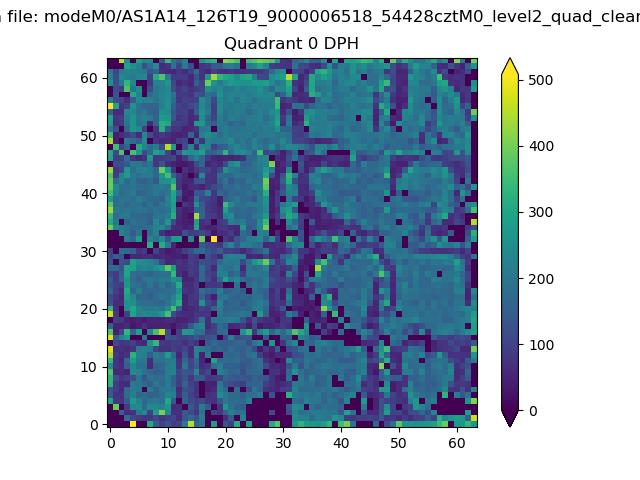 |
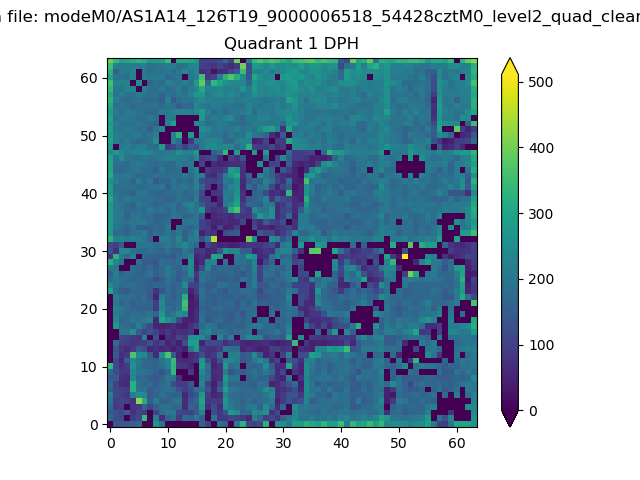 |
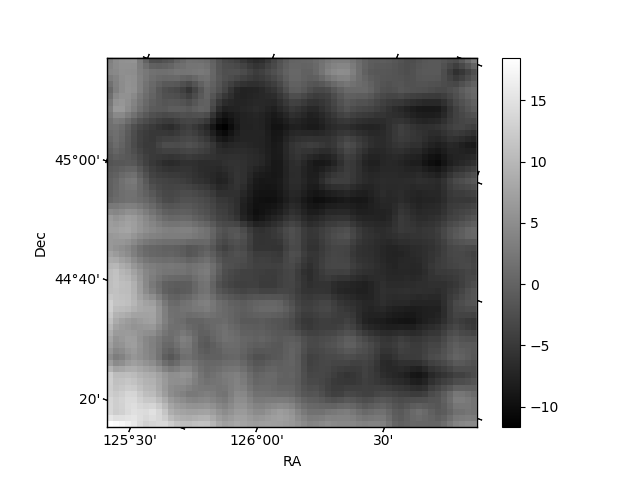
Quadrant B |
|---|---|---|---|
| Quadrant D | 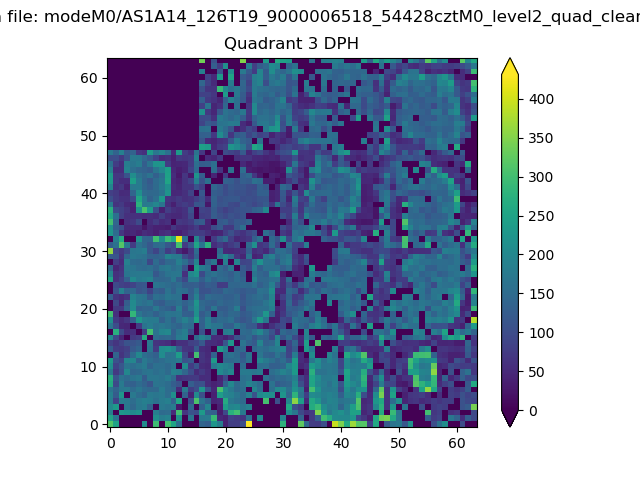 |
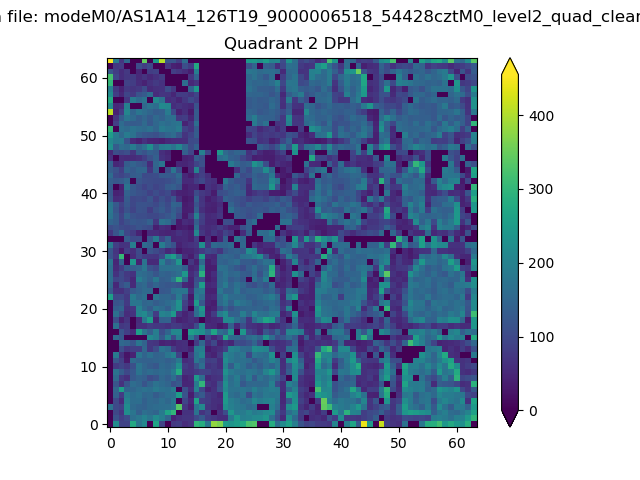 |
Quadrant C |
| Plot type | Count rate plots | Images |
|---|---|---|
| Comparison with Poisson distribution Blue bars denote a histogram of data divided into 1 sec bins. Red curve is a Poisson curve with rate = median count rate of data. |
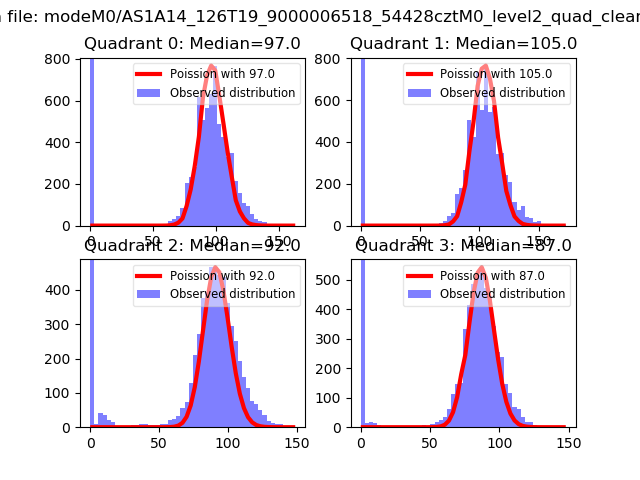 |
 |
| Quadrant-wise count rates Data is divided into 100 sec bins |
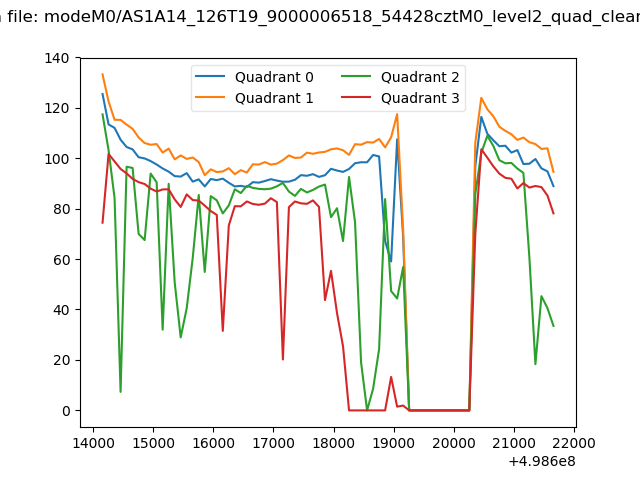 |
|
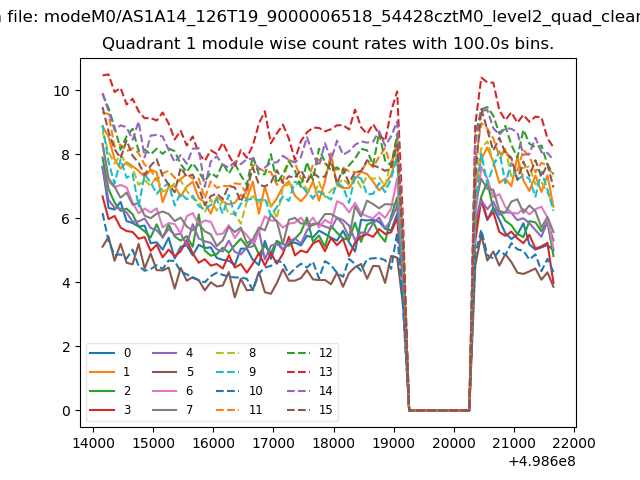
| Module-wise count rates for Quadrant A Data is divided into 100 sec bins |
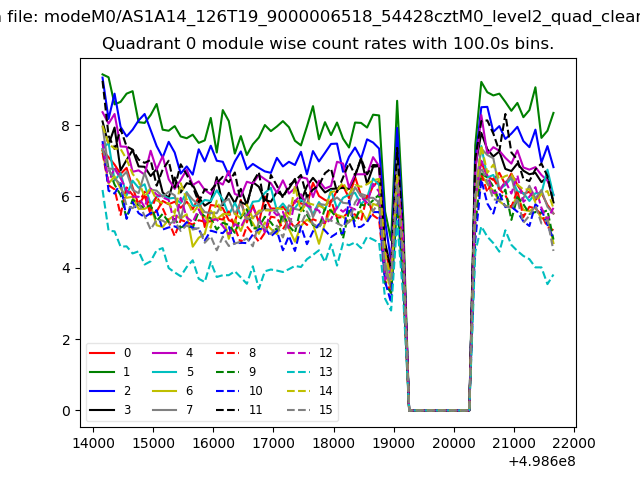 |
 |
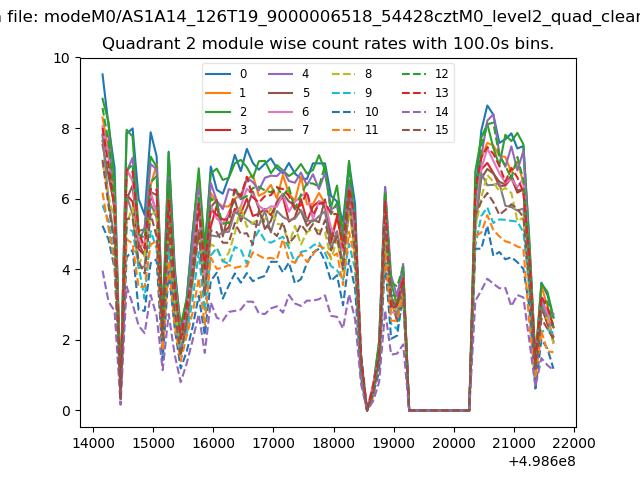
| Module-wise count rates for Quadrant B Data is divided into 100 sec bins |
 |
 |
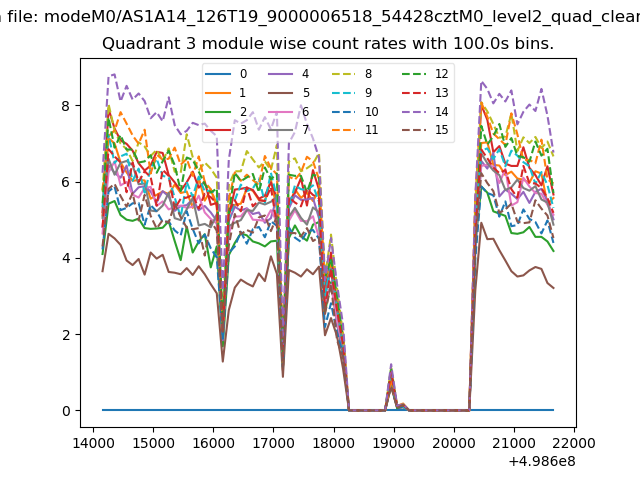
| Module-wise count rates for Quadrant C Data is divided into 100 sec bins |
 |
 |
| Module-wise count rates for Quadrant D Data is divided into 100 sec bins |
 |
 |
| Parameter | Plot |
|---|---|
| CZT HV Monitor | 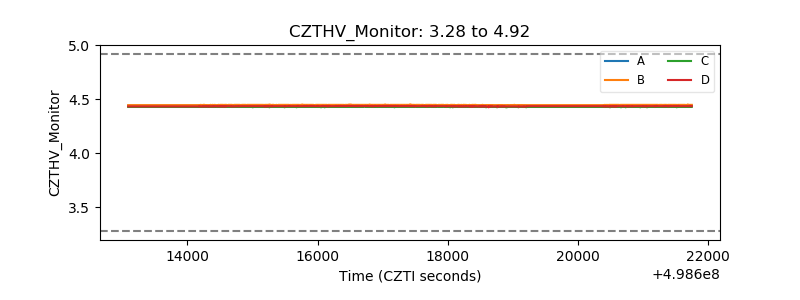 |
| D_VDD | 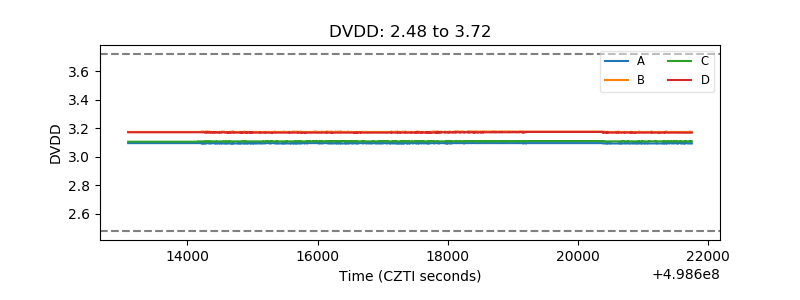 |
| Temperature 1 | 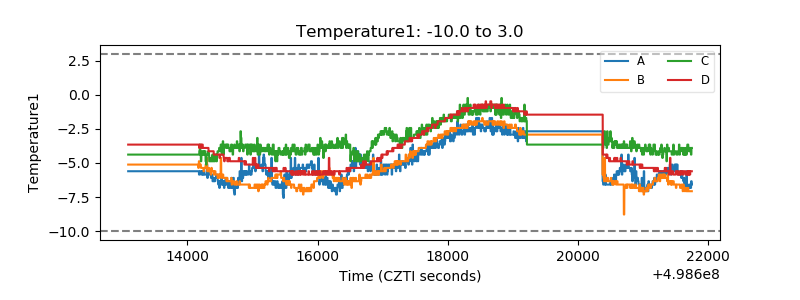 |
| Veto HV Monitor | 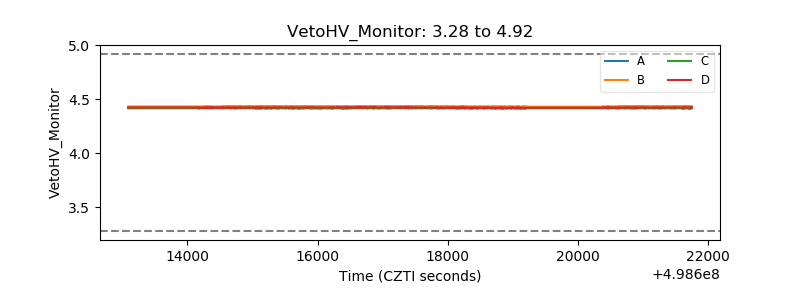 |
| Veto LLD | 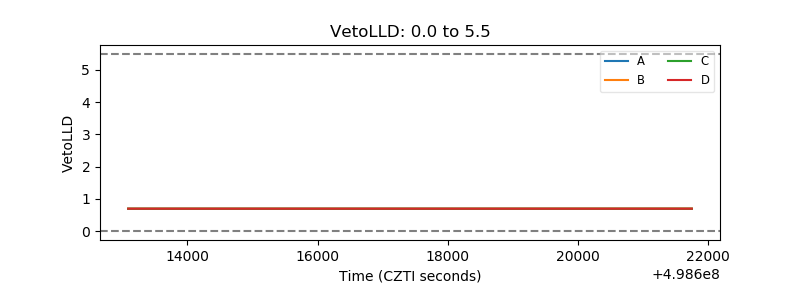 |
| Alpha Counter | 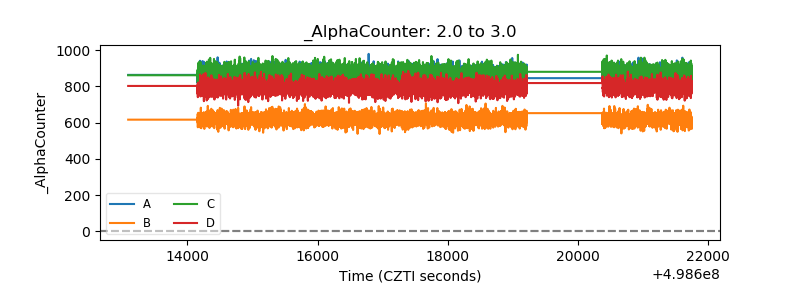 |
| _CPM_Rate | 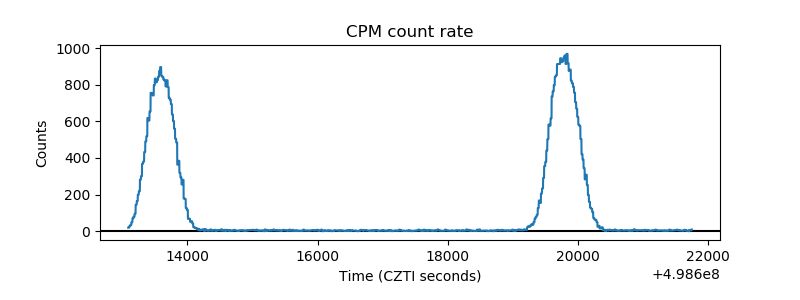 |
| CZT Counter | 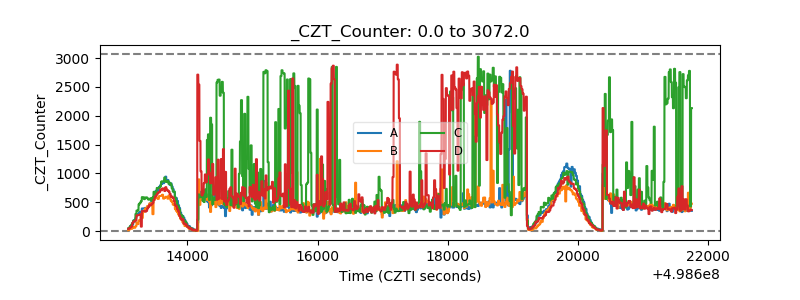 |
| +2.5 Volts monitor | 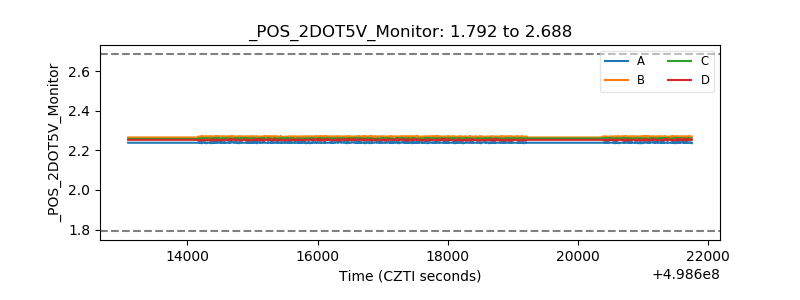 |
| +5 Volts monitor | 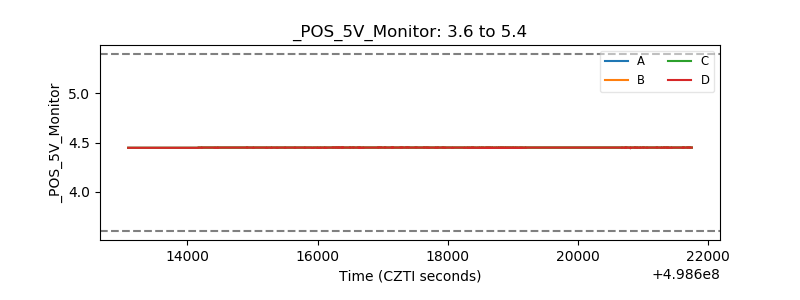 |
| _ROLL_ROT | 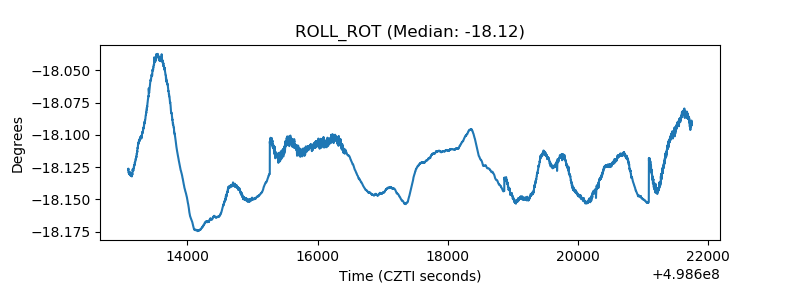 |
| _Roll_DEC | 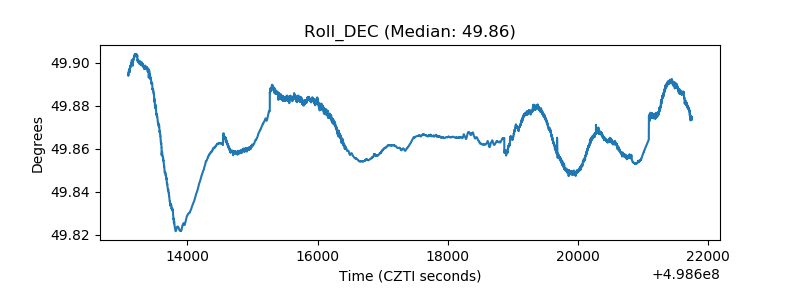 |
| _Roll_RA | 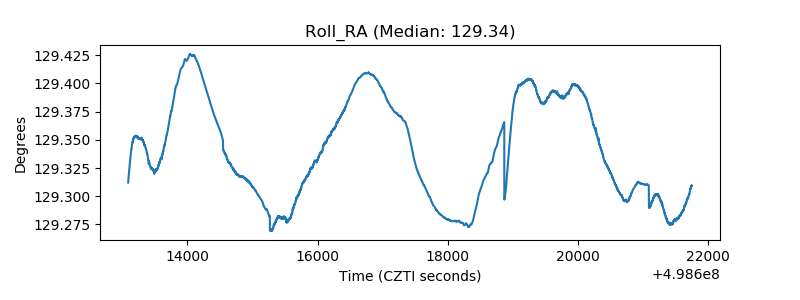 |
| Veto Counter | 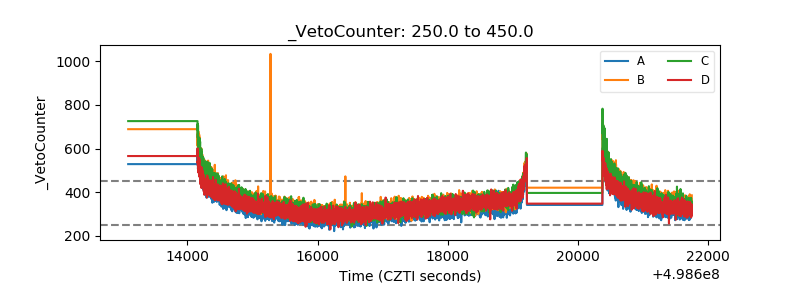 |