| Param | Original file | Final file |
|---|---|---|
| Filename | modeM0/AS1A14_126T19_9000006518_54430cztM0_level2.fits | modeM0/AS1A14_126T19_9000006518_54430cztM0_level2_quad_clean.evt |
| Size (bytes) | 612,452,160 | 90,046,080 |
| Size | 584.1 MB | 85.9 MB |
| Events in quadrant A | 3,001,338 | 646,274 |
| Events in quadrant B | 2,989,034 | 699,947 |
| Events in quadrant C | 4,810,597 | 571,314 |
| Events in quadrant D | 11,348,623 | 340,886 |
| Mode SS | |||
|---|---|---|---|
| Quadrant | BADHDUFLAG | Total packets | Discarded packets |
| A | 0 | 138 | 0 |
| B | 0 | 138 | 0 |
| C | 0 | 138 | 0 |
| D | 0 | 138 | 0 |
| Mode M0 | |||
|---|---|---|---|
| Quadrant | BADHDUFLAG | Total packets | Discarded packets |
| A | 0 | 14076 | 2 |
| B | 0 | 14057 | 2 |
| C | 0 | 19402 | 2 |
| D | 0 | 38333 | 2 |
| Mode M9 | |||
|---|---|---|---|
| Quadrant | BADHDUFLAG | Total packets | Discarded packets |
| A | 0 | 14 | 0 |
| B | 0 | 14 | 0 |
| C | 0 | 15 | 0 |
| D | 0 | 15 | 0 |
| Quadrant | Total seconds | Saturated seconds | Saturation percentage |
|---|---|---|---|
| A | 6708 | 37 | 0.551580% |
| B | 6708 | 52 | 0.775194% |
| C | 6708 | 616 | 9.183065% |
| D | 6708 | 2988 | 44.543828% |
Noise dominated data is calculated using 1-second bins in cleaned event files. If a bin has >2000 counts, and if more than 50% of those come from <1% of pixels, then it is considered to be noise-dominated and hence unusable.
| Quadrant | # 1 sec bins | Bins with >0 counts | Bins with >2000 counts | High rate bins dominated by noise | Noise dominated (total time) | Noise dominated (detector-on time) | Marked lightcurve |
|---|---|---|---|---|---|---|---|
| A | 7823 | 6709 | 15 | 15 | 0.19% | 0.22% | 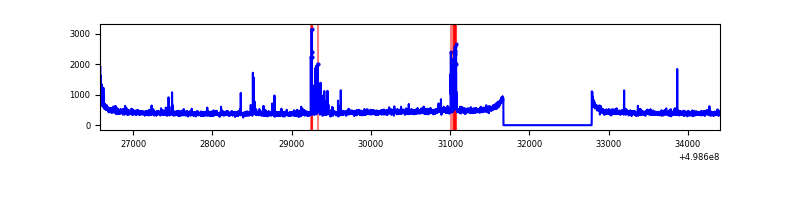 |
| B | 7823 | 6709 | 4 | 4 | 0.05% | 0.06% | 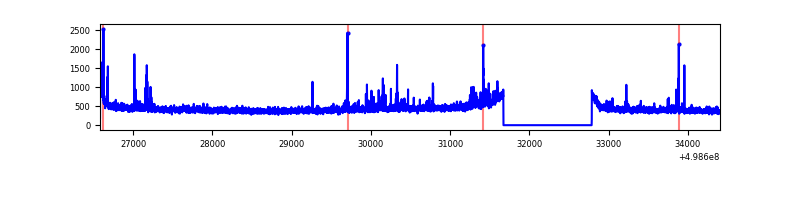 |
| C | 7823 | 6709 | 574 | 574 | 7.34% | 8.56% | 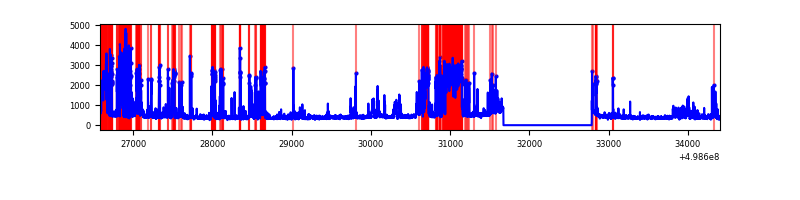 |
| D | 7823 | 6709 | 2843 | 2843 | 36.34% | 42.38% | 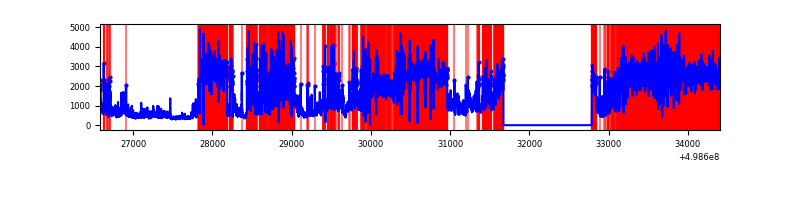 |
Top three noisy pixels from each quadrant. If the there are fewer than three noisy pixels in the level2.evt file, extra rows are filled as -1
| Pixel properties | Quadrant properties | ||||||
|---|---|---|---|---|---|---|---|
| Quadrant | DetID | PixID | Counts | Sigma | Mean | Median | Sigma |
| A | 0 | 8 | 137719 | 773.56 | 710 | 692 | 177.1 |
| A | 11 | 3 | 45183 | 251.17 | 710 | 692 | 177.1 |
| A | 4 | 3 | 23385 | 128.11 | 710 | 692 | 177.1 |
| B | 10 | 247 | 55270 | 361.56 | 703 | 679 | 151.0 |
| B | 0 | 213 | 53672 | 350.98 | 703 | 679 | 151.0 |
| B | 0 | 171 | 31350 | 203.13 | 703 | 679 | 151.0 |
| C | 1 | 241 | 1233244 | 6855.15 | 654 | 649 | 179.8 |
| C | 13 | 3 | 555944 | 3088.31 | 654 | 649 | 179.8 |
| C | 12 | 249 | 164897 | 913.47 | 654 | 649 | 179.8 |
| D | 8 | 176 | 6881537 | 47574.05 | 504 | 482 | 144.6 |
| D | 15 | 108 | 1263144 | 8729.76 | 504 | 482 | 144.6 |
| D | 7 | 70 | 729400 | 5039.57 | 504 | 482 | 144.6 |
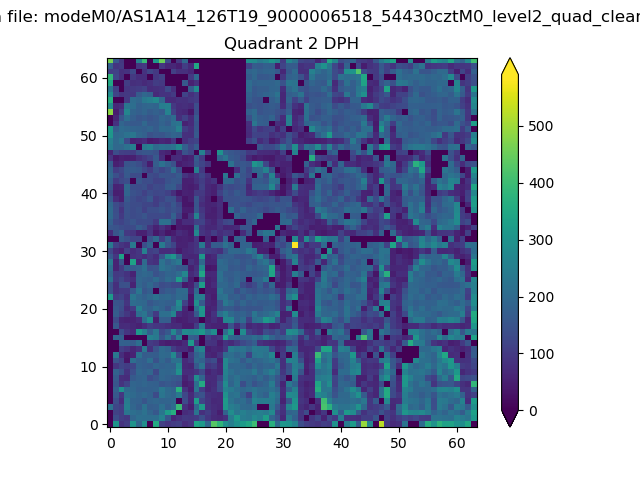
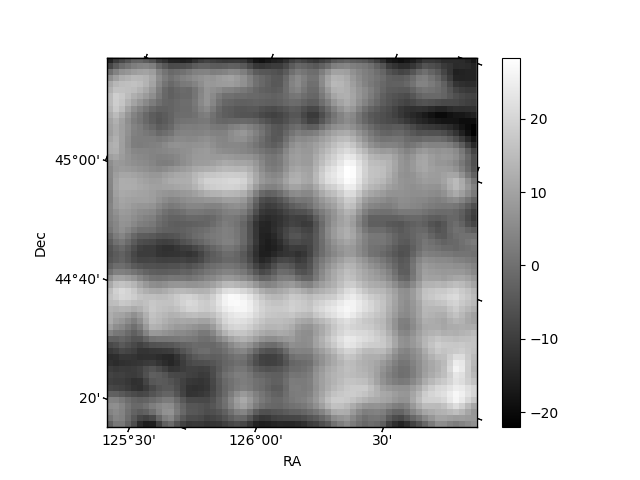
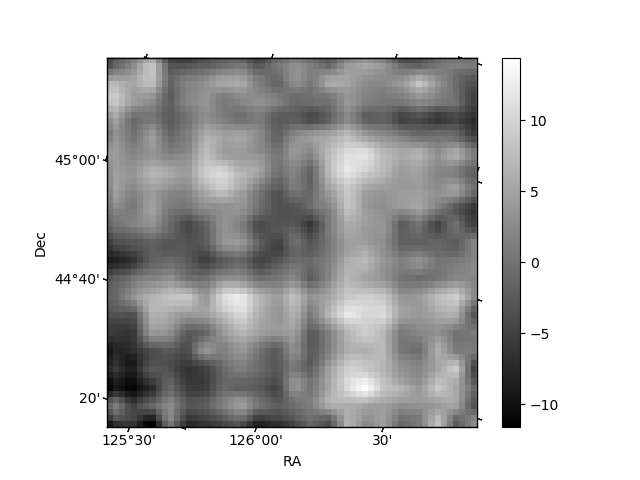
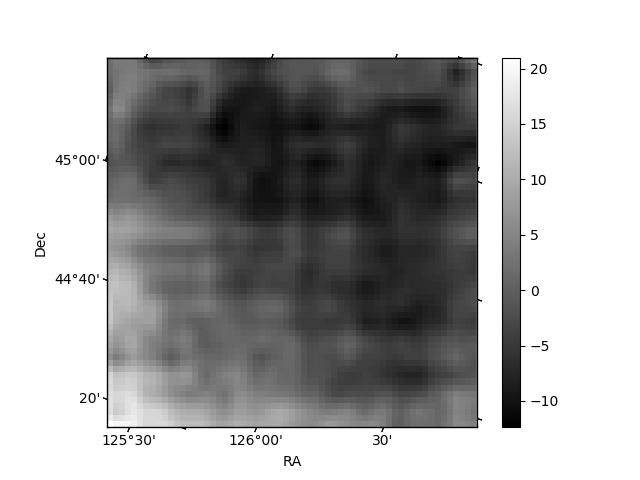
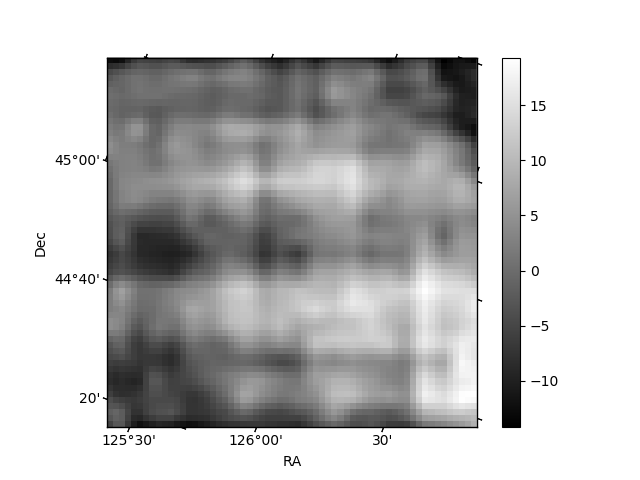
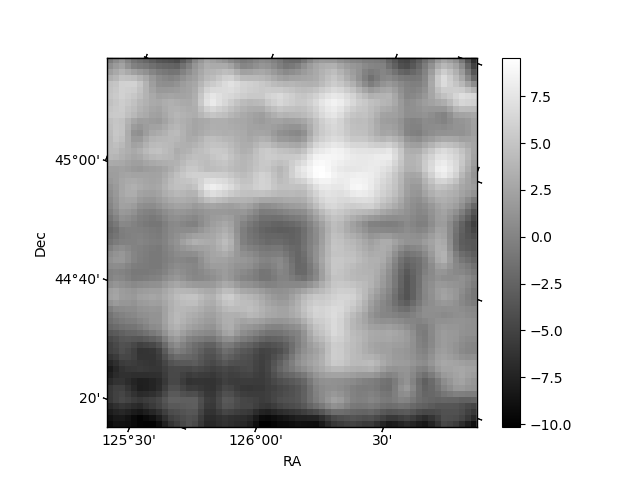
Histogram calculated using DETX and DETY for each event in the final _common_clean file
| Quadrant A | 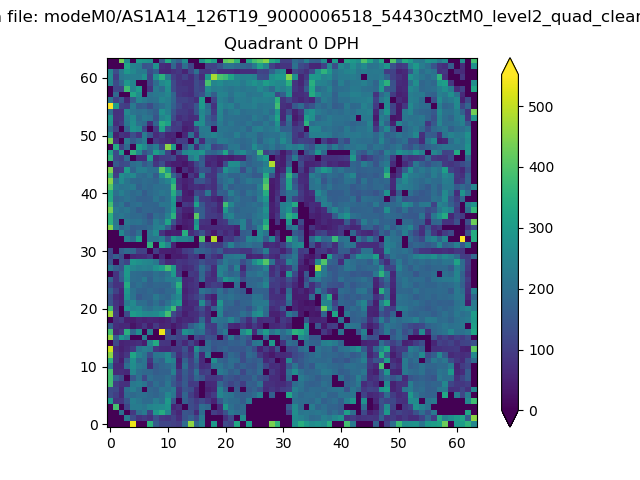 |
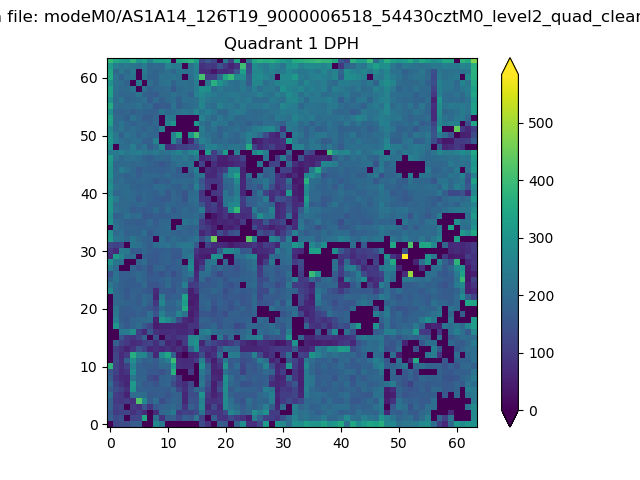 |
Quadrant B |
|---|---|---|---|
| Quadrant D | 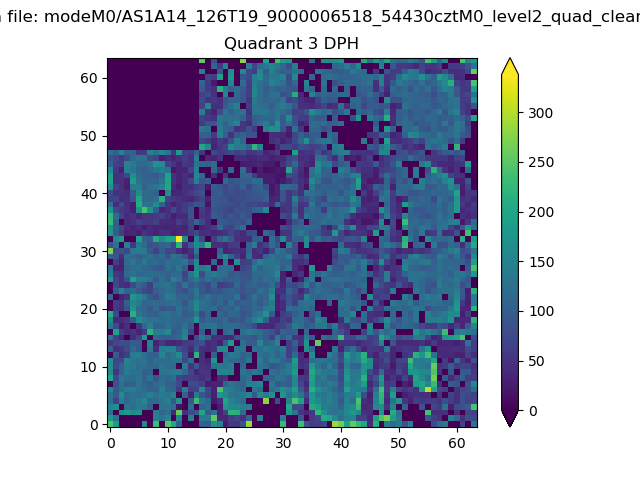 |
 |
Quadrant C |
| Plot type | Count rate plots | Images |
|---|---|---|
| Comparison with Poisson distribution Blue bars denote a histogram of data divided into 1 sec bins. Red curve is a Poisson curve with rate = median count rate of data. |
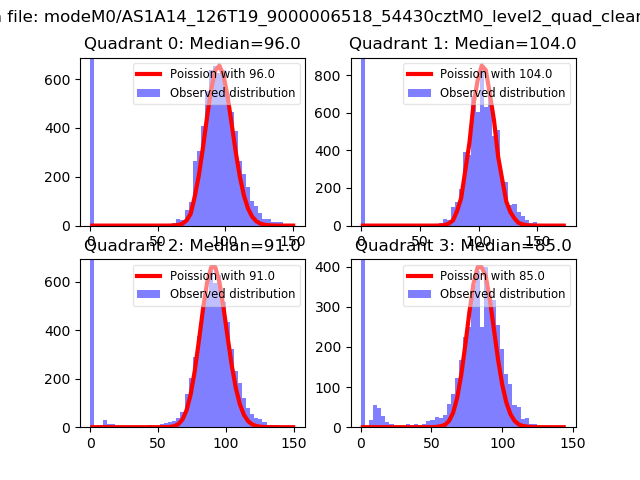 |
 |
| Quadrant-wise count rates Data is divided into 100 sec bins |
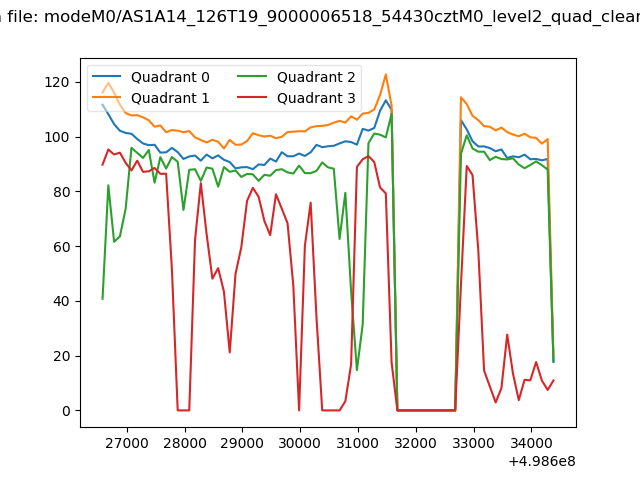 |
|
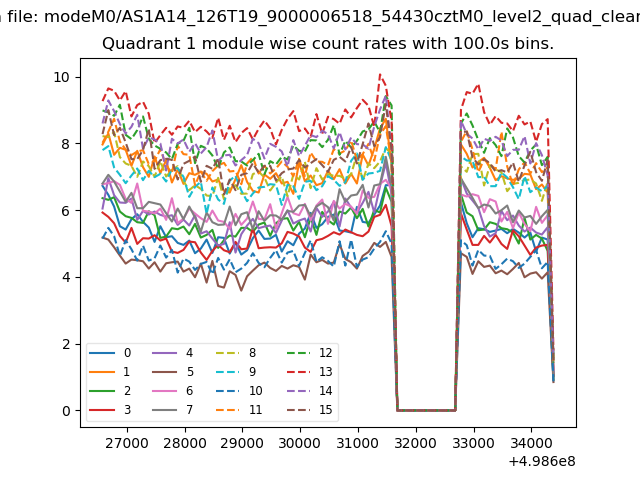
| Module-wise count rates for Quadrant A Data is divided into 100 sec bins |
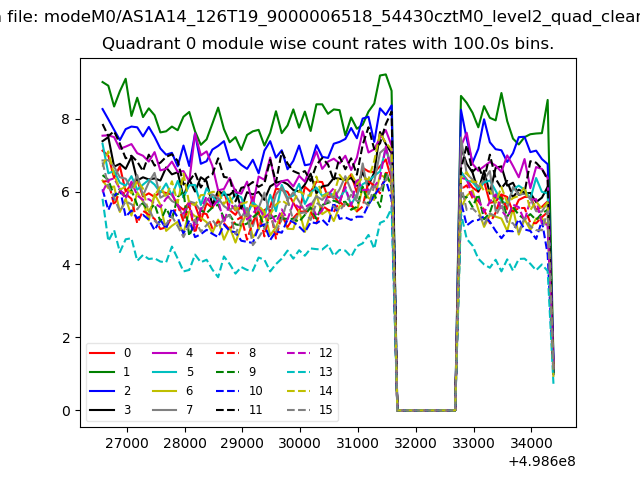 |
 |
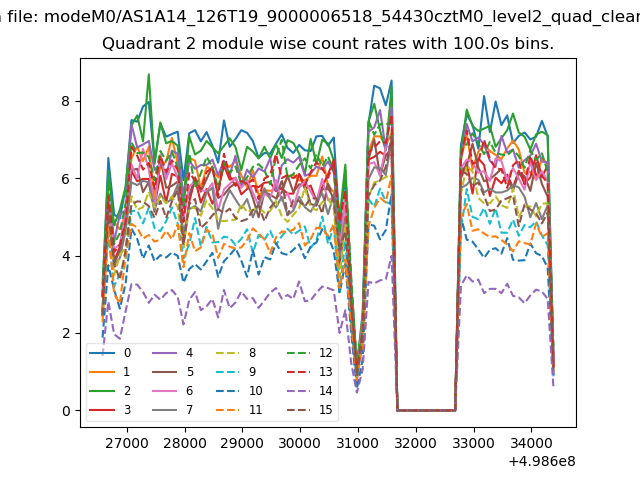
| Module-wise count rates for Quadrant B Data is divided into 100 sec bins |
 |
 |
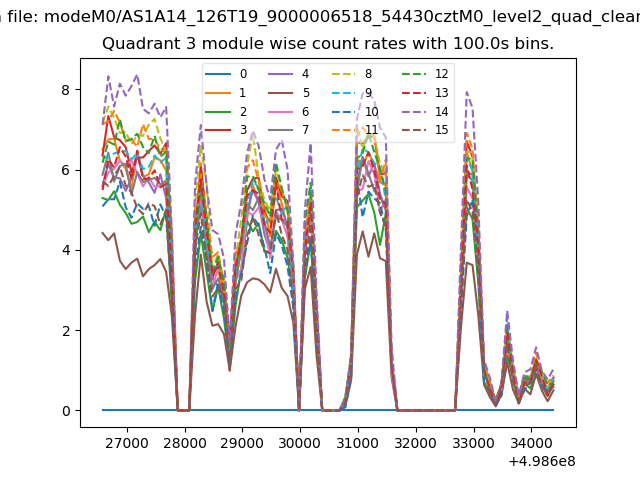
| Module-wise count rates for Quadrant C Data is divided into 100 sec bins |
 |
 |
| Module-wise count rates for Quadrant D Data is divided into 100 sec bins |
 |
 |
| Parameter | Plot |
|---|---|
| CZT HV Monitor | 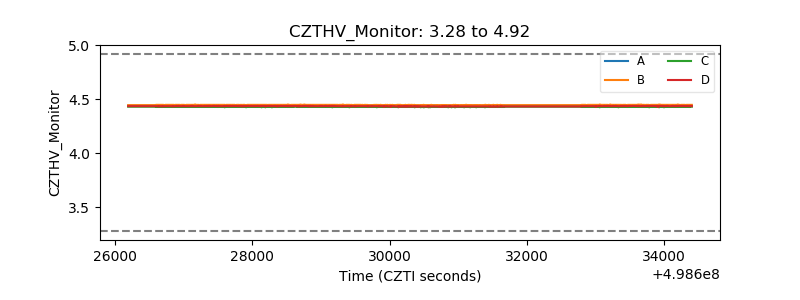 |
| D_VDD | 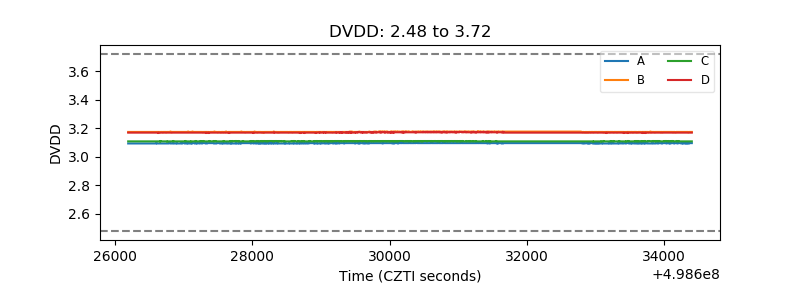 |
| Temperature 1 | 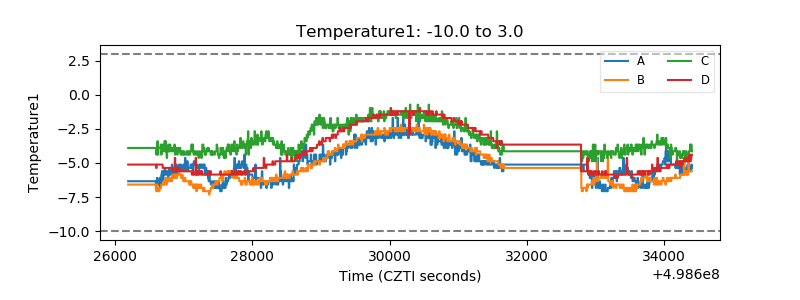 |
| Veto HV Monitor | 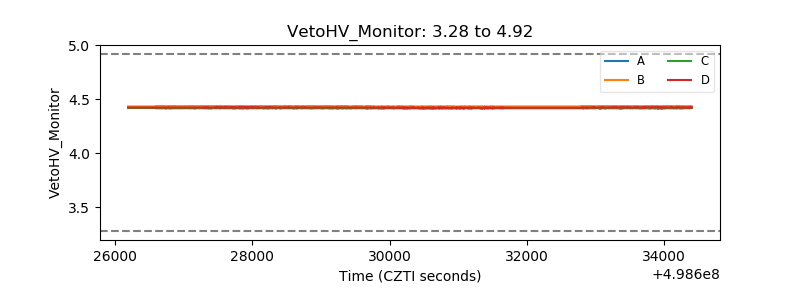 |
| Veto LLD | 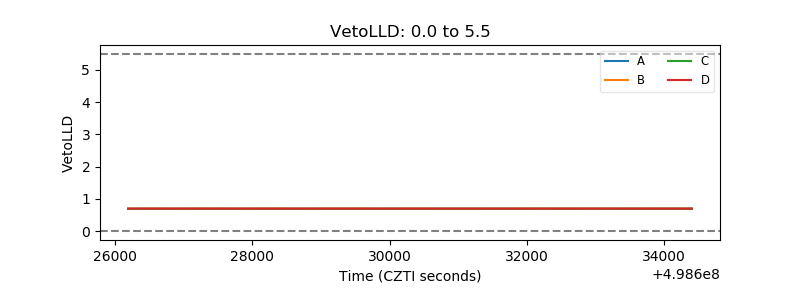 |
| Alpha Counter | 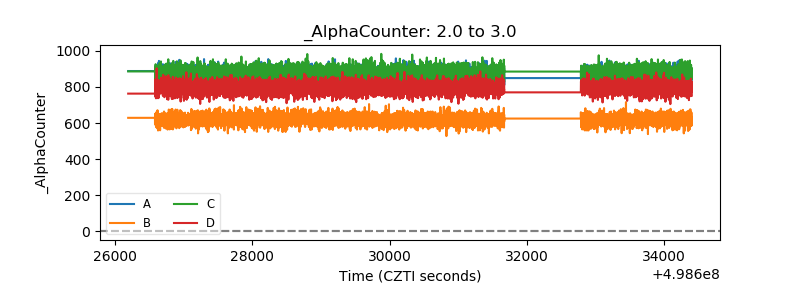 |
| _CPM_Rate | 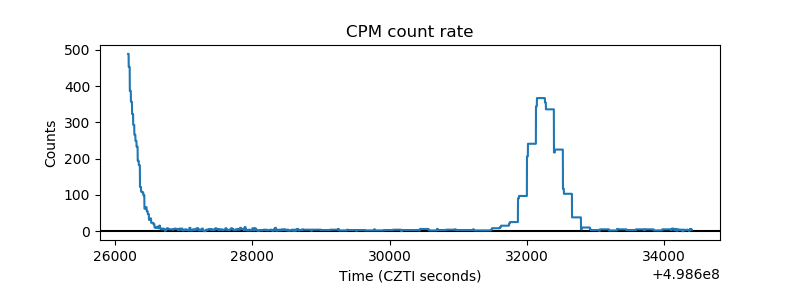 |
| CZT Counter | 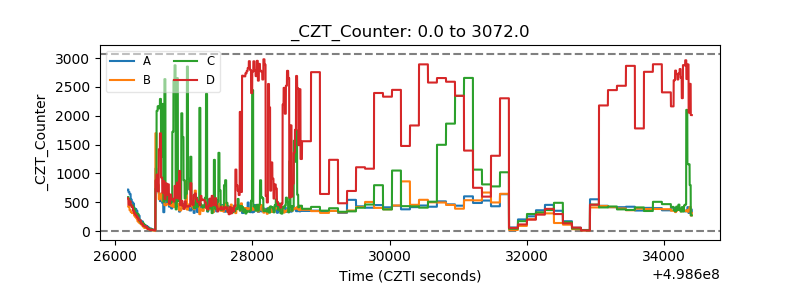 |
| +2.5 Volts monitor | 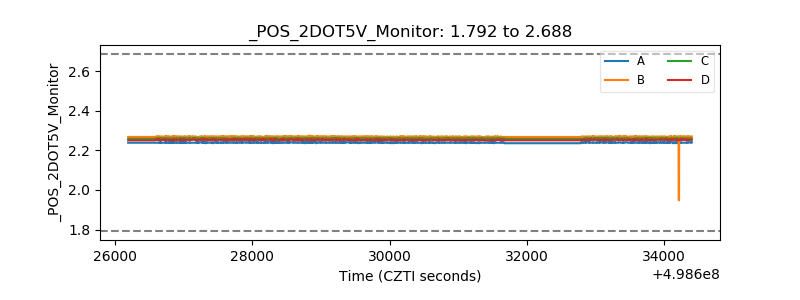 |
| +5 Volts monitor | 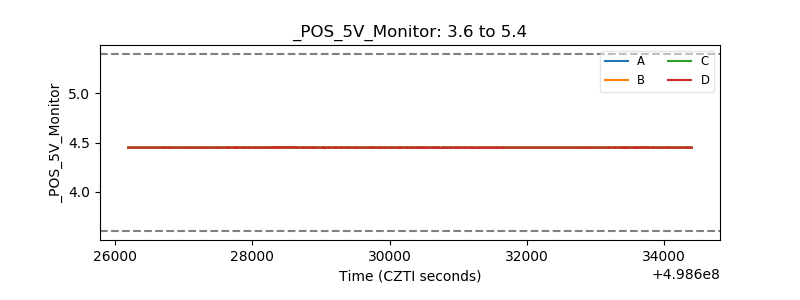 |
| _ROLL_ROT | 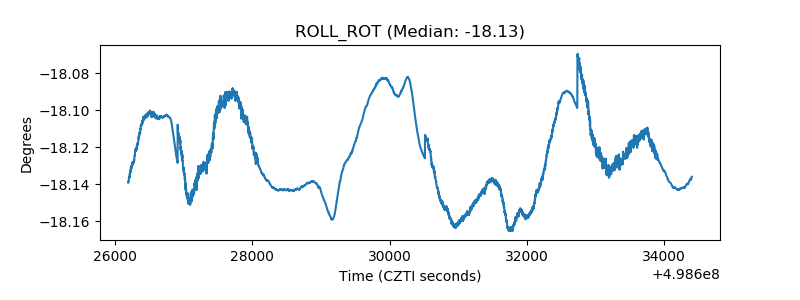 |
| _Roll_DEC | 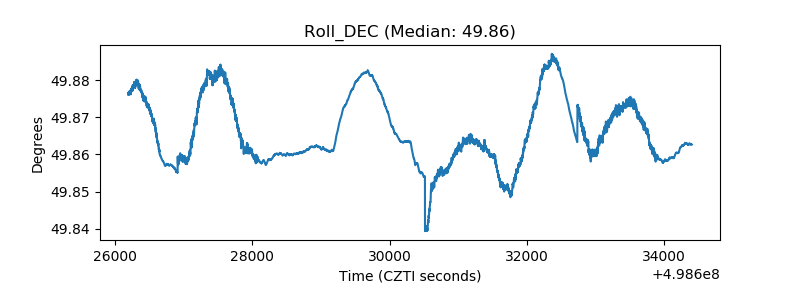 |
| _Roll_RA | 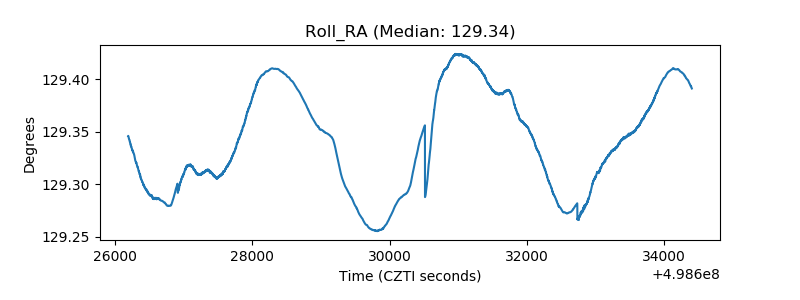 |
| Veto Counter | 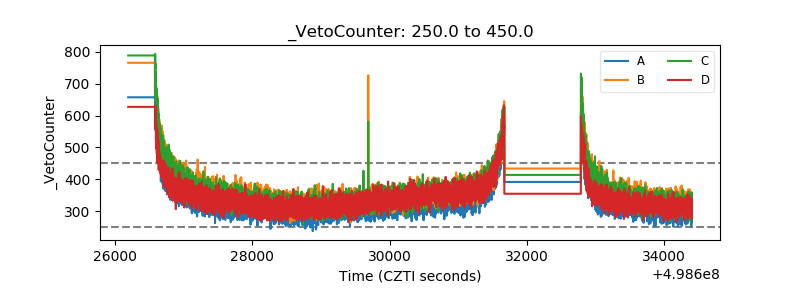 |