| Param | Original file | Final file |
|---|---|---|
| Filename | modeM0/AS1A14_126T19_9000006518_54432cztM0_level2.fits | modeM0/AS1A14_126T19_9000006518_54432cztM0_level2_quad_clean.evt |
| Size (bytes) | 632,819,520 | 81,187,200 |
| Size | 603.5 MB | 77.4 MB |
| Events in quadrant A | 2,815,952 | 605,729 |
| Events in quadrant B | 2,930,052 | 645,051 |
| Events in quadrant C | 3,805,485 | 560,806 |
| Events in quadrant D | 13,360,522 | 187,427 |
| Mode SS | |||
|---|---|---|---|
| Quadrant | BADHDUFLAG | Total packets | Discarded packets |
| A | 0 | 134 | 0 |
| B | 0 | 134 | 0 |
| C | 0 | 134 | 0 |
| D | 0 | 134 | 0 |
| Mode M0 | |||
|---|---|---|---|
| Quadrant | BADHDUFLAG | Total packets | Discarded packets |
| A | 0 | 13537 | 1 |
| B | 0 | 13801 | 1 |
| C | 0 | 16402 | 1 |
| D | 0 | 44198 | 3 |
| Mode M9 | |||
|---|---|---|---|
| Quadrant | BADHDUFLAG | Total packets | Discarded packets |
| A | 0 | 4 | 0 |
| B | 0 | 4 | 0 |
| C | 0 | 4 | 0 |
| D | 0 | 4 | 0 |
| Quadrant | Total seconds | Saturated seconds | Saturation percentage |
|---|---|---|---|
| A | 6582 | 149 | 2.263750% |
| B | 6583 | 189 | 2.871031% |
| C | 6583 | 397 | 6.030685% |
| D | 6582 | 4576 | 69.522941% |
Noise dominated data is calculated using 1-second bins in cleaned event files. If a bin has >2000 counts, and if more than 50% of those come from <1% of pixels, then it is considered to be noise-dominated and hence unusable.
| Quadrant | # 1 sec bins | Bins with >0 counts | Bins with >2000 counts | High rate bins dominated by noise | Noise dominated (total time) | Noise dominated (detector-on time) | Marked lightcurve |
|---|---|---|---|---|---|---|---|
| A | 7007 | 6583 | 0 | 0 | 0.00% | 0.00% | 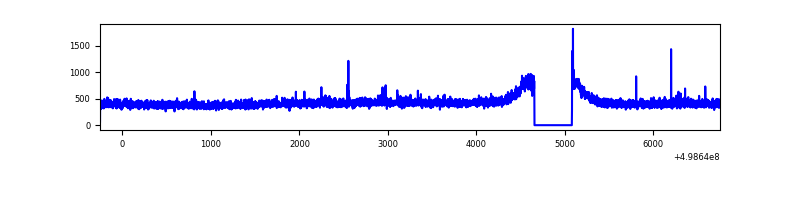 |
| B | 7008 | 6584 | 5 | 5 | 0.07% | 0.08% | 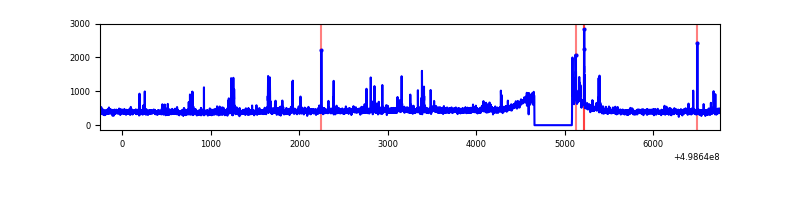 |
| C | 7008 | 6584 | 328 | 328 | 4.68% | 4.98% | 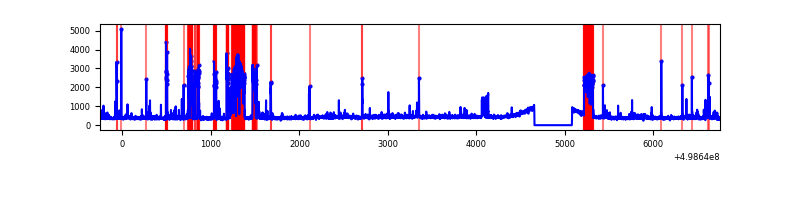 |
| D | 7007 | 6583 | 3658 | 3658 | 52.20% | 55.57% | 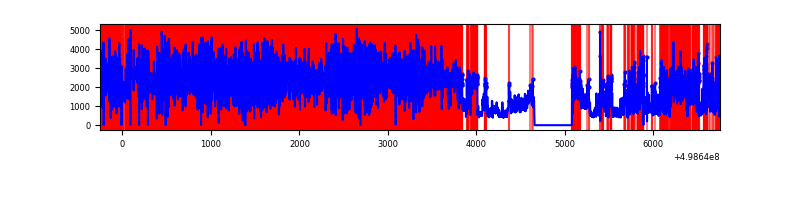 |
Top three noisy pixels from each quadrant. If the there are fewer than three noisy pixels in the level2.evt file, extra rows are filled as -1
| Pixel properties | Quadrant properties | ||||||
|---|---|---|---|---|---|---|---|
| Quadrant | DetID | PixID | Counts | Sigma | Mean | Median | Sigma |
| A | 4 | 3 | 31211 | 174.76 | 708 | 688 | 174.7 |
| A | 13 | 254 | 17019 | 93.51 | 708 | 688 | 174.7 |
| A | 0 | 8 | 10378 | 55.48 | 708 | 688 | 174.7 |
| B | 0 | 213 | 109282 | 727.62 | 690 | 663 | 149.3 |
| B | 10 | 247 | 38800 | 255.47 | 690 | 663 | 149.3 |
| B | 12 | 111 | 18110 | 116.87 | 690 | 663 | 149.3 |
| C | 1 | 241 | 649622 | 3524.27 | 666 | 657 | 184.1 |
| C | 5 | 10 | 224235 | 1214.16 | 666 | 657 | 184.1 |
| C | 14 | 254 | 142090 | 768.07 | 666 | 657 | 184.1 |
| D | 8 | 176 | 8667155 | 79291.74 | 384 | 366 | 109.3 |
| D | 7 | 70 | 2801069 | 25623.4 | 384 | 366 | 109.3 |
| D | 8 | 160 | 95752 | 872.68 | 384 | 366 | 109.3 |
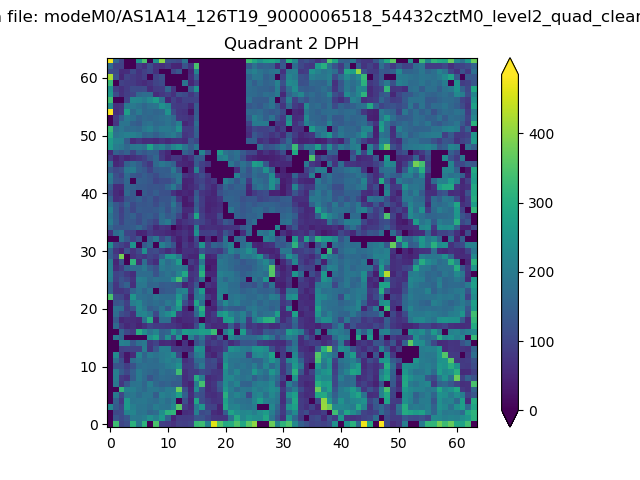
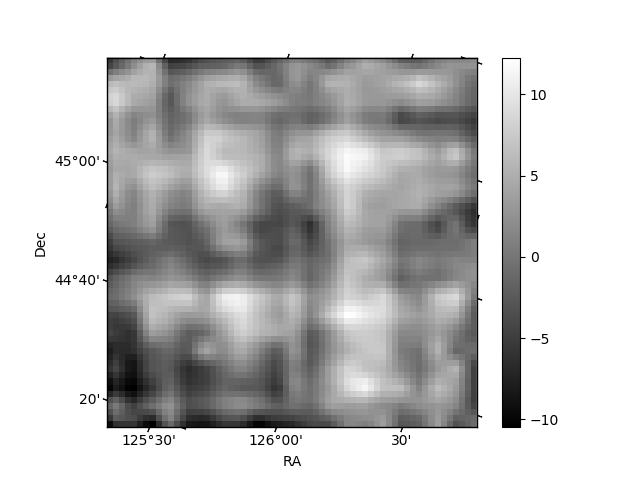
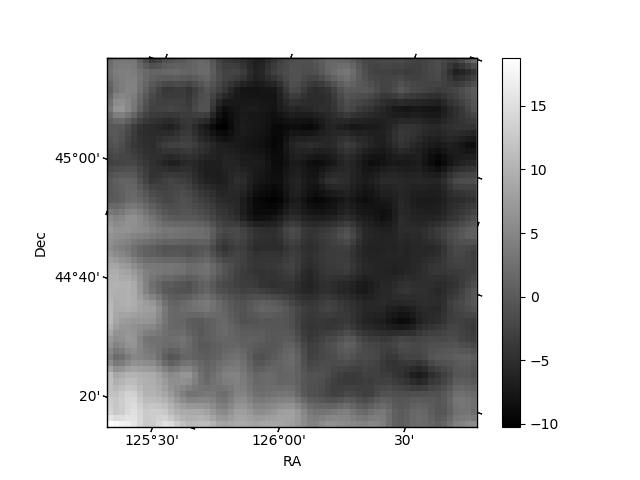
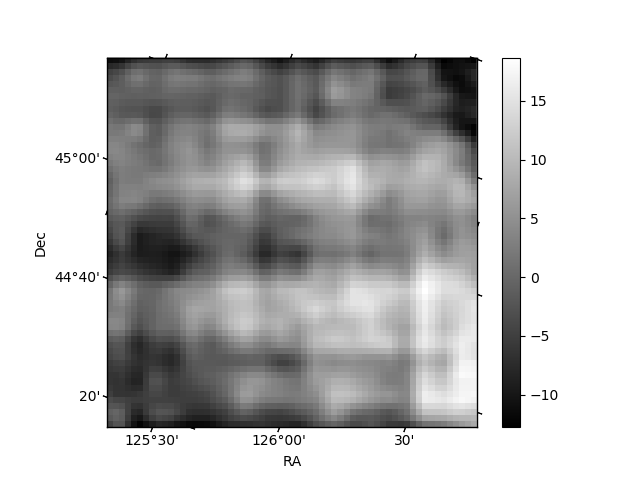
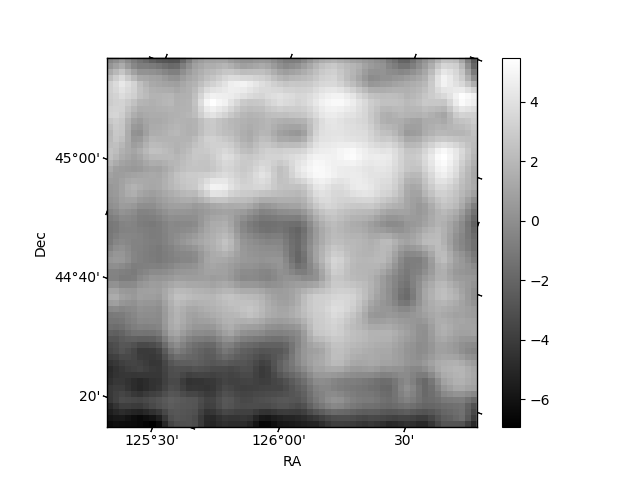
Histogram calculated using DETX and DETY for each event in the final _common_clean file
| Quadrant A | 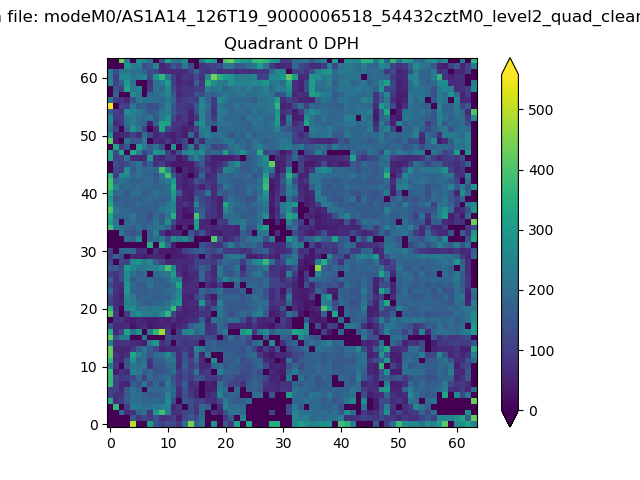 |
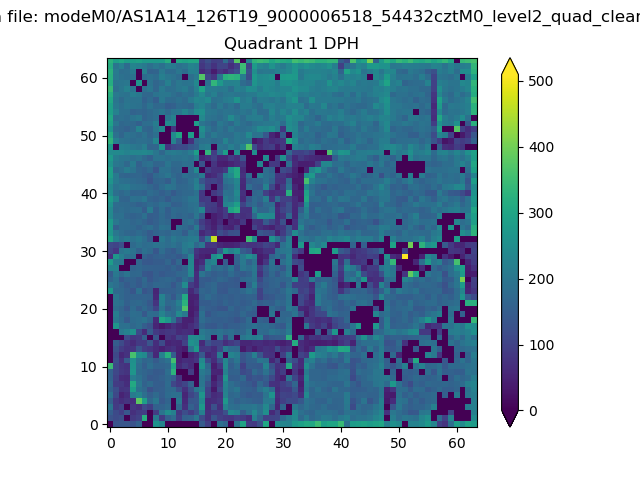 |
Quadrant B |
|---|---|---|---|
| Quadrant D | 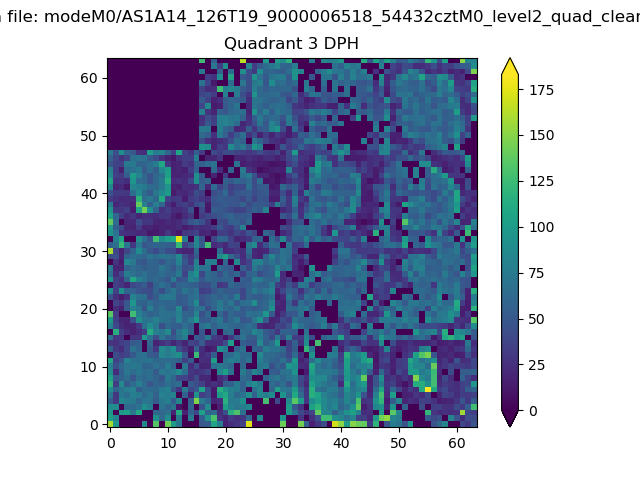 |
 |
Quadrant C |
| Plot type | Count rate plots | Images |
|---|---|---|
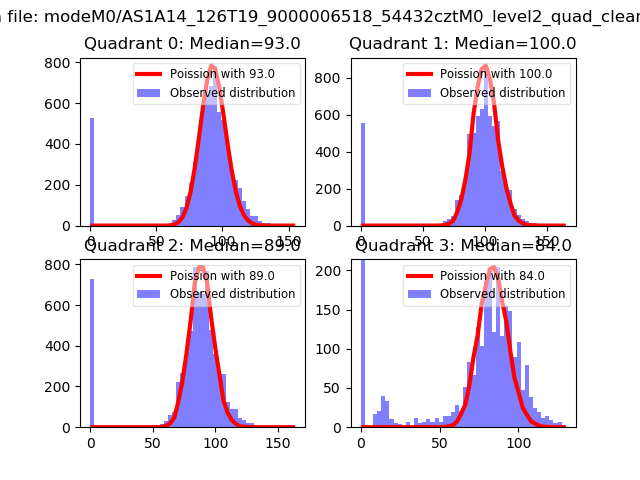
| Comparison with Poisson distribution Blue bars denote a histogram of data divided into 1 sec bins. Red curve is a Poisson curve with rate = median count rate of data. |
 |
 |
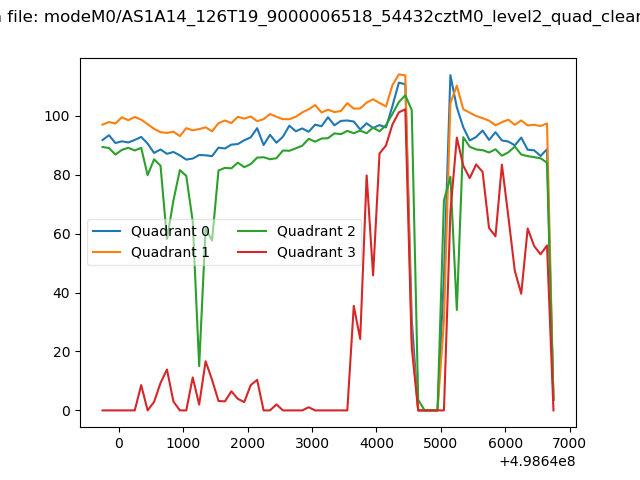
| Quadrant-wise count rates Data is divided into 100 sec bins |
 |
|
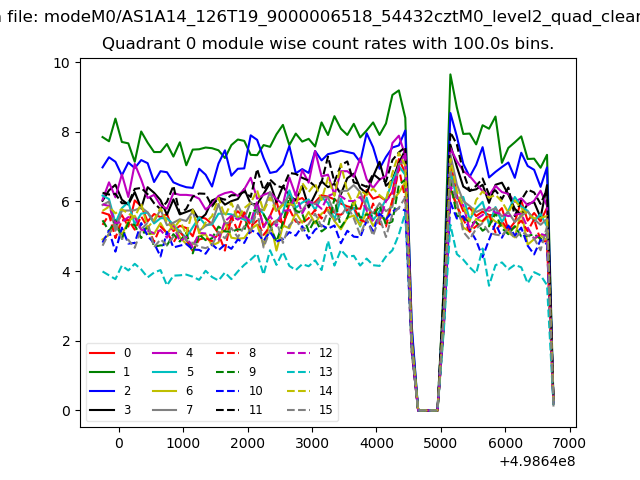
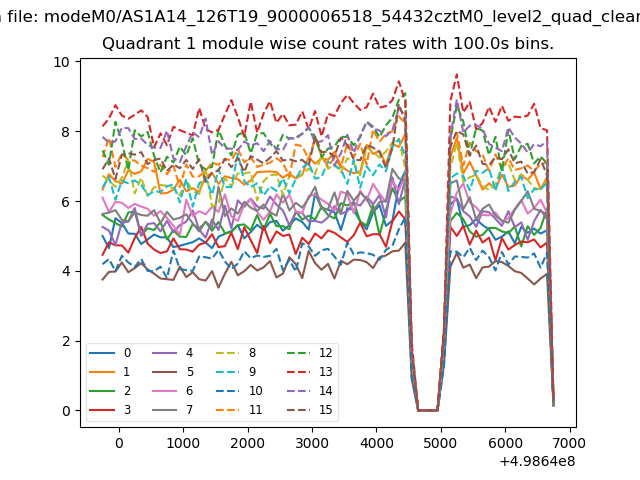
| Module-wise count rates for Quadrant A Data is divided into 100 sec bins |
 |
 |
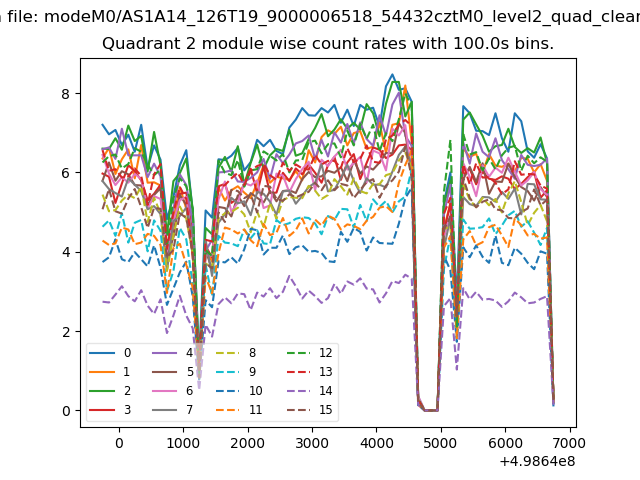
| Module-wise count rates for Quadrant B Data is divided into 100 sec bins |
 |
 |
| Module-wise count rates for Quadrant C Data is divided into 100 sec bins |
 |
 |
| Module-wise count rates for Quadrant D Data is divided into 100 sec bins |
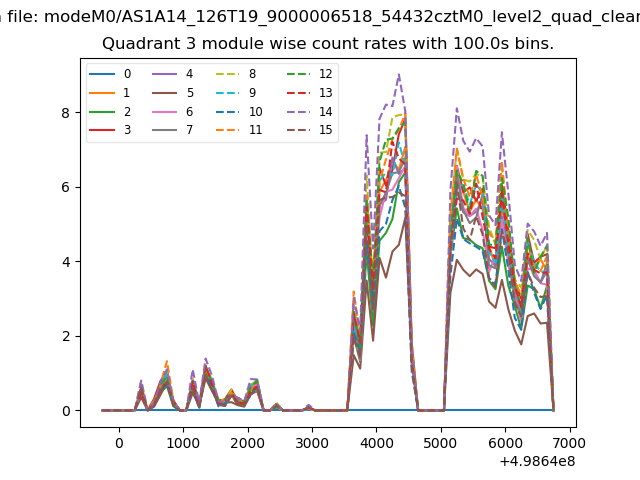 |
 |
| Parameter | Plot |
|---|---|
| CZT HV Monitor | 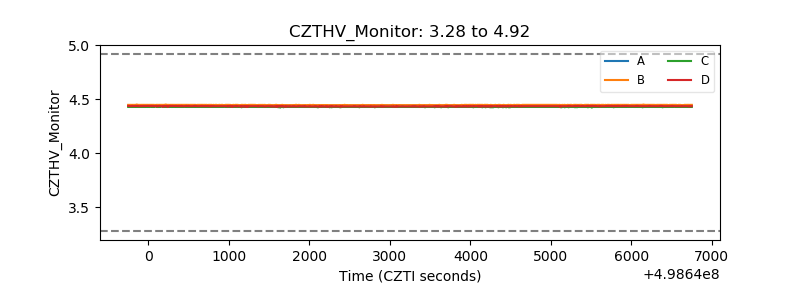 |
| D_VDD | 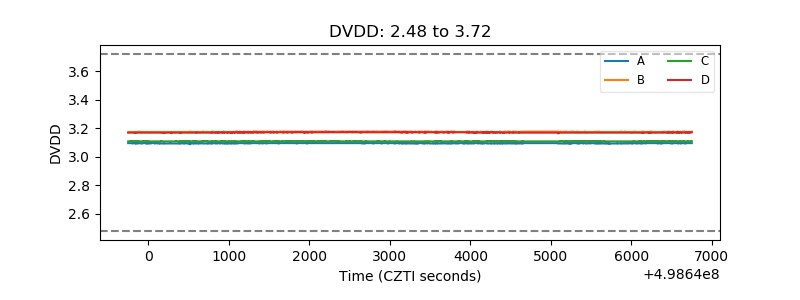 |
| Temperature 1 | 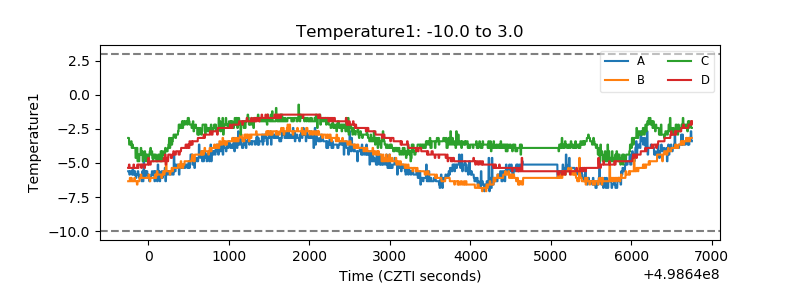 |
| Veto HV Monitor | 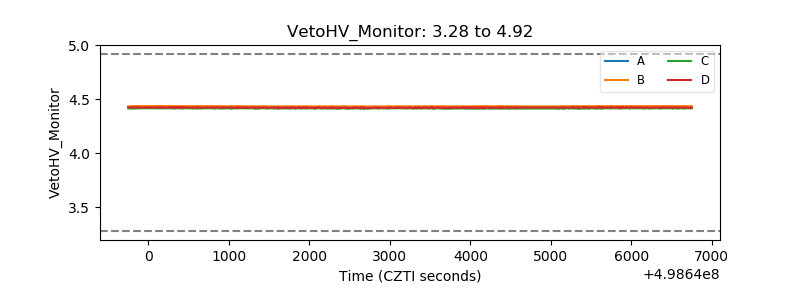 |
| Veto LLD | 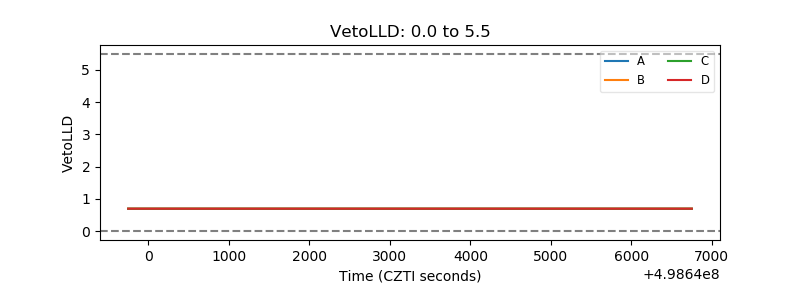 |
| Alpha Counter | 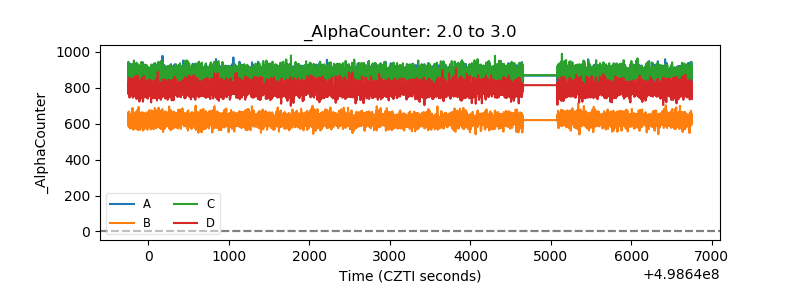 |
| _CPM_Rate | 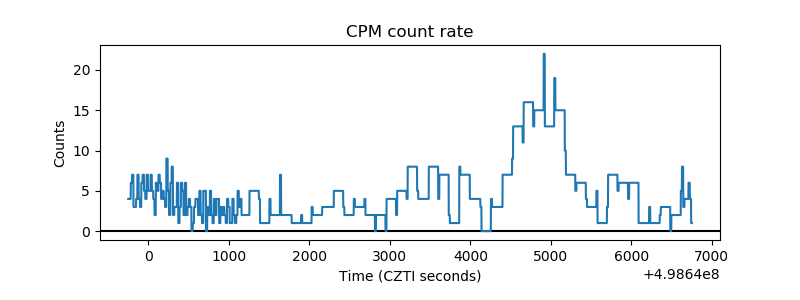 |
| CZT Counter | 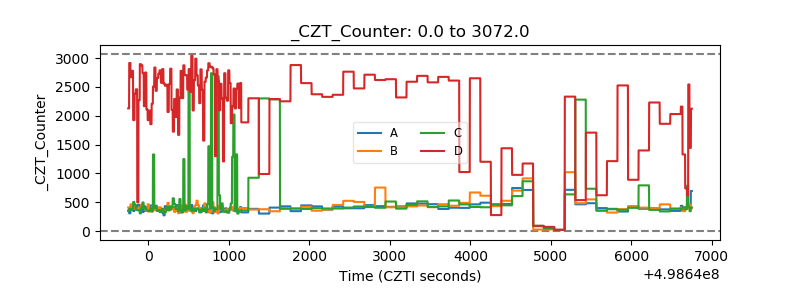 |
| +2.5 Volts monitor | 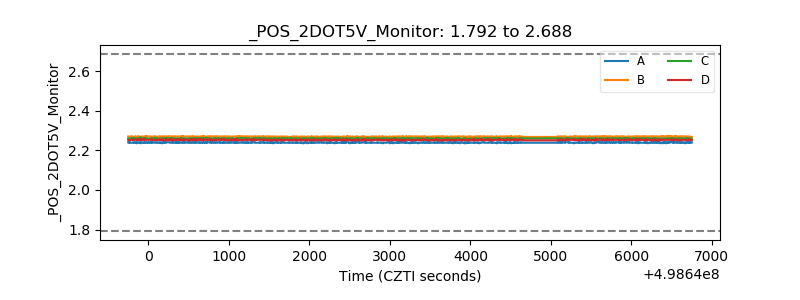 |
| +5 Volts monitor |  |
| _ROLL_ROT | 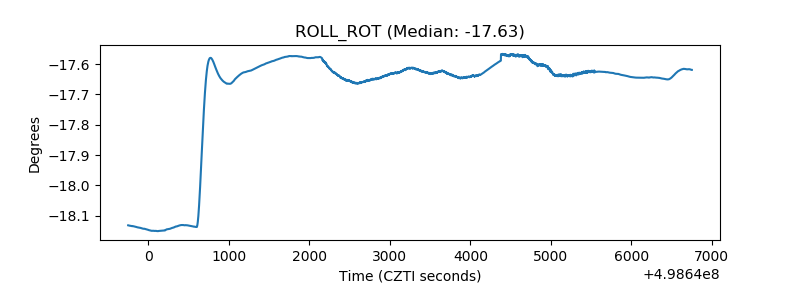 |
| _Roll_DEC | 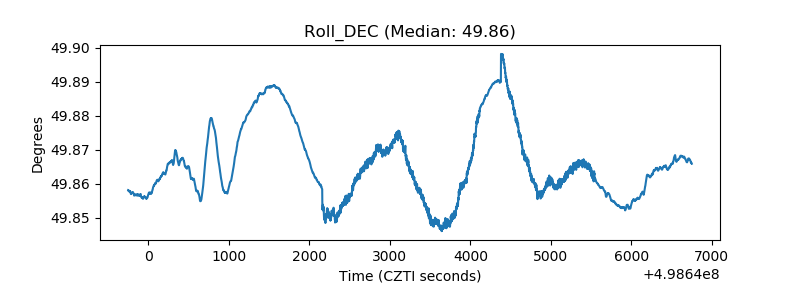 |
| _Roll_RA | 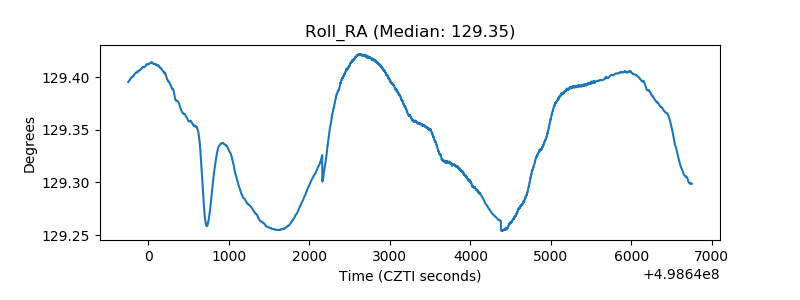 |
| Veto Counter | 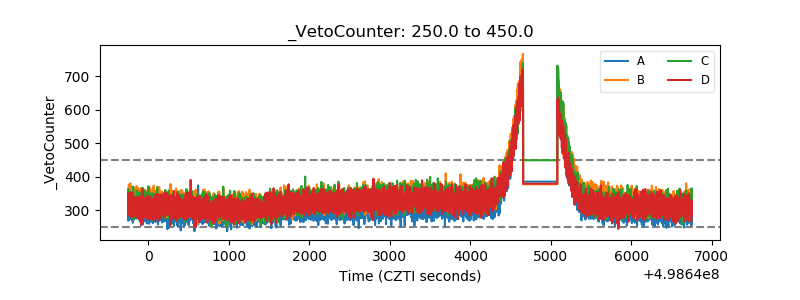 |