| Param | Original file | Final file |
|---|---|---|
| Filename | modeM0/AS1A14_126T19_9000006518_54433cztM0_level2.fits | modeM0/AS1A14_126T19_9000006518_54433cztM0_level2_quad_clean.evt |
| Size (bytes) | 669,712,320 | 92,128,320 |
| Size | 638.7 MB | 87.9 MB |
| Events in quadrant A | 3,069,107 | 677,515 |
| Events in quadrant B | 3,357,989 | 725,917 |
| Events in quadrant C | 3,553,212 | 644,107 |
| Events in quadrant D | 14,242,592 | 233,973 |
| Mode SS | |||
|---|---|---|---|
| Quadrant | BADHDUFLAG | Total packets | Discarded packets |
| A | 0 | 146 | 0 |
| B | 0 | 146 | 0 |
| C | 0 | 146 | 0 |
| D | 0 | 146 | 0 |
| Mode M0 | |||
|---|---|---|---|
| Quadrant | BADHDUFLAG | Total packets | Discarded packets |
| A | 0 | 14875 | 0 |
| B | 0 | 15501 | 0 |
| C | 0 | 15608 | 0 |
| D | 0 | 47327 | 0 |
| Quadrant | Total seconds | Saturated seconds | Saturation percentage |
|---|---|---|---|
| A | 7294 | 9 | 0.123389% |
| B | 7295 | 52 | 0.712817% |
| C | 7295 | 27 | 0.370117% |
| D | 7295 | 4809 | 65.921864% |
Noise dominated data is calculated using 1-second bins in cleaned event files. If a bin has >2000 counts, and if more than 50% of those come from <1% of pixels, then it is considered to be noise-dominated and hence unusable.
| Quadrant | # 1 sec bins | Bins with >0 counts | Bins with >2000 counts | High rate bins dominated by noise | Noise dominated (total time) | Noise dominated (detector-on time) | Marked lightcurve |
|---|---|---|---|---|---|---|---|
| A | 7294 | 7294 | 0 | 0 | 0.00% | 0.00% | 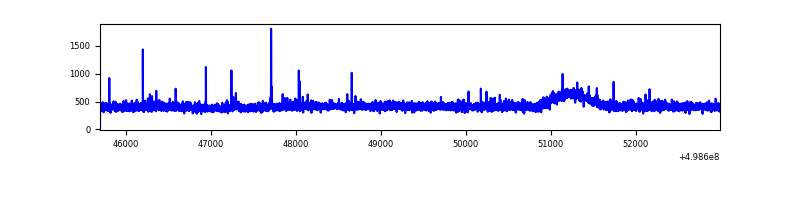 |
| B | 7295 | 7295 | 16 | 16 | 0.22% | 0.22% | 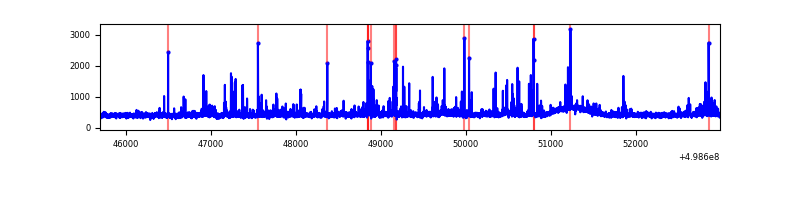 |
| C | 7295 | 7295 | 22 | 22 | 0.30% | 0.30% | 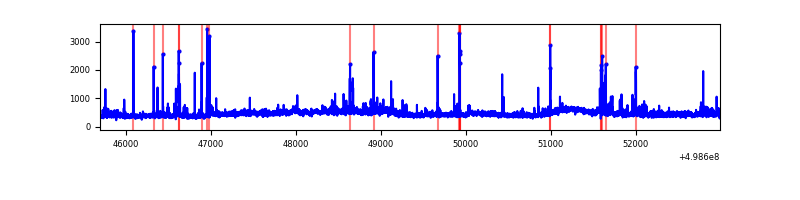 |
| D | 7295 | 7292 | 3673 | 3673 | 50.35% | 50.37% | 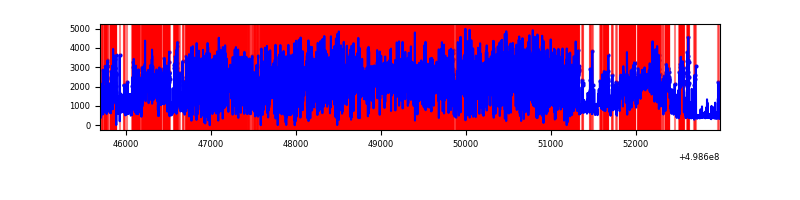 |
Top three noisy pixels from each quadrant. If the there are fewer than three noisy pixels in the level2.evt file, extra rows are filled as -1
| Pixel properties | Quadrant properties | ||||||
|---|---|---|---|---|---|---|---|
| Quadrant | DetID | PixID | Counts | Sigma | Mean | Median | Sigma |
| A | 4 | 3 | 27530 | 141.31 | 768 | 749 | 189.5 |
| A | 11 | 3 | 19457 | 98.72 | 768 | 749 | 189.5 |
| A | 13 | 254 | 18872 | 95.63 | 768 | 749 | 189.5 |
| B | 10 | 247 | 98528 | 606.95 | 755 | 727 | 161.1 |
| B | 0 | 213 | 89102 | 548.45 | 755 | 727 | 161.1 |
| B | 5 | 185 | 54695 | 334.92 | 755 | 727 | 161.1 |
| C | 11 | 244 | 309477 | 1528.0 | 738 | 730 | 202.1 |
| C | 14 | 254 | 193116 | 952.12 | 738 | 730 | 202.1 |
| C | 1 | 16 | 57365 | 280.29 | 738 | 730 | 202.1 |
| D | 8 | 176 | 8665849 | 64414.71 | 468 | 446 | 134.5 |
| D | 7 | 70 | 2980199 | 22150.15 | 468 | 446 | 134.5 |
| D | 3 | 12 | 460144 | 3417.19 | 468 | 446 | 134.5 |
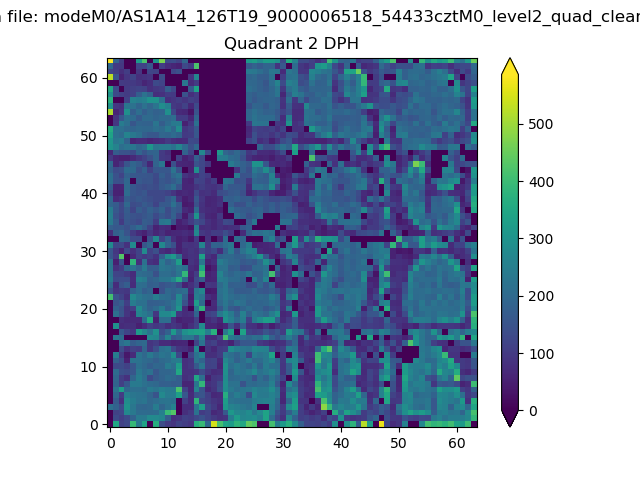
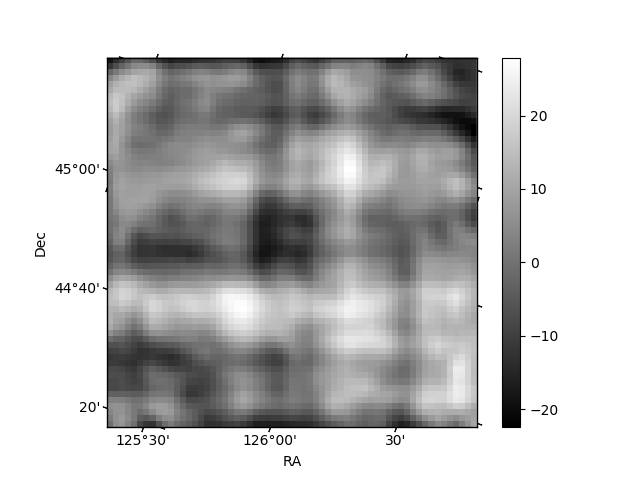
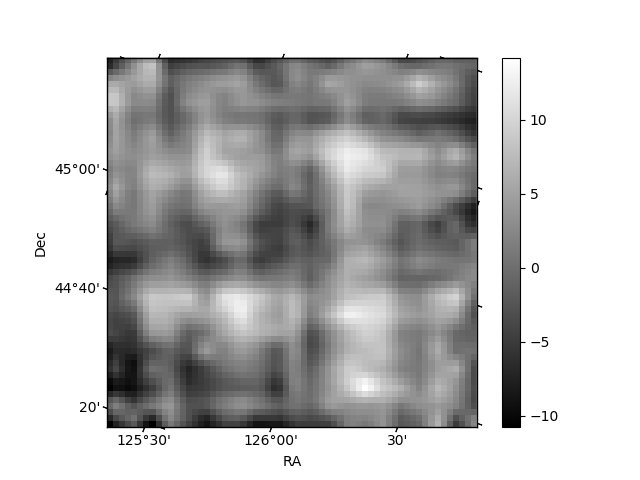
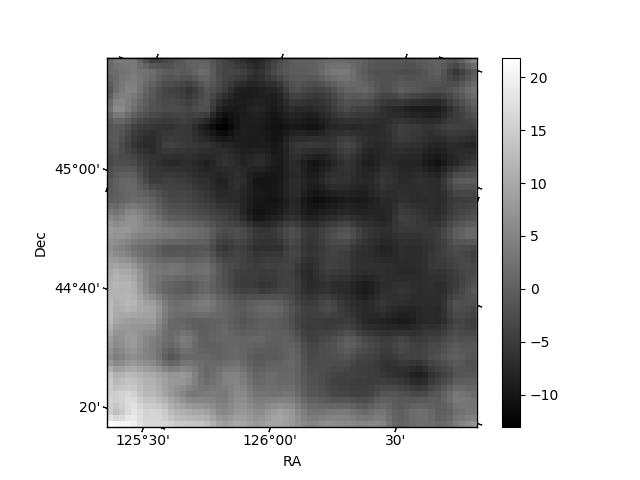
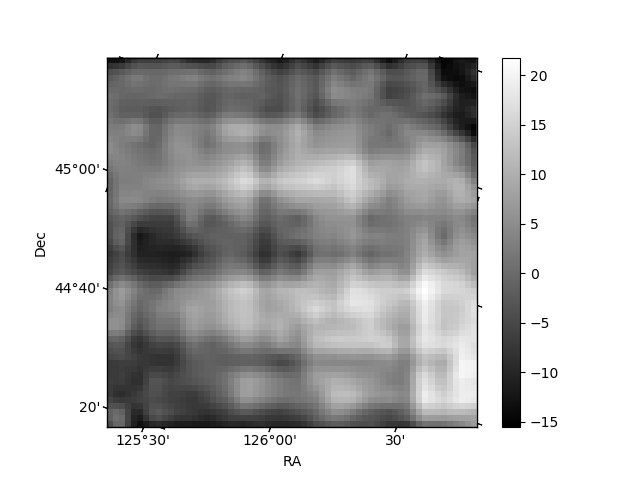
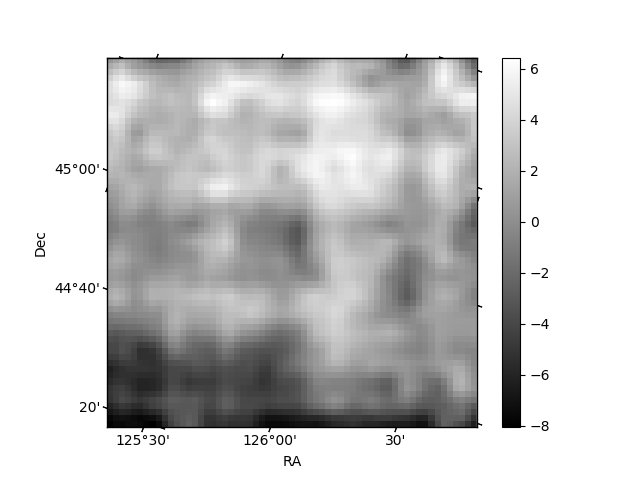
Histogram calculated using DETX and DETY for each event in the final _common_clean file
| Quadrant A | 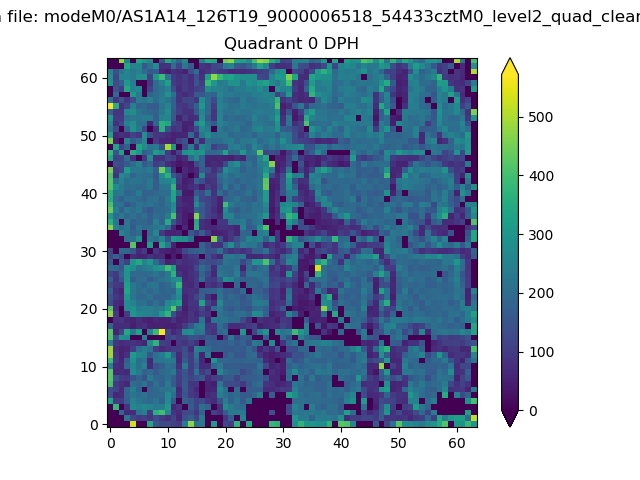 |
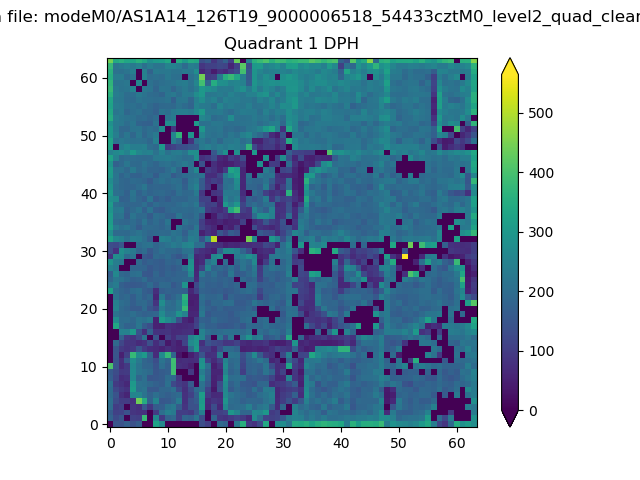 |
Quadrant B |
|---|---|---|---|
| Quadrant D | 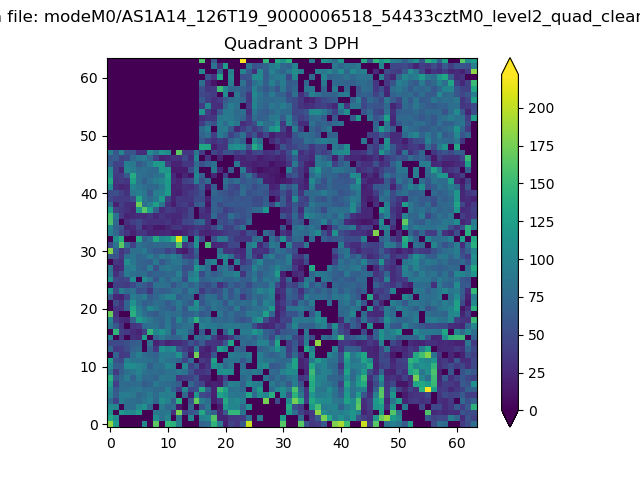 |
 |
Quadrant C |
| Plot type | Count rate plots | Images |
|---|---|---|
| Comparison with Poisson distribution Blue bars denote a histogram of data divided into 1 sec bins. Red curve is a Poisson curve with rate = median count rate of data. |
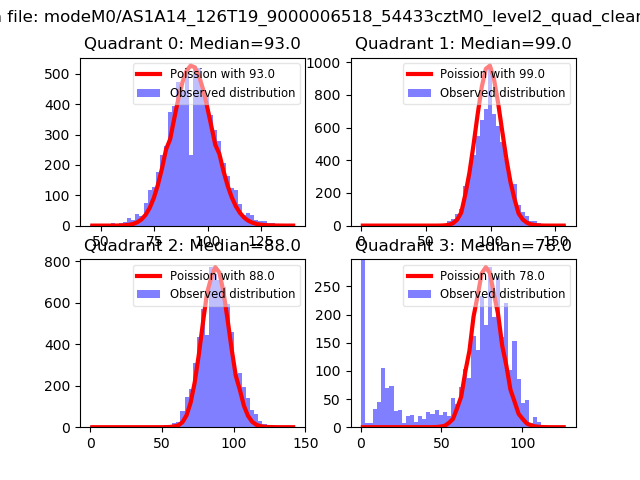 |
 |
| Quadrant-wise count rates Data is divided into 100 sec bins |
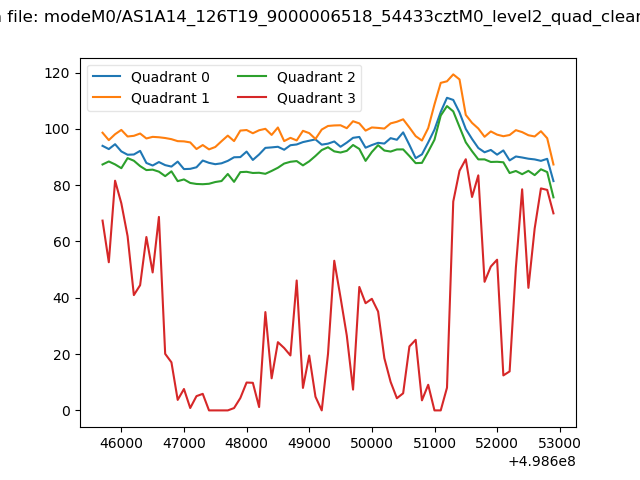 |
|
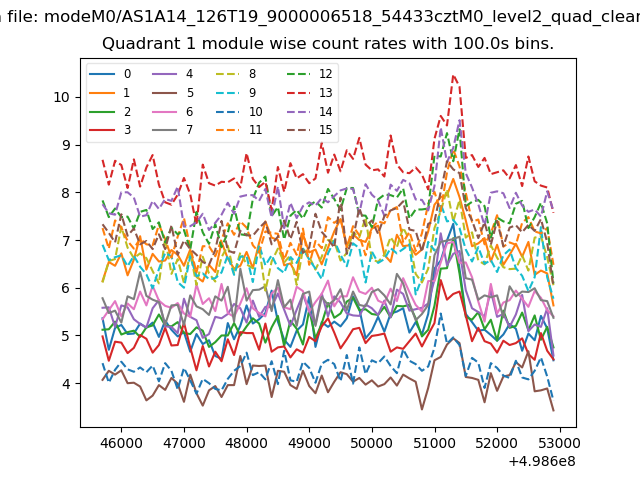
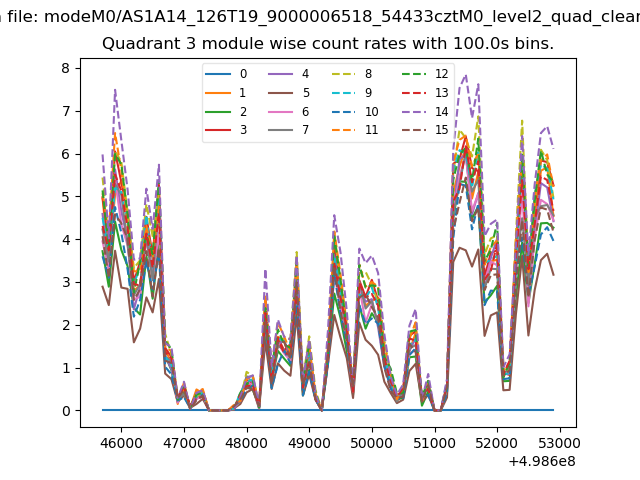
| Module-wise count rates for Quadrant A Data is divided into 100 sec bins |
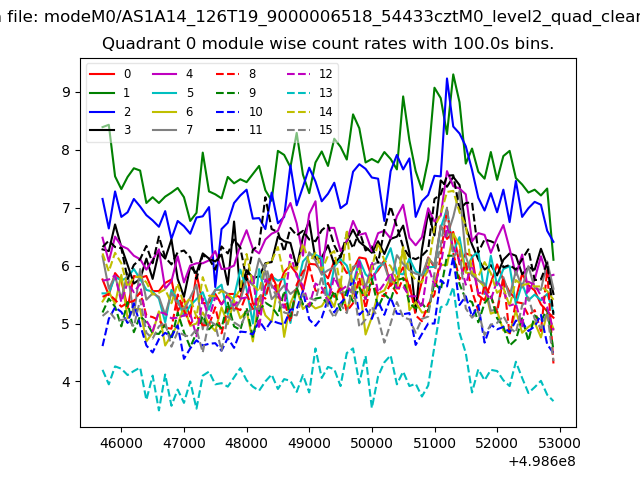 |
 |
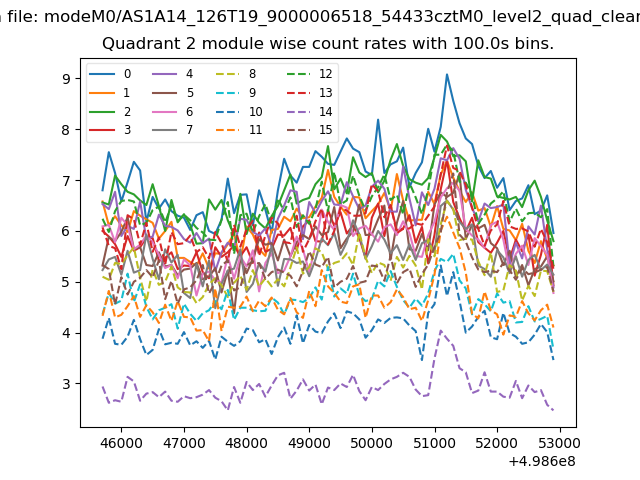
| Module-wise count rates for Quadrant B Data is divided into 100 sec bins |
 |
 |
| Module-wise count rates for Quadrant C Data is divided into 100 sec bins |
 |
 |
| Module-wise count rates for Quadrant D Data is divided into 100 sec bins |
 |
 |
| Parameter | Plot |
|---|---|
| CZT HV Monitor |  |
| D_VDD | 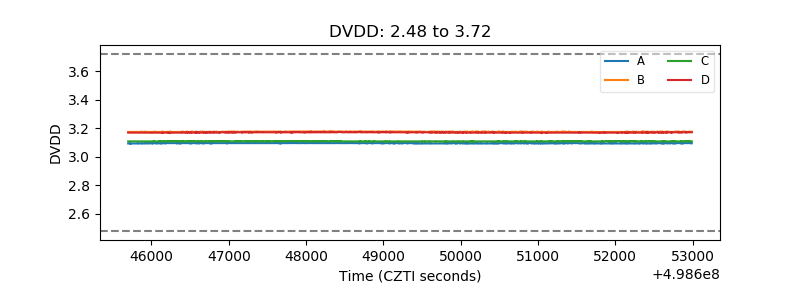 |
| Temperature 1 | 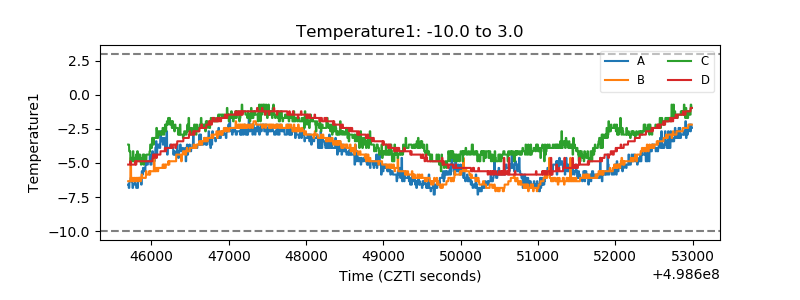 |
| Veto HV Monitor | 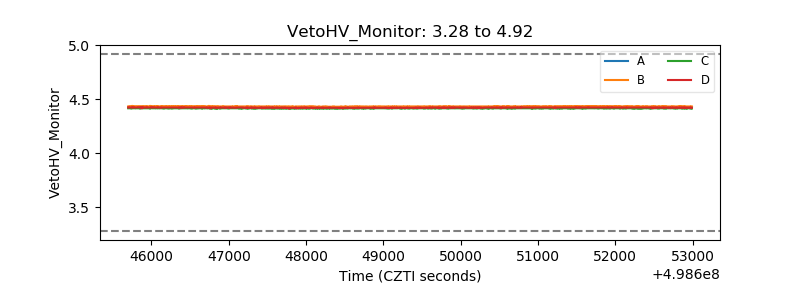 |
| Veto LLD | 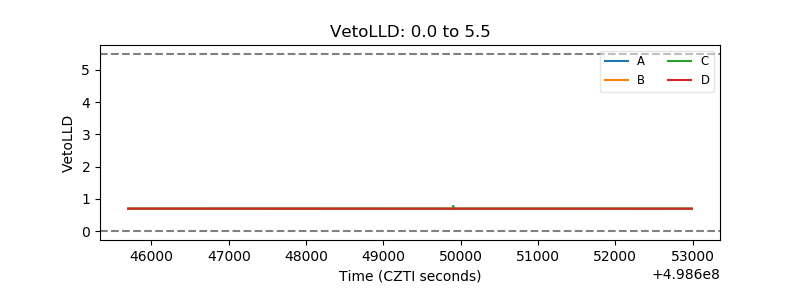 |
| Alpha Counter | 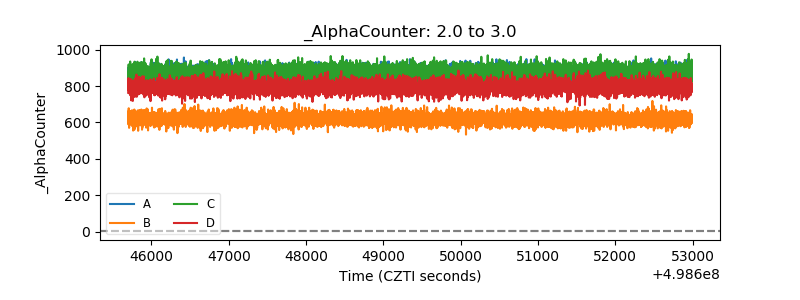 |
| _CPM_Rate | 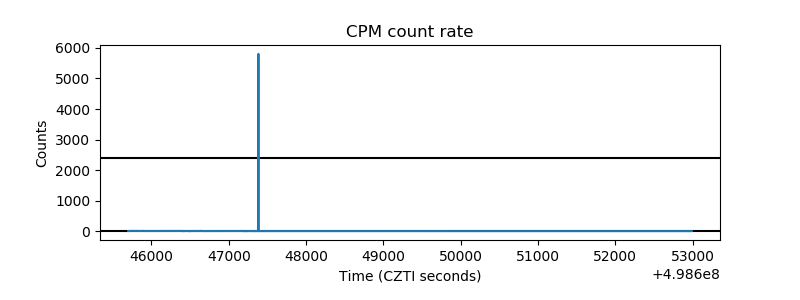 |
| CZT Counter | 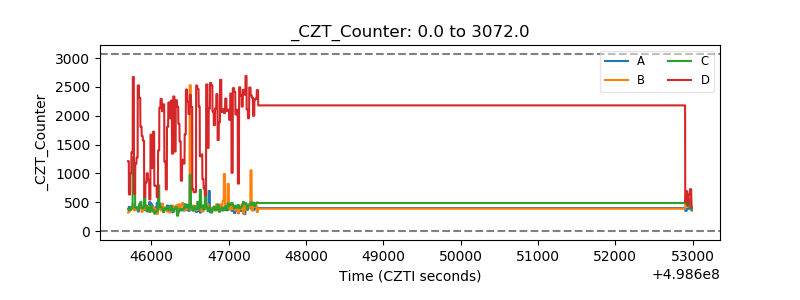 |
| +2.5 Volts monitor |  |
| +5 Volts monitor |  |
| _ROLL_ROT | 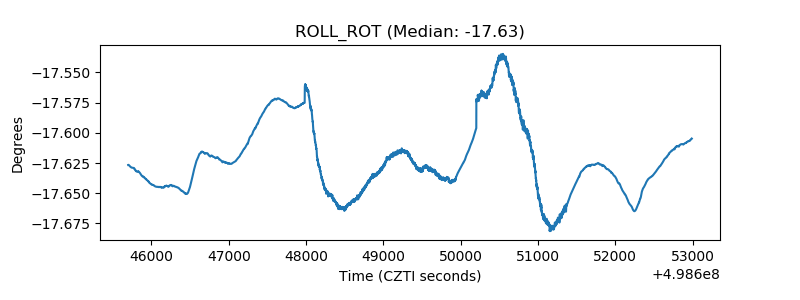 |
| _Roll_DEC | 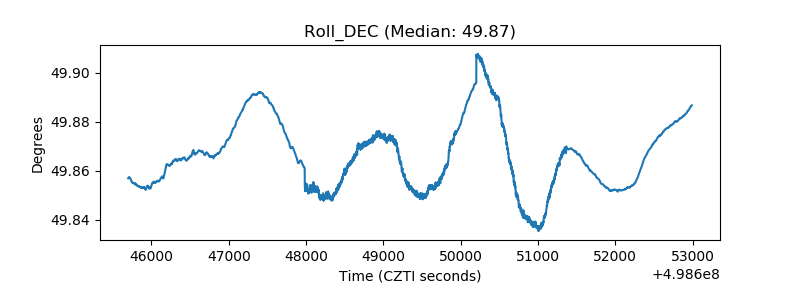 |
| _Roll_RA | 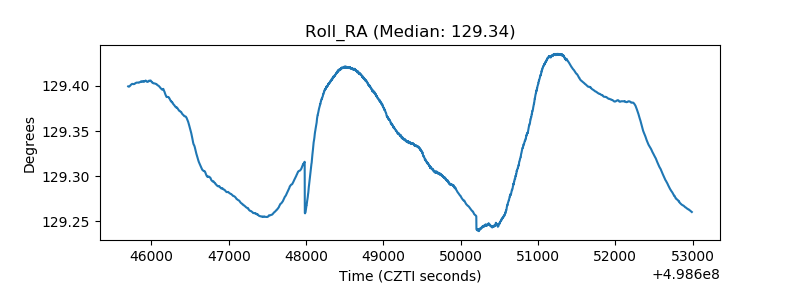 |
| Veto Counter | 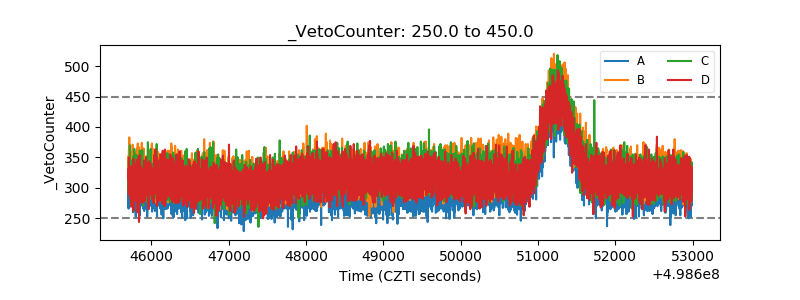 |