| Param | Original file | Final file |
|---|---|---|
| Filename | modeM0/AS1A14_126T19_9000006518_54434cztM0_level2.fits | modeM0/AS1A14_126T19_9000006518_54434cztM0_level2_quad_clean.evt |
| Size (bytes) | 663,402,240 | 100,774,080 |
| Size | 632.7 MB | 96.1 MB |
| Events in quadrant A | 3,314,227 | 719,009 |
| Events in quadrant B | 3,574,417 | 768,681 |
| Events in quadrant C | 4,464,133 | 671,324 |
| Events in quadrant D | 12,599,812 | 351,434 |
| Mode SS | |||
|---|---|---|---|
| Quadrant | BADHDUFLAG | Total packets | Discarded packets |
| A | 0 | 156 | 0 |
| B | 0 | 156 | 0 |
| C | 0 | 156 | 0 |
| D | 0 | 156 | 0 |
| Mode M0 | |||
|---|---|---|---|
| Quadrant | BADHDUFLAG | Total packets | Discarded packets |
| A | 0 | 15686 | 0 |
| B | 0 | 16303 | 0 |
| C | 0 | 18326 | 0 |
| D | 0 | 42811 | 0 |
| Quadrant | Total seconds | Saturated seconds | Saturation percentage |
|---|---|---|---|
| A | 7774 | 6 | 0.077180% |
| B | 7775 | 23 | 0.295820% |
| C | 7775 | 123 | 1.581994% |
| D | 7775 | 3747 | 48.192926% |
Noise dominated data is calculated using 1-second bins in cleaned event files. If a bin has >2000 counts, and if more than 50% of those come from <1% of pixels, then it is considered to be noise-dominated and hence unusable.
| Quadrant | # 1 sec bins | Bins with >0 counts | Bins with >2000 counts | High rate bins dominated by noise | Noise dominated (total time) | Noise dominated (detector-on time) | Marked lightcurve |
|---|---|---|---|---|---|---|---|
| A | 7774 | 7774 | 0 | 0 | 0.00% | 0.00% | 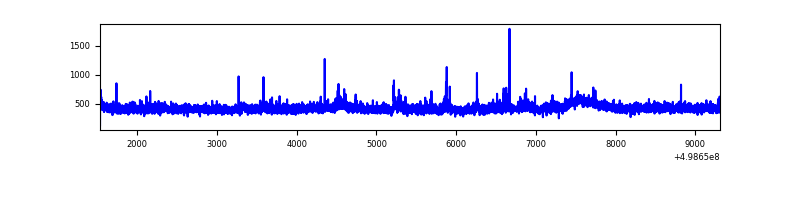 |
| B | 7775 | 7775 | 18 | 18 | 0.23% | 0.23% | 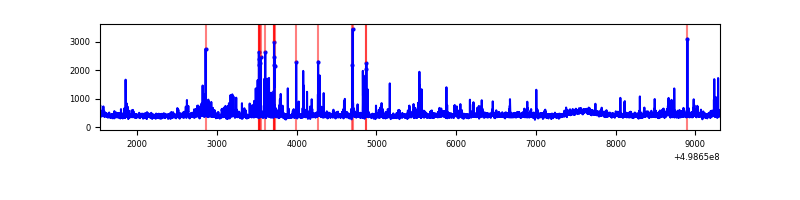 |
| C | 7775 | 7775 | 94 | 94 | 1.21% | 1.21% | 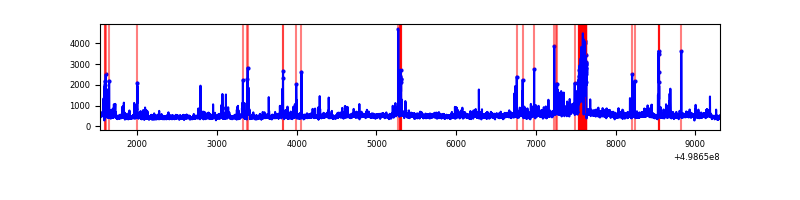 |
| D | 7774 | 7772 | 2884 | 2884 | 37.10% | 37.11% | 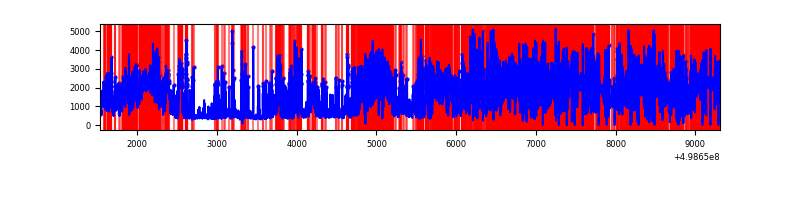 |
Top three noisy pixels from each quadrant. If the there are fewer than three noisy pixels in the level2.evt file, extra rows are filled as -1
| Pixel properties | Quadrant properties | ||||||
|---|---|---|---|---|---|---|---|
| Quadrant | DetID | PixID | Counts | Sigma | Mean | Median | Sigma |
| A | 11 | 3 | 45232 | 221.05 | 811 | 791 | 201.0 |
| A | 8 | 246 | 41768 | 203.82 | 811 | 791 | 201.0 |
| A | 7 | 206 | 34352 | 166.93 | 811 | 791 | 201.0 |
| B | 0 | 213 | 103618 | 608.27 | 797 | 771 | 169.1 |
| B | 10 | 247 | 88259 | 517.44 | 797 | 771 | 169.1 |
| B | 5 | 185 | 72891 | 426.54 | 797 | 771 | 169.1 |
| C | 11 | 244 | 537792 | 2556.44 | 769 | 759 | 210.1 |
| C | 4 | 5 | 377331 | 1792.59 | 769 | 759 | 210.1 |
| C | 1 | 16 | 223005 | 1057.96 | 769 | 759 | 210.1 |
| D | 8 | 176 | 7076782 | 46219.81 | 537 | 513 | 153.1 |
| D | 7 | 70 | 2627443 | 17158.22 | 537 | 513 | 153.1 |
| D | 3 | 12 | 475830 | 3104.61 | 537 | 513 | 153.1 |
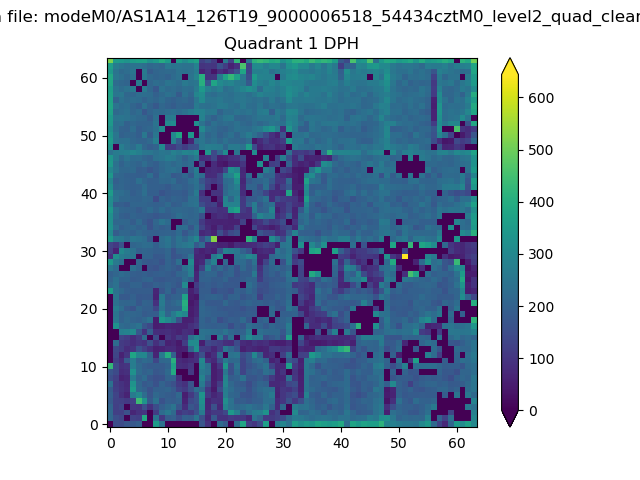
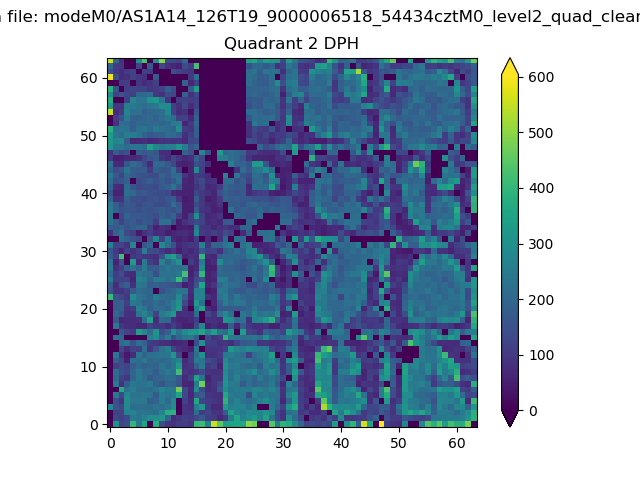
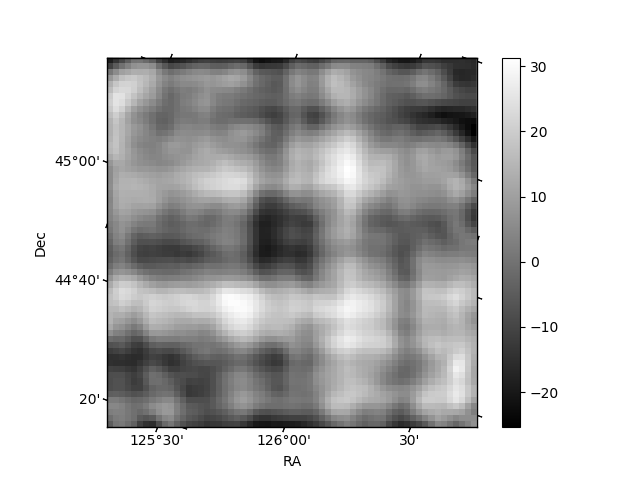
Histogram calculated using DETX and DETY for each event in the final _common_clean file
| Quadrant A |  |
 |
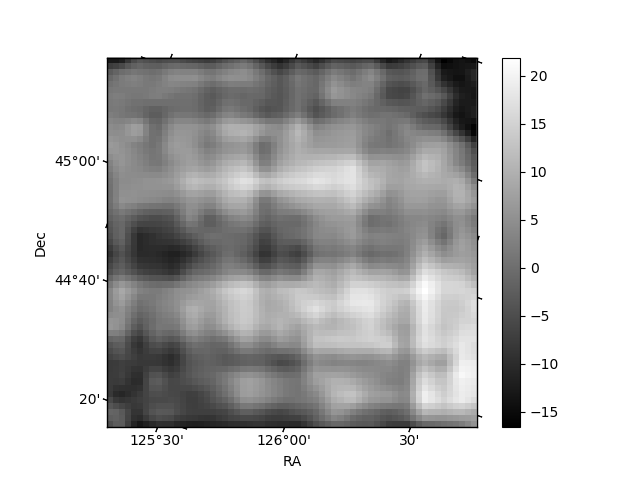
Quadrant B |
|---|---|---|---|
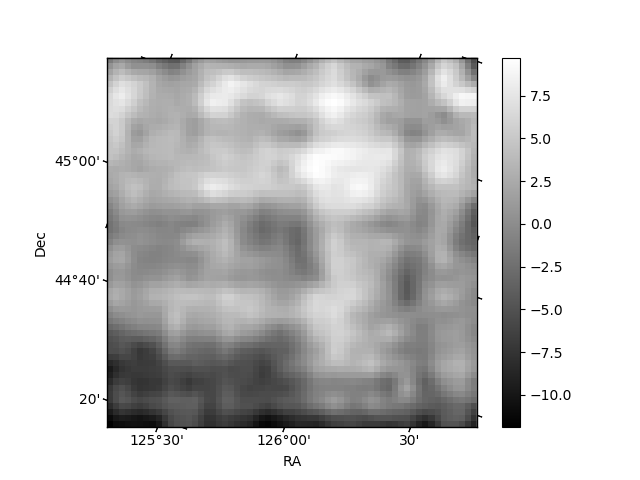
| Quadrant D | 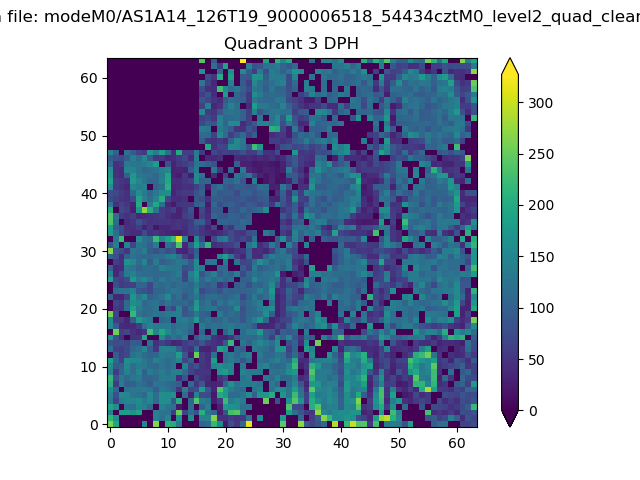 |
 |
Quadrant C |
| Plot type | Count rate plots | Images |
|---|---|---|
| Comparison with Poisson distribution Blue bars denote a histogram of data divided into 1 sec bins. Red curve is a Poisson curve with rate = median count rate of data. |
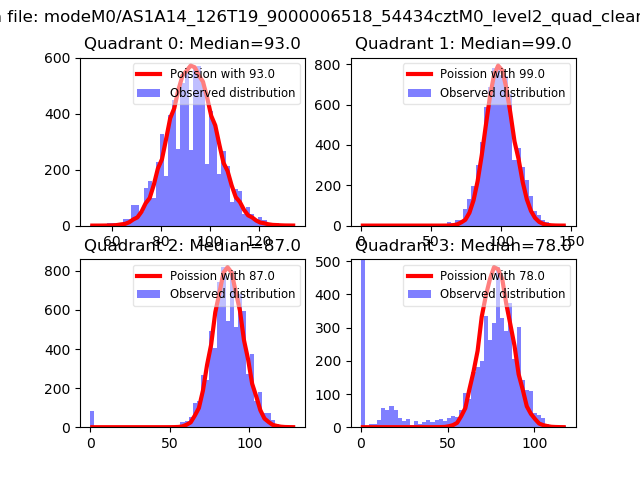 |
 |
| Quadrant-wise count rates Data is divided into 100 sec bins |
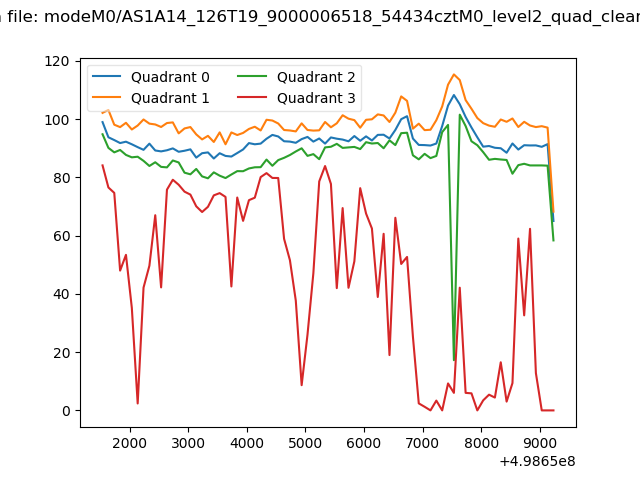 |
|
| Module-wise count rates for Quadrant A Data is divided into 100 sec bins |
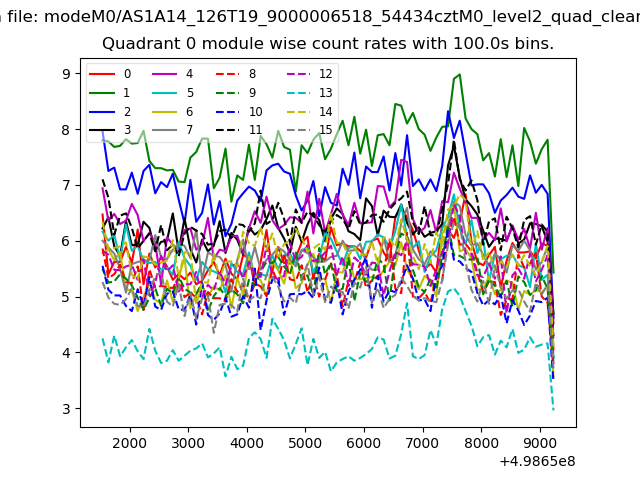 |
 |
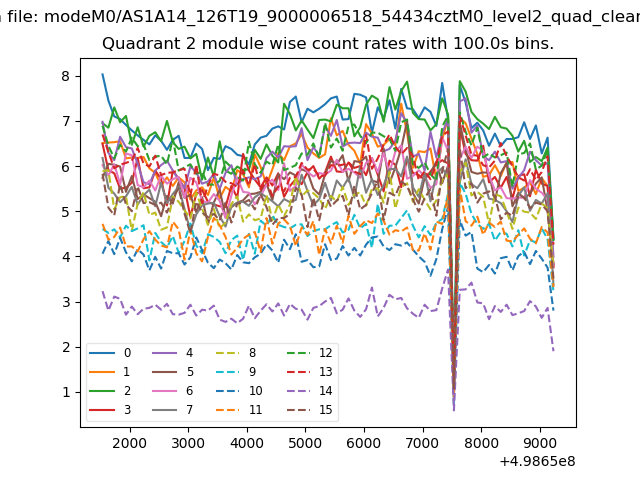
| Module-wise count rates for Quadrant B Data is divided into 100 sec bins |
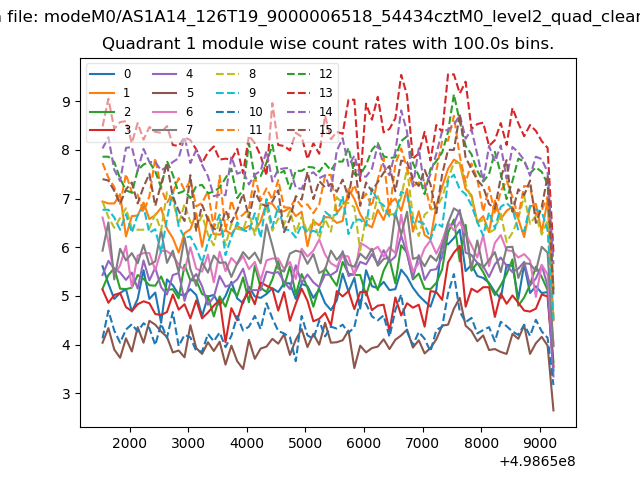 |
 |
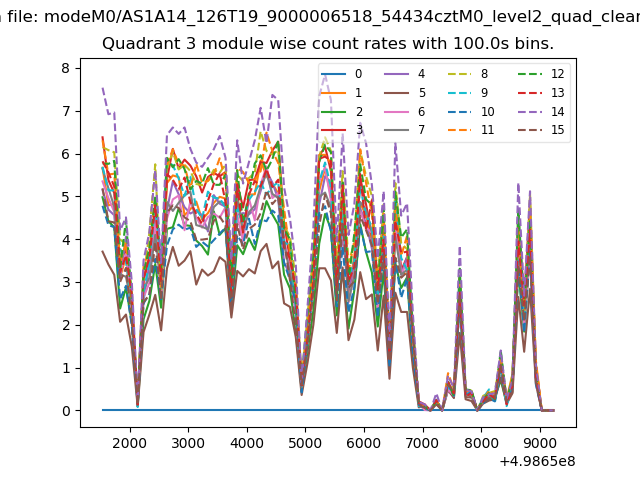
| Module-wise count rates for Quadrant C Data is divided into 100 sec bins |
 |
 |
| Module-wise count rates for Quadrant D Data is divided into 100 sec bins |
 |
 |
| Parameter | Plot |
|---|---|
| CZT HV Monitor | 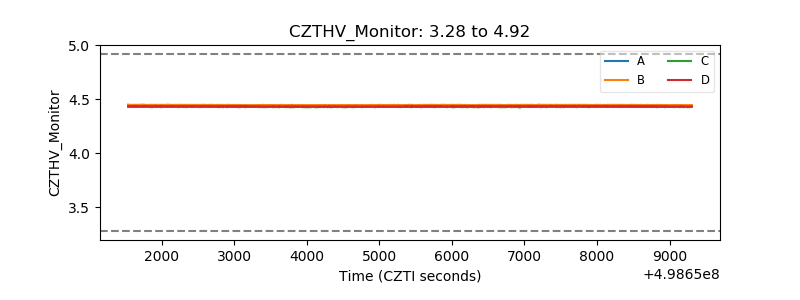 |
| D_VDD | 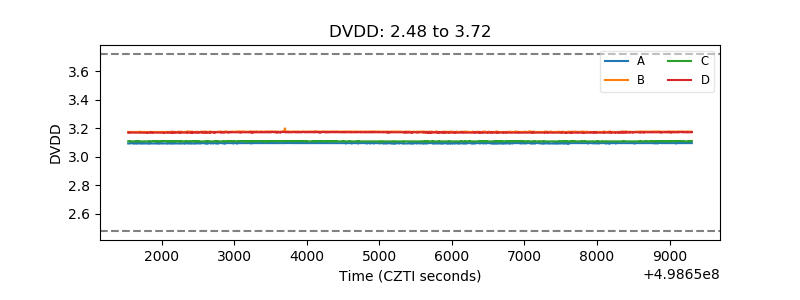 |
| Temperature 1 | 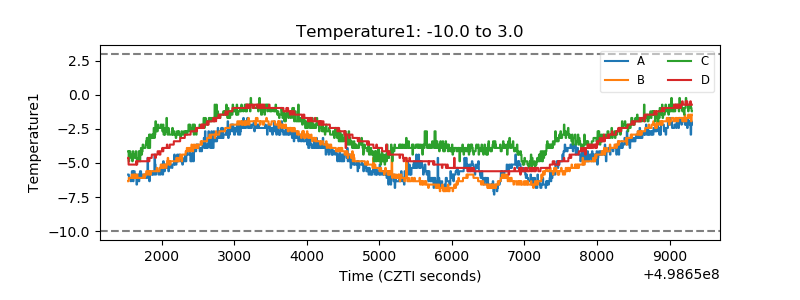 |
| Veto HV Monitor | 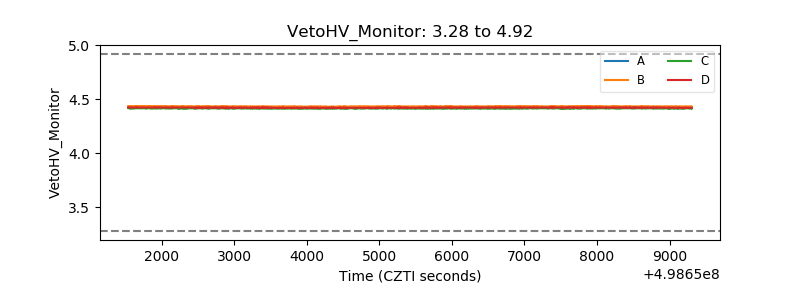 |
| Veto LLD | 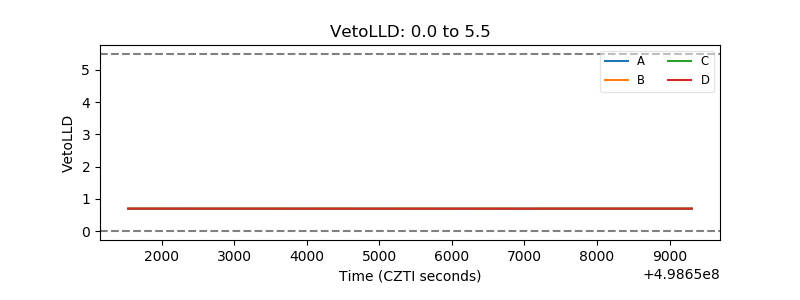 |
| Alpha Counter | 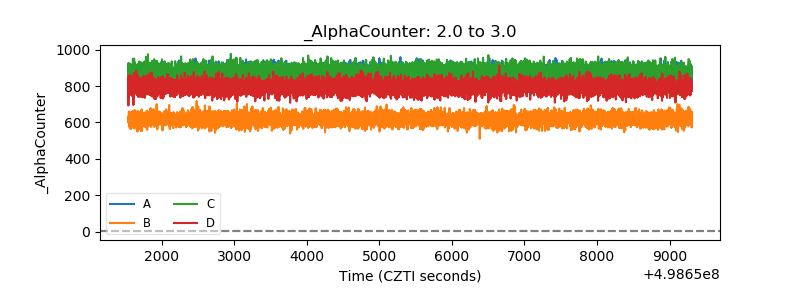 |
| _CPM_Rate | 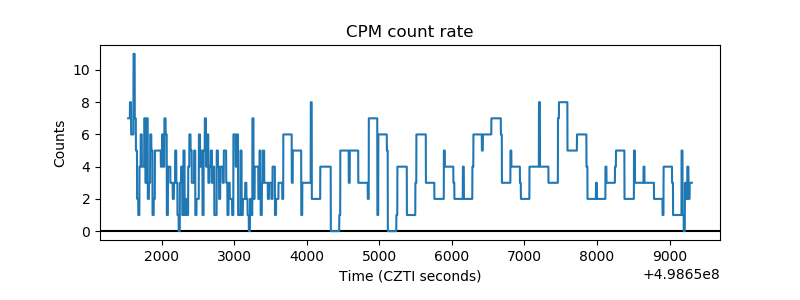 |
| CZT Counter | 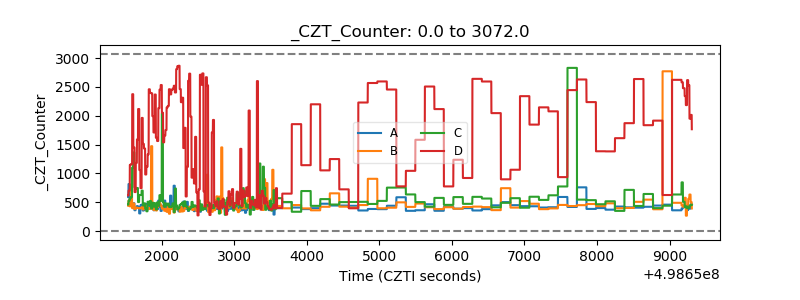 |
| +2.5 Volts monitor | 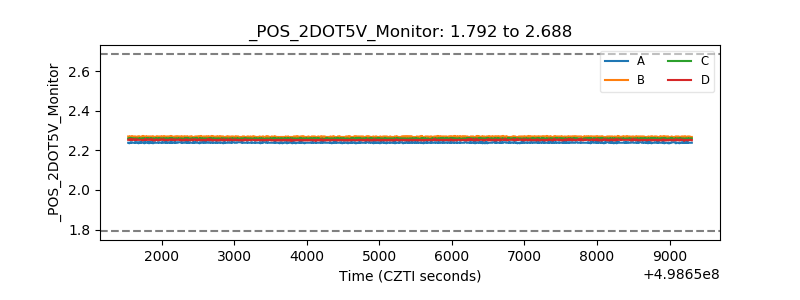 |
| +5 Volts monitor | 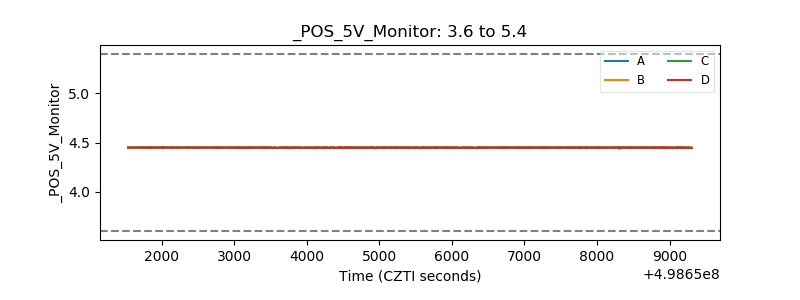 |
| _ROLL_ROT | 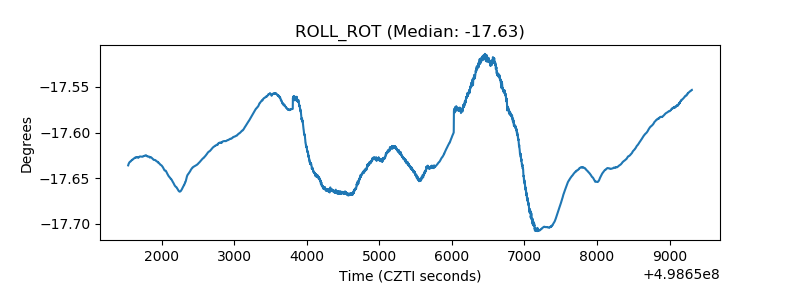 |
| _Roll_DEC | 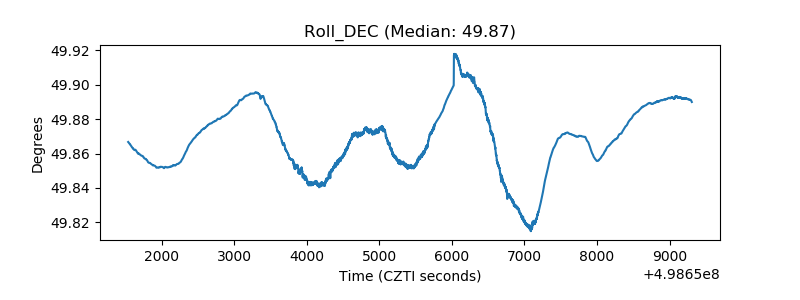 |
| _Roll_RA | 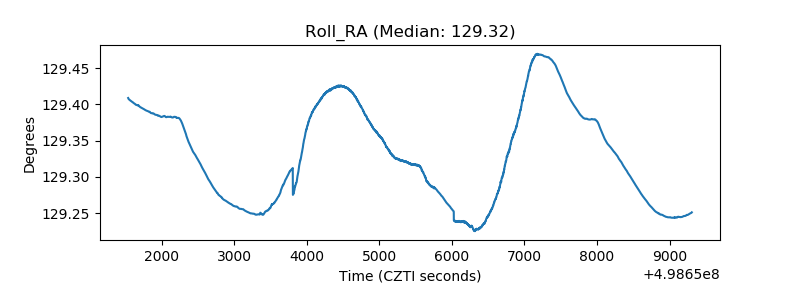 |
| Veto Counter | 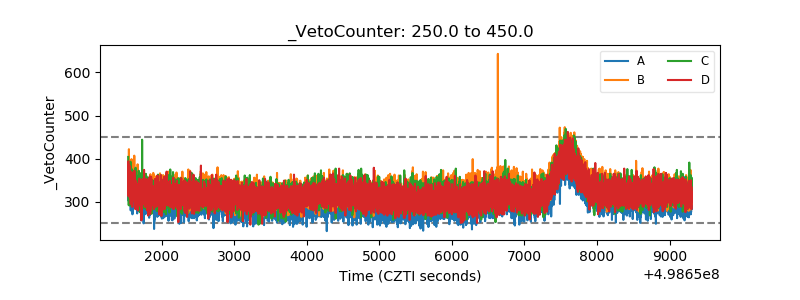 |