| Param | Original file | Final file |
|---|---|---|
| Filename | modeM0/AS1A14_126T19_9000006518_54438cztM0_level2.fits | modeM0/AS1A14_126T19_9000006518_54438cztM0_level2_quad_clean.evt |
| Size (bytes) | 2,239,750,080 | 306,846,720 |
| Size | 2.1 GB | 292.6 MB |
| Events in quadrant A | 10,929,105 | 2,255,834 |
| Events in quadrant B | 11,620,960 | 2,386,830 |
| Events in quadrant C | 12,779,720 | 2,134,083 |
| Events in quadrant D | 45,687,470 | 832,729 |
| Mode SS | |||
|---|---|---|---|
| Quadrant | BADHDUFLAG | Total packets | Discarded packets |
| A | 0 | 494 | 0 |
| B | 0 | 494 | 0 |
| C | 0 | 494 | 0 |
| D | 0 | 494 | 0 |
| Mode M0 | |||
|---|---|---|---|
| Quadrant | BADHDUFLAG | Total packets | Discarded packets |
| A | 0 | 50801 | 4 |
| B | 0 | 52836 | 4 |
| C | 0 | 55623 | 4 |
| D | 0 | 152573 | 7 |
| Mode M9 | |||
|---|---|---|---|
| Quadrant | BADHDUFLAG | Total packets | Discarded packets |
| A | 0 | 16 | 0 |
| B | 0 | 16 | 0 |
| C | 0 | 16 | 0 |
| D | 0 | 16 | 0 |
| Quadrant | Total seconds | Saturated seconds | Saturation percentage |
|---|---|---|---|
| A | 24420 | 246 | 1.007371% |
| B | 24421 | 475 | 1.945047% |
| C | 24421 | 507 | 2.076082% |
| D | 24420 | 14802 | 60.614251% |
Noise dominated data is calculated using 1-second bins in cleaned event files. If a bin has >2000 counts, and if more than 50% of those come from <1% of pixels, then it is considered to be noise-dominated and hence unusable.
| Quadrant | # 1 sec bins | Bins with >0 counts | Bins with >2000 counts | High rate bins dominated by noise | Noise dominated (total time) | Noise dominated (detector-on time) | Marked lightcurve |
|---|---|---|---|---|---|---|---|
| A | 25955 | 24424 | 49 | 49 | 0.19% | 0.20% | 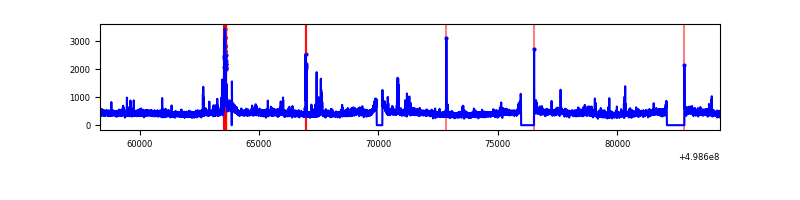 |
| B | 25956 | 24425 | 149 | 149 | 0.57% | 0.61% | 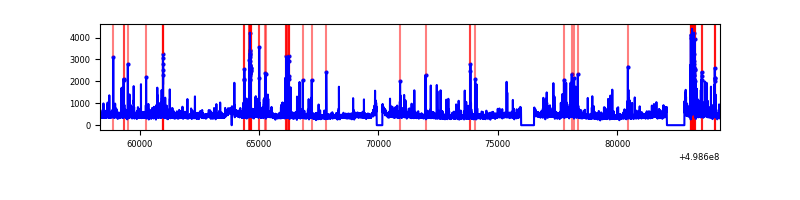 |
| C | 25956 | 24425 | 290 | 290 | 1.12% | 1.19% | 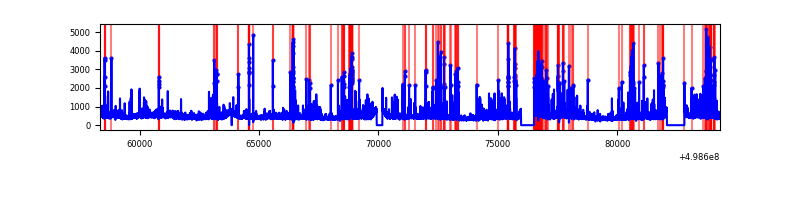 |
| D | 25955 | 24422 | 12328 | 12328 | 47.50% | 50.48% | 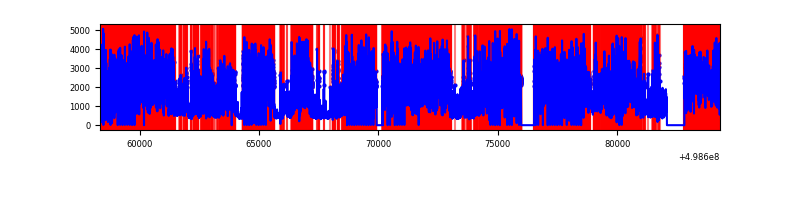 |
Top three noisy pixels from each quadrant. If the there are fewer than three noisy pixels in the level2.evt file, extra rows are filled as -1
| Pixel properties | Quadrant properties | ||||||
|---|---|---|---|---|---|---|---|
| Quadrant | DetID | PixID | Counts | Sigma | Mean | Median | Sigma |
| A | 11 | 3 | 272396 | 426.09 | 2583 | 2526 | 633.4 |
| A | 8 | 249 | 211178 | 329.43 | 2583 | 2526 | 633.4 |
| A | 5 | 243 | 128653 | 199.14 | 2583 | 2526 | 633.4 |
| B | 10 | 247 | 461001 | 852.58 | 2541 | 2448 | 537.8 |
| B | 0 | 213 | 216814 | 398.56 | 2541 | 2448 | 537.8 |
| B | 2 | 249 | 193533 | 355.28 | 2541 | 2448 | 537.8 |
| C | 13 | 3 | 646209 | 949.47 | 2497 | 2475 | 678.0 |
| C | 4 | 5 | 547291 | 803.57 | 2497 | 2475 | 678.0 |
| C | 11 | 244 | 379521 | 556.12 | 2497 | 2475 | 678.0 |
| D | 8 | 176 | 23584562 | 56865.05 | 1457 | 1388 | 414.7 |
| D | 7 | 70 | 12876314 | 31044.73 | 1457 | 1388 | 414.7 |
| D | 2 | 172 | 1311436 | 3158.86 | 1457 | 1388 | 414.7 |
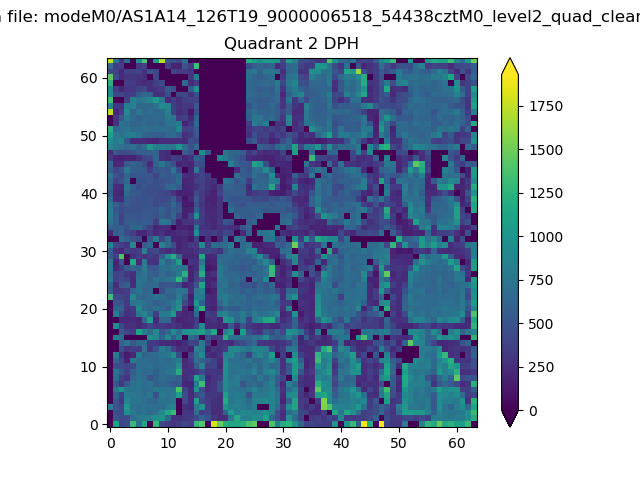
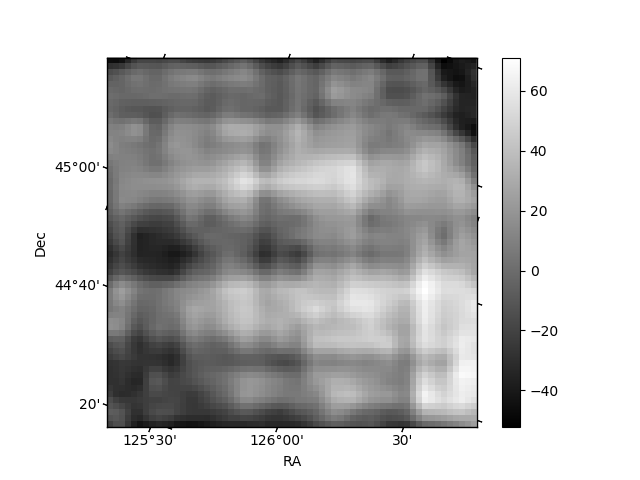
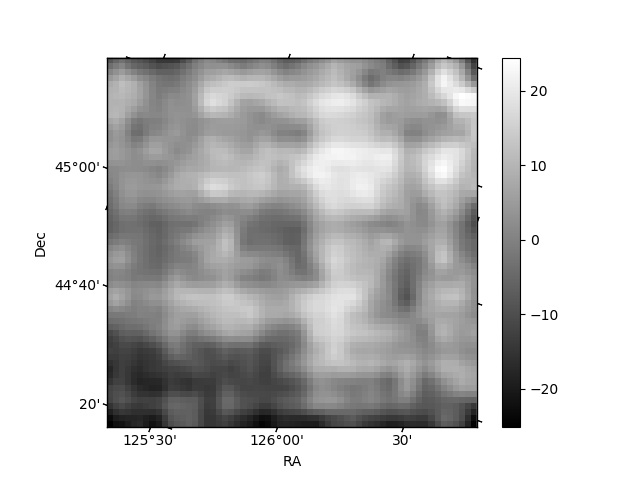
Histogram calculated using DETX and DETY for each event in the final _common_clean file
| Quadrant A |  |
 |
Quadrant B |
|---|---|---|---|
| Quadrant D | 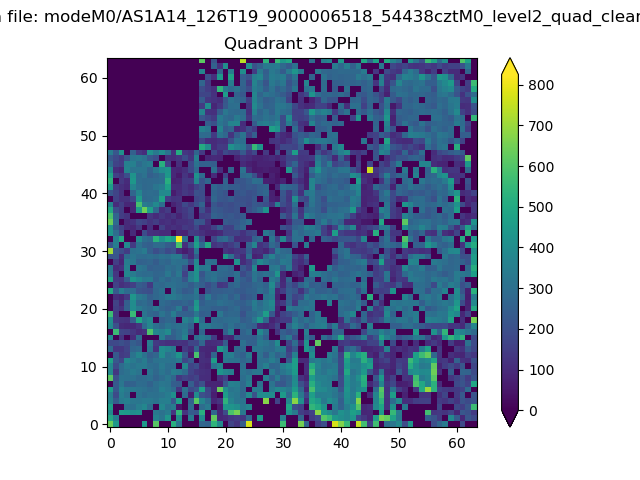 |
 |
Quadrant C |
| Plot type | Count rate plots | Images |
|---|---|---|
| Comparison with Poisson distribution Blue bars denote a histogram of data divided into 1 sec bins. Red curve is a Poisson curve with rate = median count rate of data. |
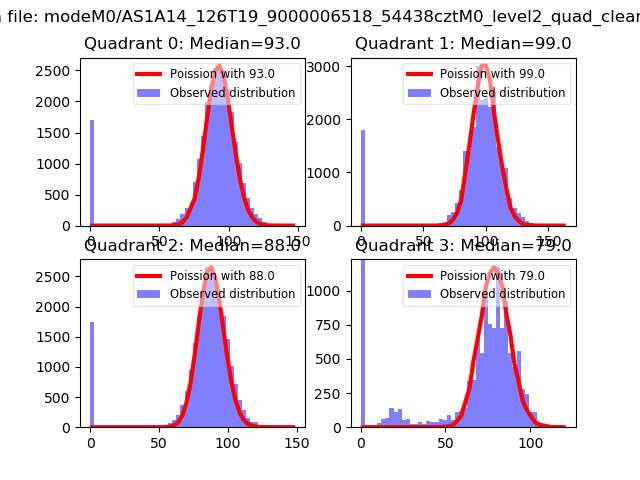 |
 |
| Quadrant-wise count rates Data is divided into 100 sec bins |
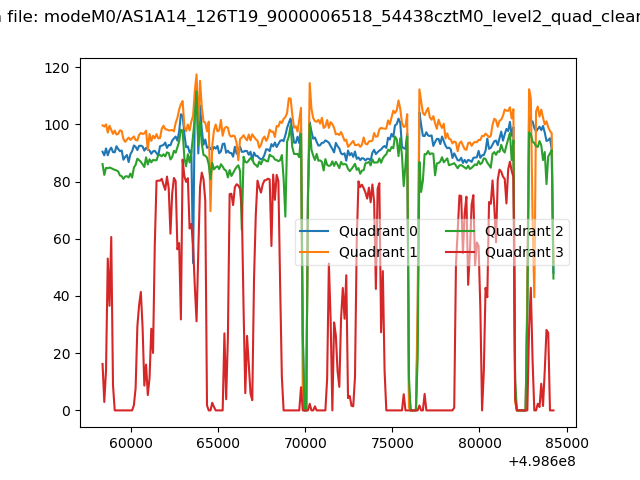 |
|
| Module-wise count rates for Quadrant A Data is divided into 100 sec bins |
 |
 |
| Module-wise count rates for Quadrant B Data is divided into 100 sec bins |
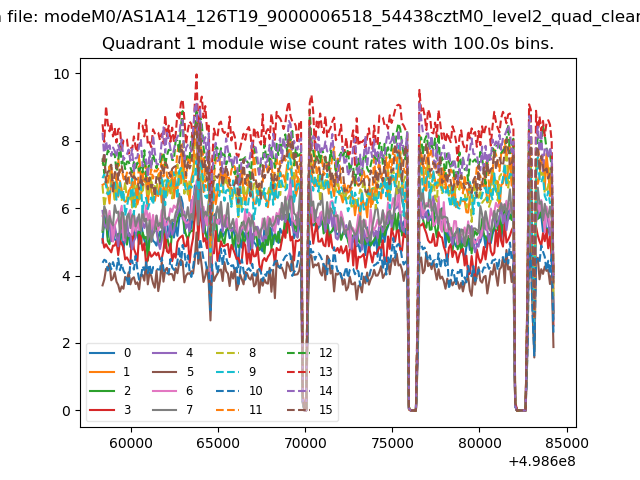 |
 |
| Module-wise count rates for Quadrant C Data is divided into 100 sec bins |
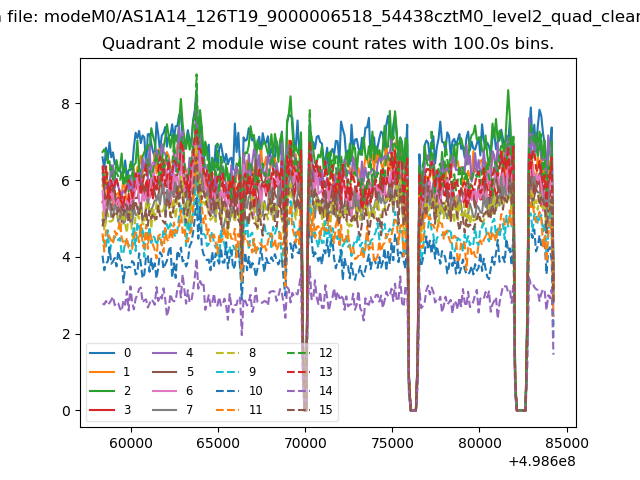 |
 |
| Module-wise count rates for Quadrant D Data is divided into 100 sec bins |
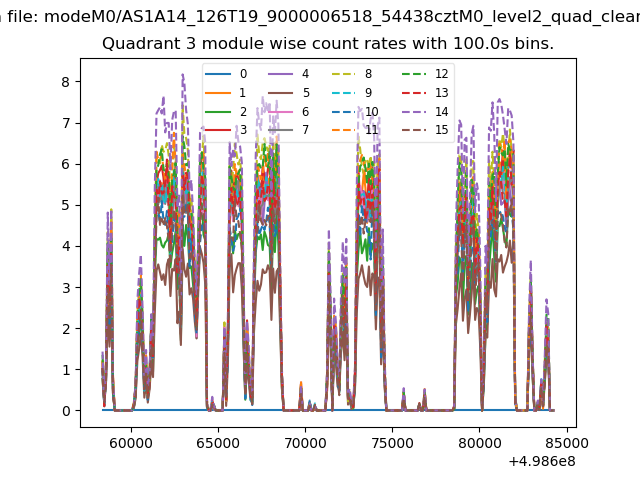 |
 |
| Parameter | Plot |
|---|---|
| CZT HV Monitor | 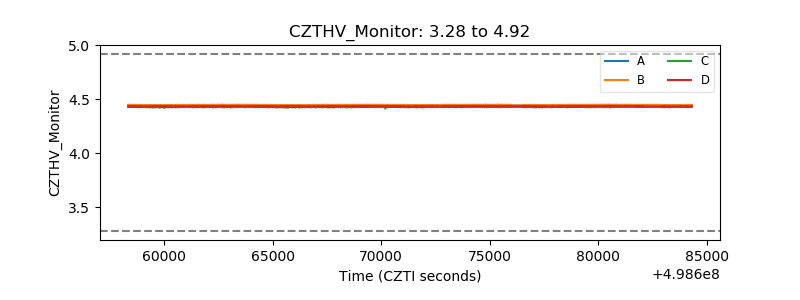 |
| D_VDD | 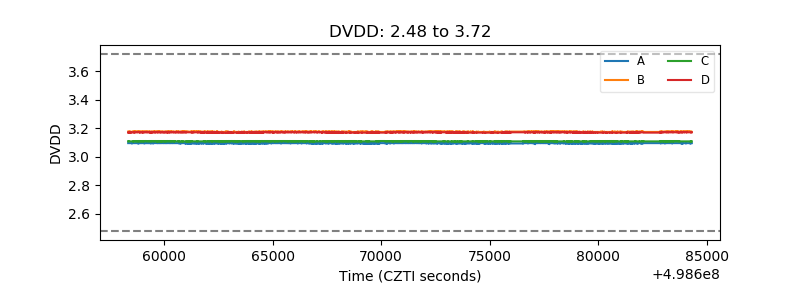 |
| Temperature 1 | 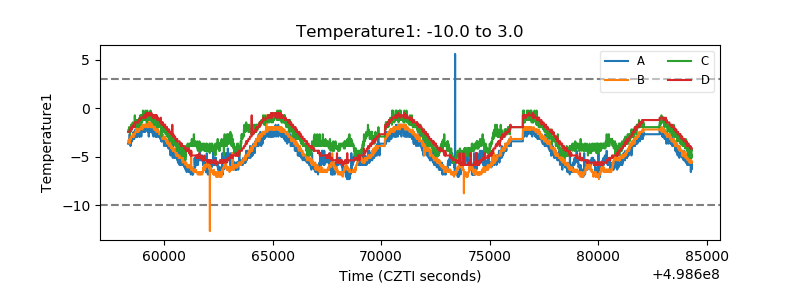 |
| Veto HV Monitor | 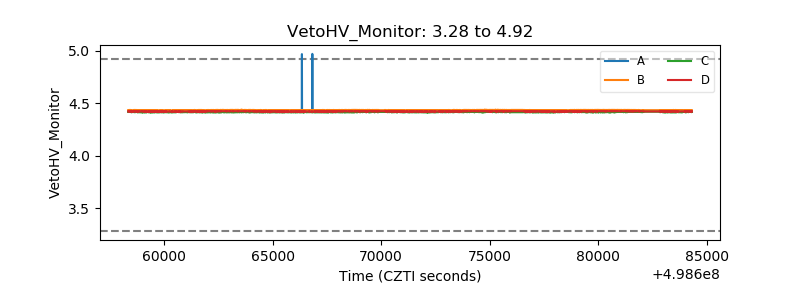 |
| Veto LLD | 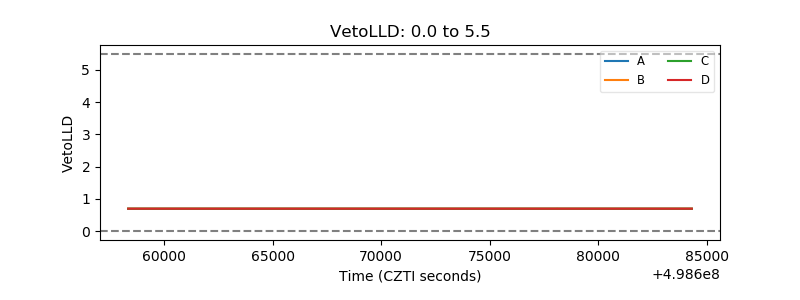 |
| Alpha Counter | 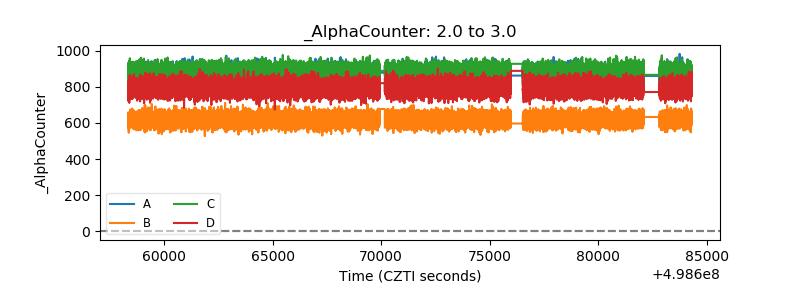 |
| _CPM_Rate | 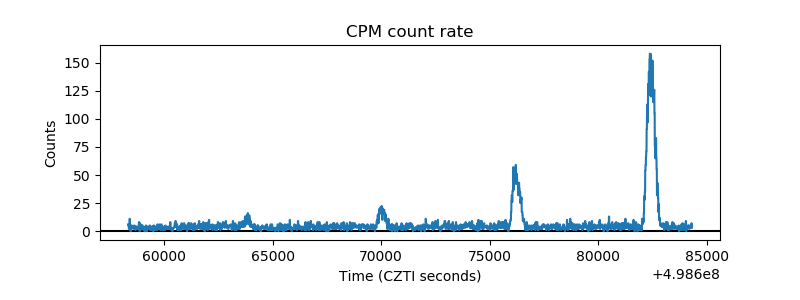 |
| CZT Counter | 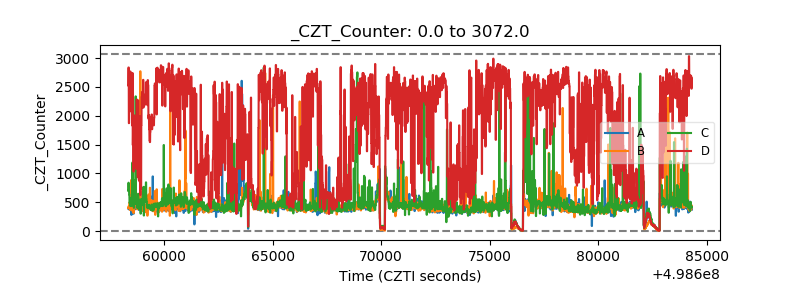 |
| +2.5 Volts monitor | 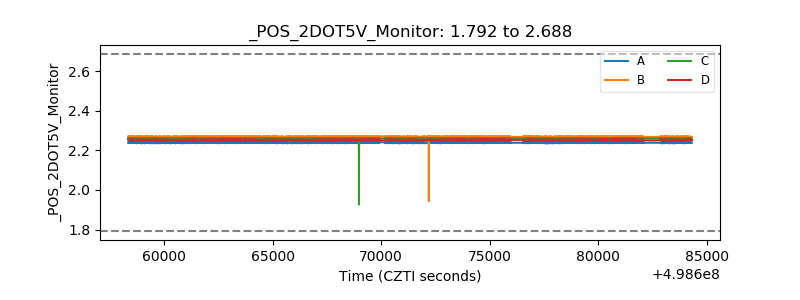 |
| +5 Volts monitor | 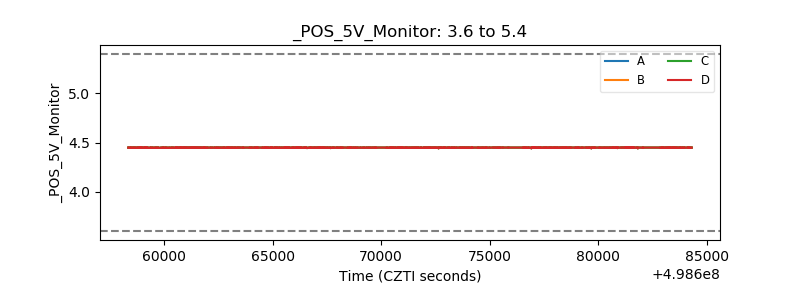 |
| _ROLL_ROT | 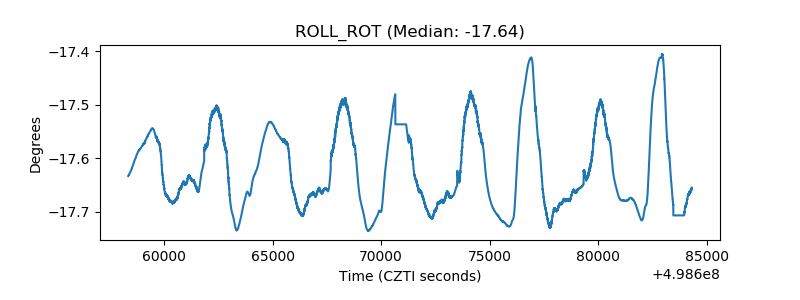 |
| _Roll_DEC | 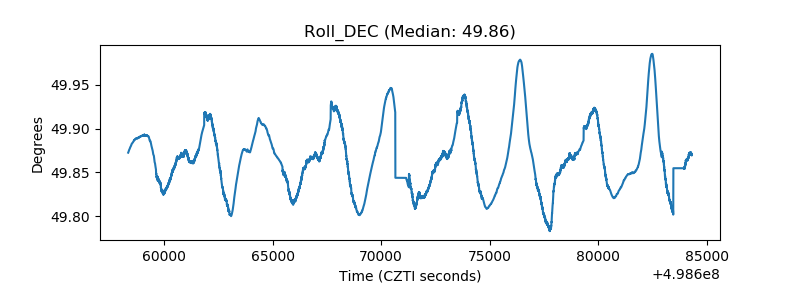 |
| _Roll_RA | 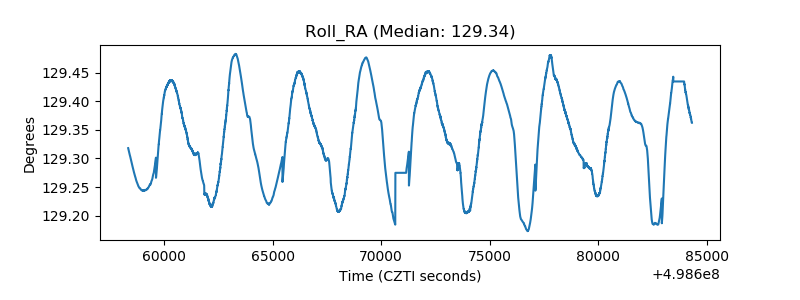 |
| Veto Counter | 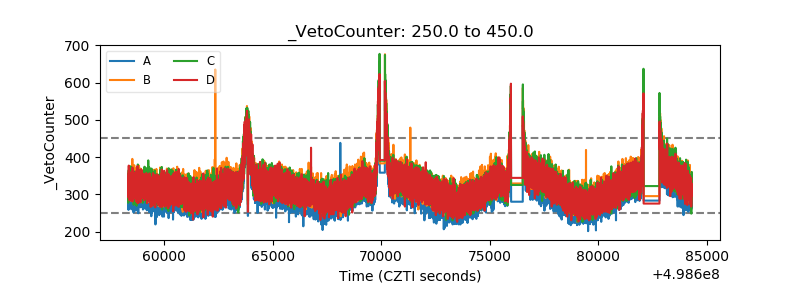 |