| Param | Original file | Final file |
|---|---|---|
| Filename | modeM0/AS1A14_126T19_9000006518_54441cztM0_level2.fits | modeM0/AS1A14_126T19_9000006518_54441cztM0_level2_quad_clean.evt |
| Size (bytes) | 565,323,840 | 96,229,440 |
| Size | 539.1 MB | 91.8 MB |
| Events in quadrant A | 3,087,322 | 668,737 |
| Events in quadrant B | 3,452,168 | 712,394 |
| Events in quadrant C | 3,743,368 | 636,485 |
| Events in quadrant D | 10,096,446 | 405,858 |
| Mode SS | |||
|---|---|---|---|
| Quadrant | BADHDUFLAG | Total packets | Discarded packets |
| A | 0 | 146 | 0 |
| B | 0 | 146 | 0 |
| C | 0 | 146 | 0 |
| D | 0 | 146 | 0 |
| Mode M0 | |||
|---|---|---|---|
| Quadrant | BADHDUFLAG | Total packets | Discarded packets |
| A | 0 | 14428 | 2 |
| B | 0 | 15485 | 2 |
| C | 0 | 16337 | 2 |
| D | 0 | 34863 | 2 |
| Mode M9 | |||
|---|---|---|---|
| Quadrant | BADHDUFLAG | Total packets | Discarded packets |
| A | 0 | 19 | 0 |
| B | 0 | 19 | 0 |
| C | 0 | 19 | 0 |
| D | 0 | 19 | 0 |
| Quadrant | Total seconds | Saturated seconds | Saturation percentage |
|---|---|---|---|
| A | 7035 | 38 | 0.540156% |
| B | 7035 | 123 | 1.748401% |
| C | 7035 | 173 | 2.459133% |
| D | 7035 | 2486 | 35.337598% |
Noise dominated data is calculated using 1-second bins in cleaned event files. If a bin has >2000 counts, and if more than 50% of those come from <1% of pixels, then it is considered to be noise-dominated and hence unusable.
| Quadrant | # 1 sec bins | Bins with >0 counts | Bins with >2000 counts | High rate bins dominated by noise | Noise dominated (total time) | Noise dominated (detector-on time) | Marked lightcurve |
|---|---|---|---|---|---|---|---|
| A | 8989 | 7036 | 4 | 4 | 0.04% | 0.06% | 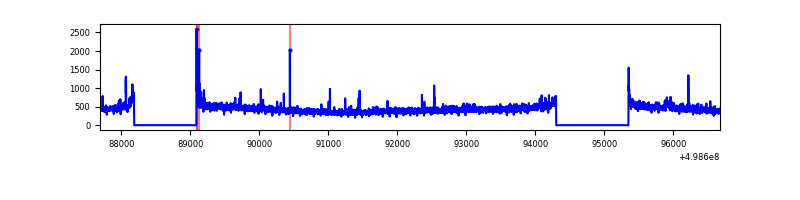 |
| B | 8989 | 7036 | 61 | 61 | 0.68% | 0.87% | 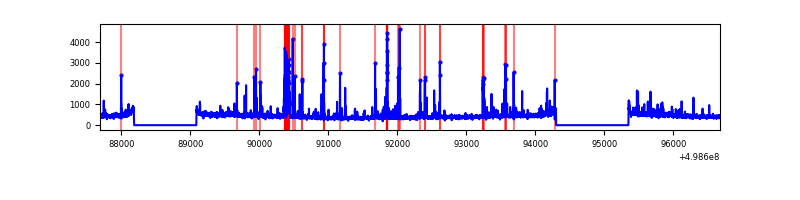 |
| C | 8990 | 7037 | 102 | 102 | 1.13% | 1.45% | 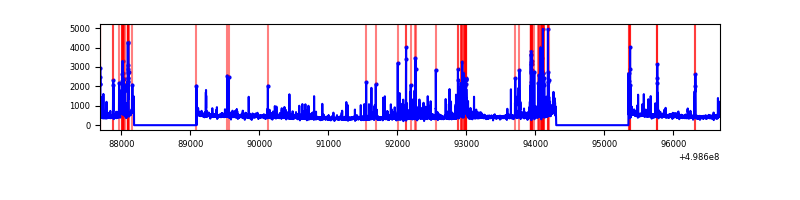 |
| D | 8990 | 7036 | 1971 | 1971 | 21.92% | 28.01% | 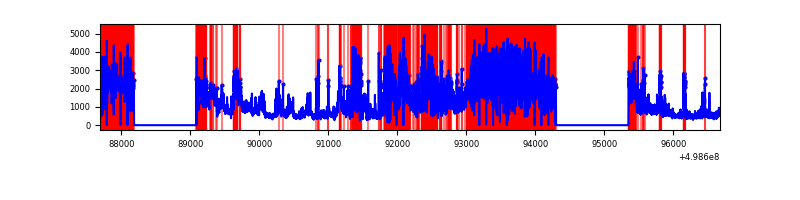 |
Top three noisy pixels from each quadrant. If the there are fewer than three noisy pixels in the level2.evt file, extra rows are filled as -1
| Pixel properties | Quadrant properties | ||||||
|---|---|---|---|---|---|---|---|
| Quadrant | DetID | PixID | Counts | Sigma | Mean | Median | Sigma |
| A | 11 | 3 | 62050 | 330.63 | 750 | 731 | 185.5 |
| A | 4 | 3 | 42484 | 225.13 | 750 | 731 | 185.5 |
| A | 5 | 241 | 20067 | 104.26 | 750 | 731 | 185.5 |
| B | 2 | 249 | 197010 | 1241.28 | 741 | 714 | 158.1 |
| B | 10 | 247 | 162535 | 1023.28 | 741 | 714 | 158.1 |
| B | 0 | 213 | 44539 | 277.13 | 741 | 714 | 158.1 |
| C | 13 | 3 | 345664 | 1694.13 | 731 | 724 | 203.6 |
| C | 4 | 5 | 189646 | 927.86 | 731 | 724 | 203.6 |
| C | 7 | 220 | 75036 | 364.97 | 731 | 724 | 203.6 |
| D | 8 | 176 | 6363311 | 40110.56 | 558 | 534 | 158.6 |
| D | 7 | 70 | 621138 | 3912.25 | 558 | 534 | 158.6 |
| D | 1 | 3 | 245839 | 1546.38 | 558 | 534 | 158.6 |
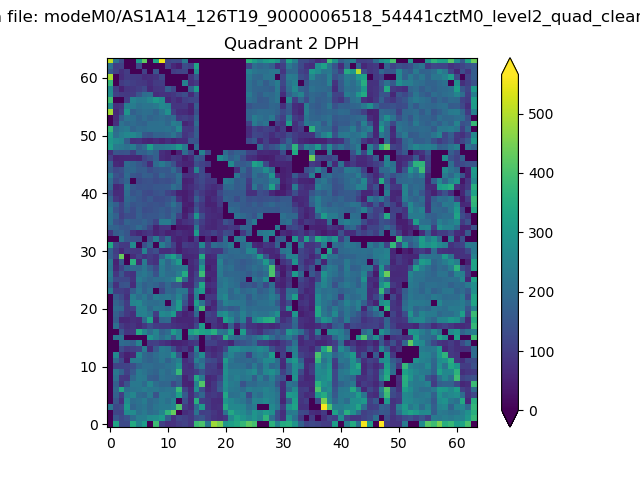
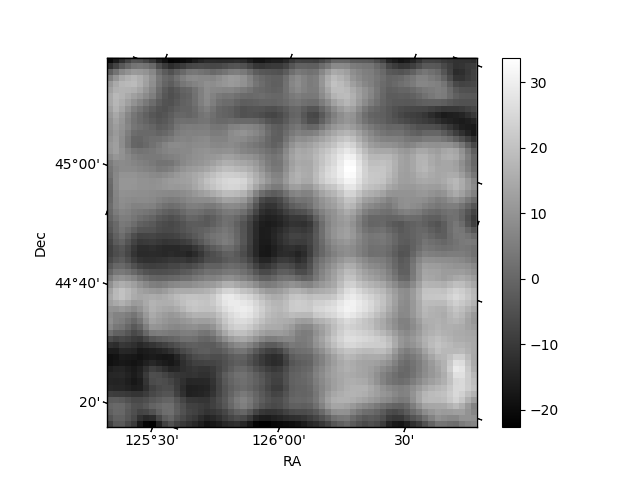
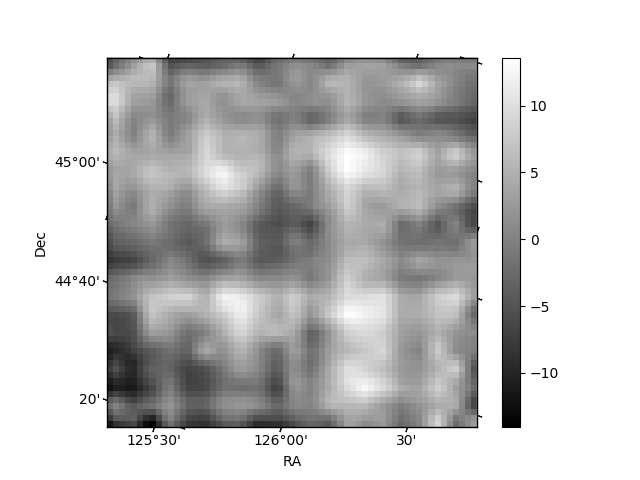
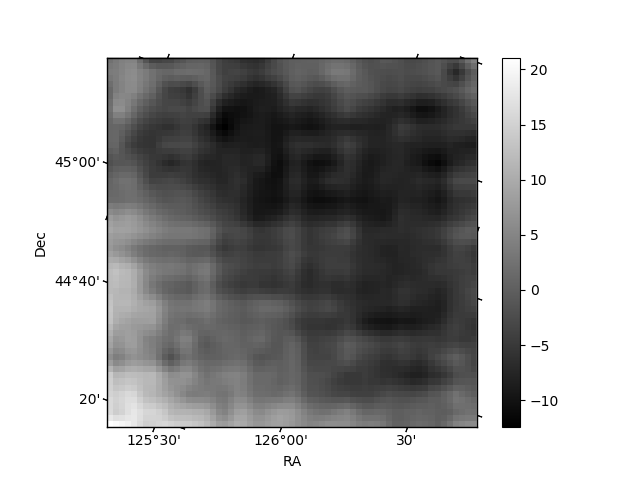
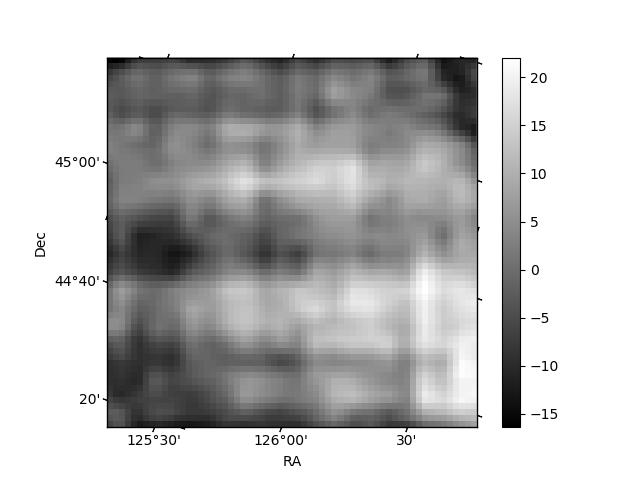
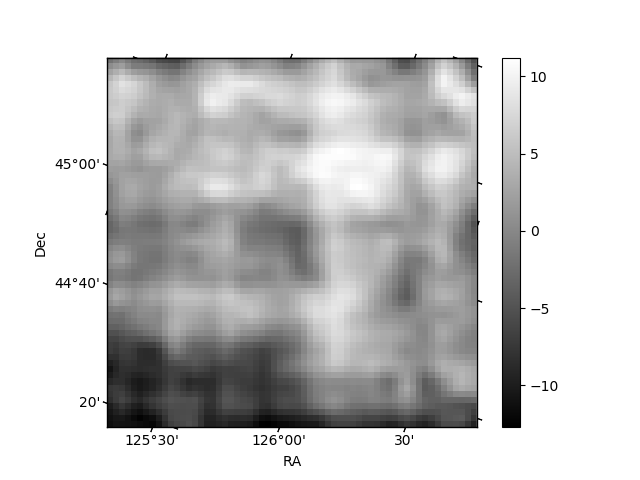
Histogram calculated using DETX and DETY for each event in the final _common_clean file
| Quadrant A | 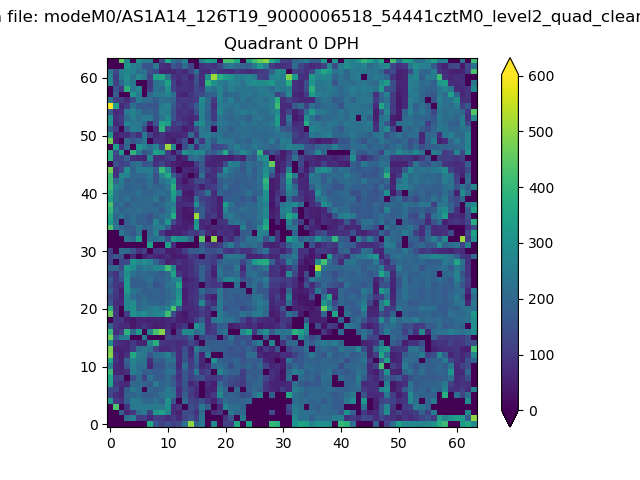 |
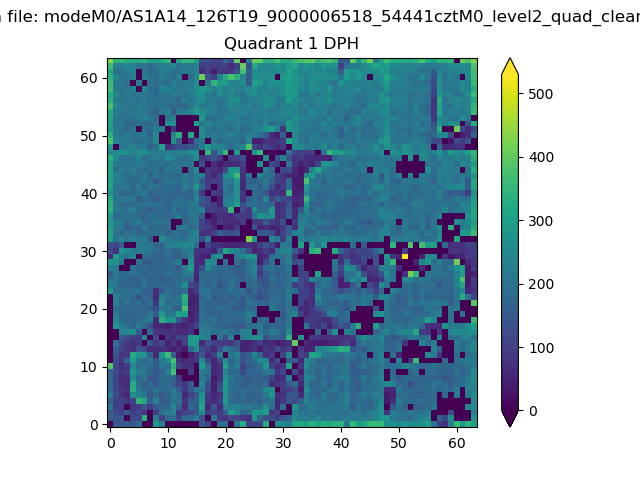 |
Quadrant B |
|---|---|---|---|
| Quadrant D | 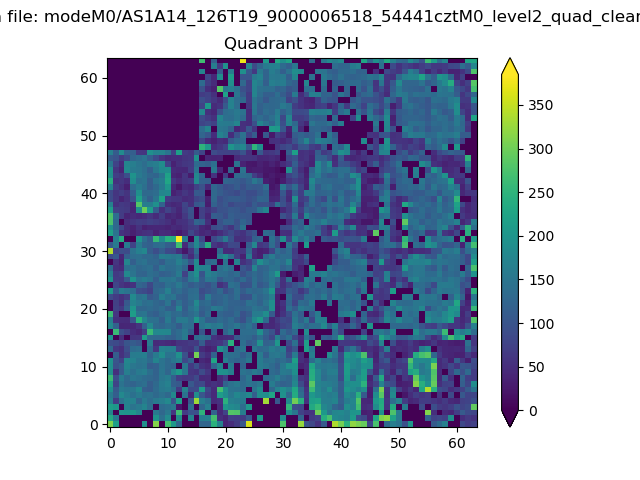 |
 |
Quadrant C |
| Plot type | Count rate plots | Images |
|---|---|---|
| Comparison with Poisson distribution Blue bars denote a histogram of data divided into 1 sec bins. Red curve is a Poisson curve with rate = median count rate of data. |
 |
 |
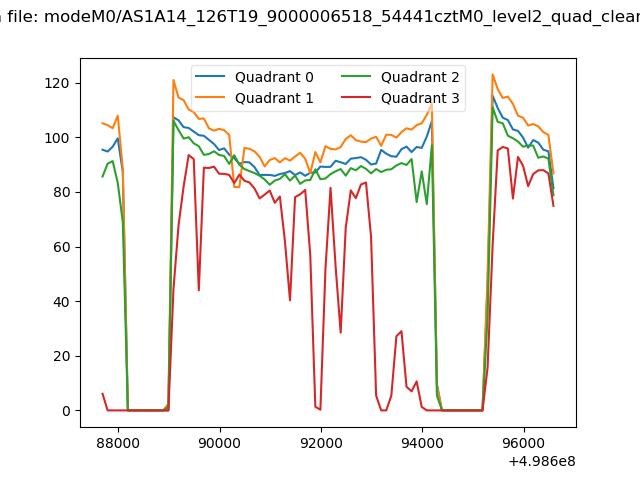
| Quadrant-wise count rates Data is divided into 100 sec bins |
 |
|
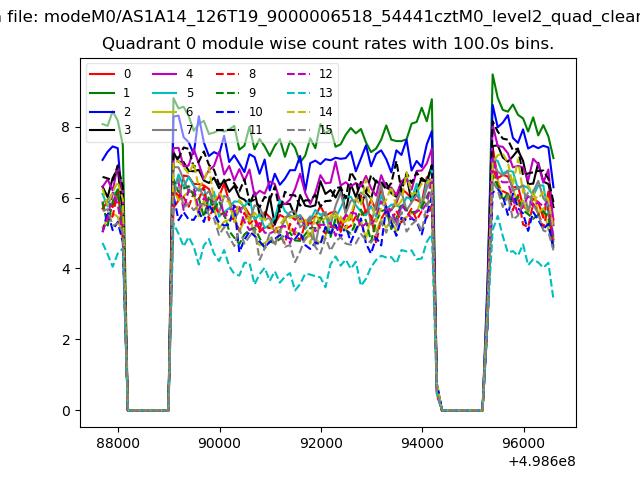
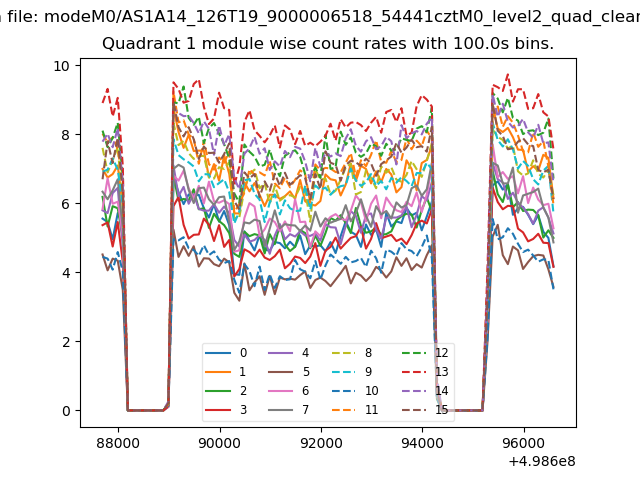
| Module-wise count rates for Quadrant A Data is divided into 100 sec bins |
 |
 |
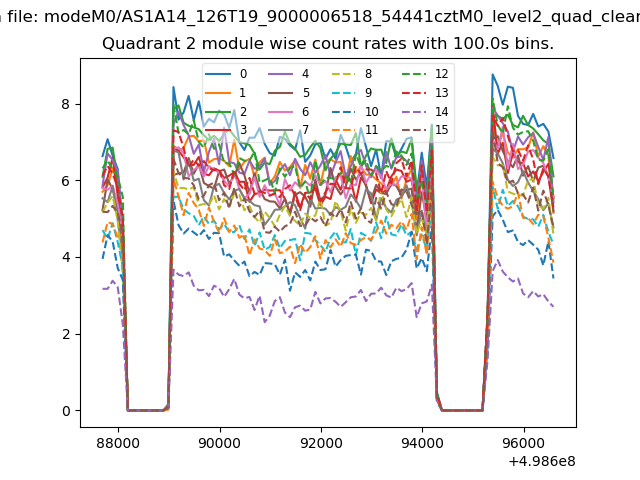
| Module-wise count rates for Quadrant B Data is divided into 100 sec bins |
 |
 |
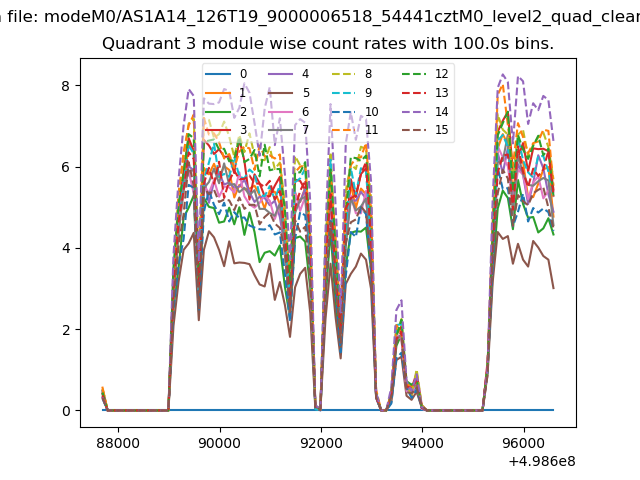
| Module-wise count rates for Quadrant C Data is divided into 100 sec bins |
 |
 |
| Module-wise count rates for Quadrant D Data is divided into 100 sec bins |
 |
 |
| Parameter | Plot |
|---|---|
| CZT HV Monitor | 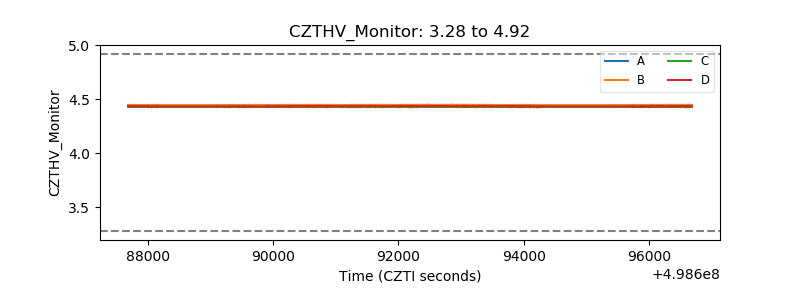 |
| D_VDD | 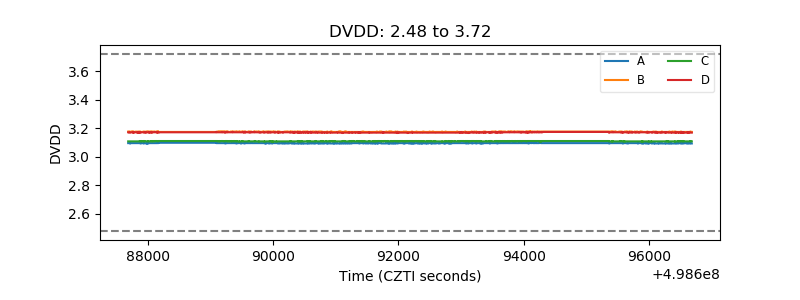 |
| Temperature 1 | 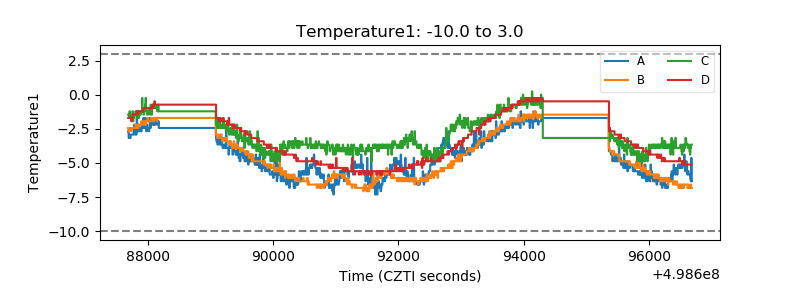 |
| Veto HV Monitor | 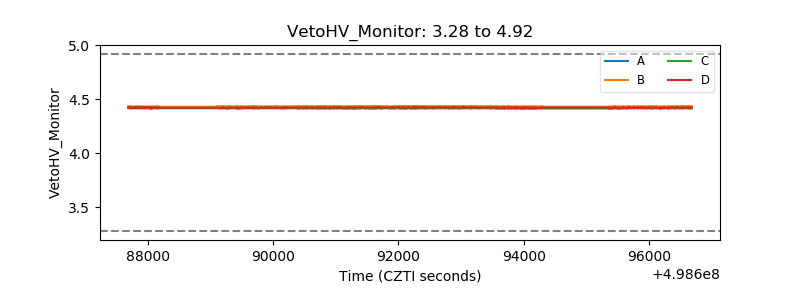 |
| Veto LLD | 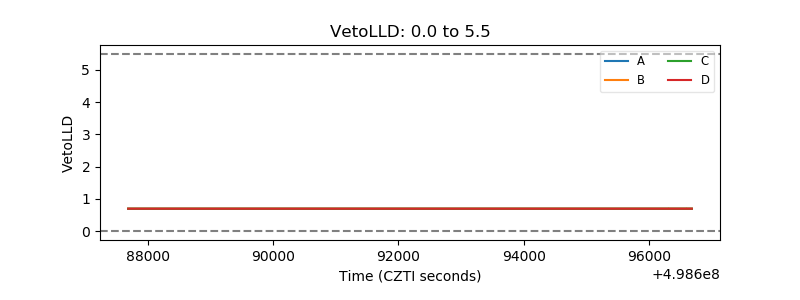 |
| Alpha Counter | 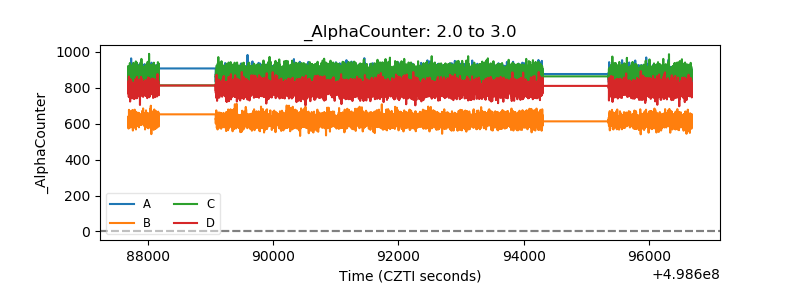 |
| _CPM_Rate | 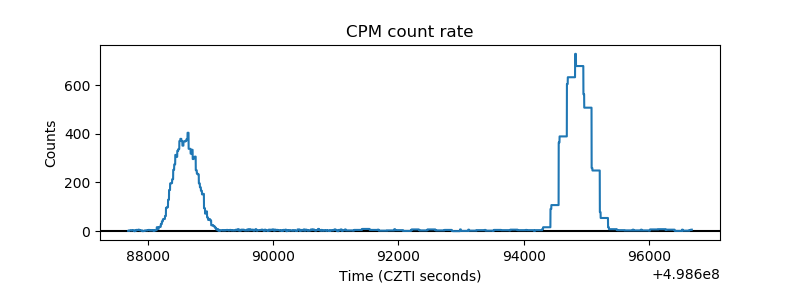 |
| CZT Counter | 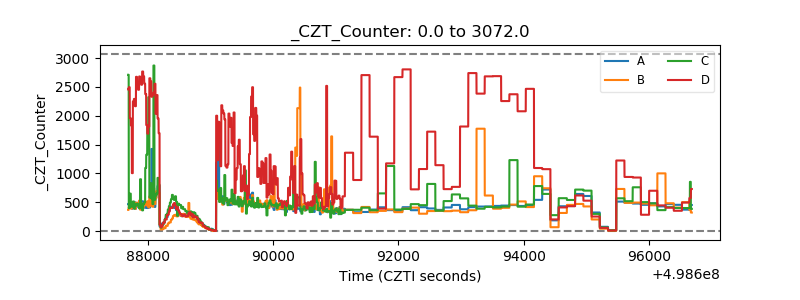 |
| +2.5 Volts monitor | 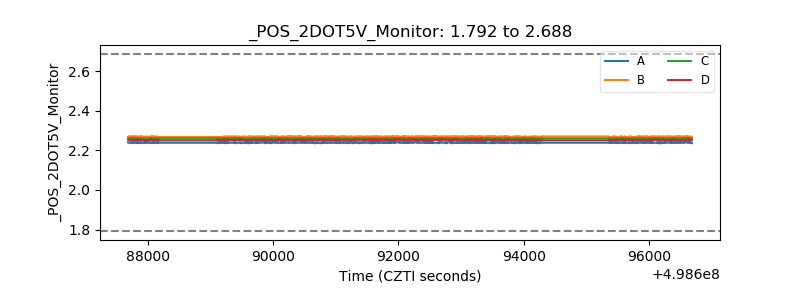 |
| +5 Volts monitor |  |
| _ROLL_ROT | 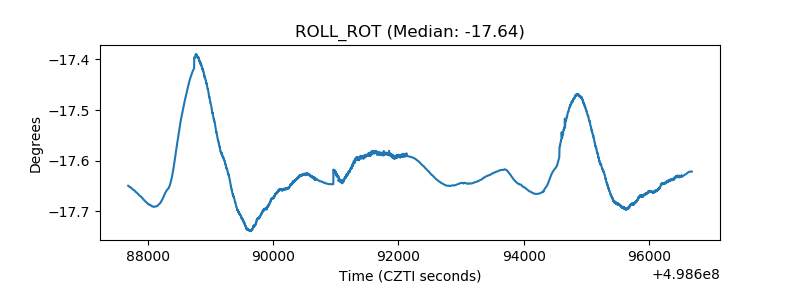 |
| _Roll_DEC | 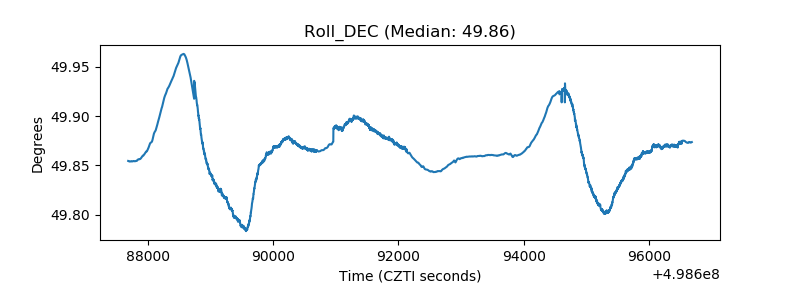 |
| _Roll_RA | 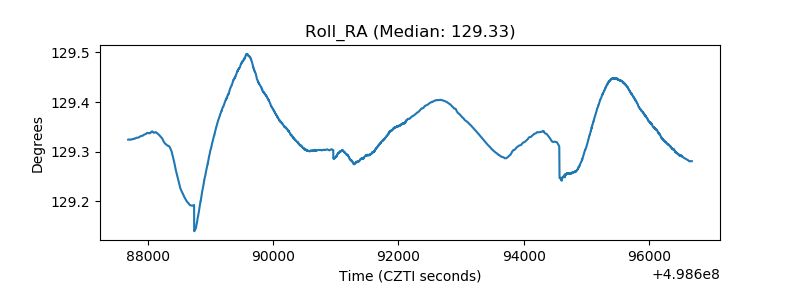 |
| Veto Counter | 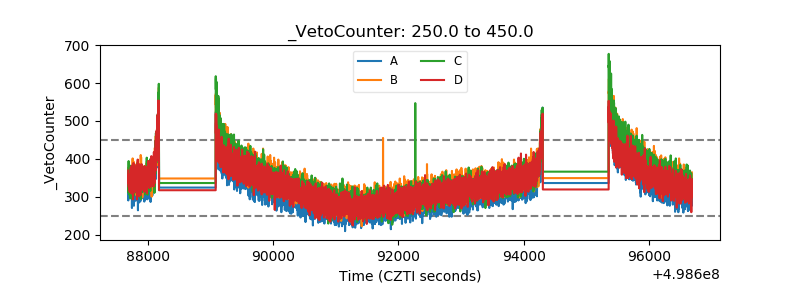 |