| Param | Original file | Final file |
|---|---|---|
| Filename | modeM0/AS1A14_126T19_9000006518_54442cztM0_level2.fits | modeM0/AS1A14_126T19_9000006518_54442cztM0_level2_quad_clean.evt |
| Size (bytes) | 579,792,960 | 86,944,320 |
| Size | 552.9 MB | 82.9 MB |
| Events in quadrant A | 2,857,779 | 639,364 |
| Events in quadrant B | 3,170,668 | 687,503 |
| Events in quadrant C | 3,965,492 | 596,202 |
| Events in quadrant D | 10,952,930 | 248,189 |
| Mode SS | |||
|---|---|---|---|
| Quadrant | BADHDUFLAG | Total packets | Discarded packets |
| A | 0 | 138 | 0 |
| B | 0 | 138 | 0 |
| C | 0 | 138 | 0 |
| D | 0 | 138 | 0 |
| Mode M0 | |||
|---|---|---|---|
| Quadrant | BADHDUFLAG | Total packets | Discarded packets |
| A | 0 | 13532 | 2 |
| B | 0 | 14379 | 2 |
| C | 0 | 16627 | 2 |
| D | 0 | 37126 | 2 |
| Mode M9 | |||
|---|---|---|---|
| Quadrant | BADHDUFLAG | Total packets | Discarded packets |
| A | 0 | 21 | 0 |
| B | 0 | 21 | 0 |
| C | 0 | 21 | 0 |
| D | 0 | 21 | 0 |
| Quadrant | Total seconds | Saturated seconds | Saturation percentage |
|---|---|---|---|
| A | 6611 | 21 | 0.317652% |
| B | 6611 | 78 | 1.179852% |
| C | 6611 | 316 | 4.779912% |
| D | 6611 | 3946 | 59.688398% |
Noise dominated data is calculated using 1-second bins in cleaned event files. If a bin has >2000 counts, and if more than 50% of those come from <1% of pixels, then it is considered to be noise-dominated and hence unusable.
| Quadrant | # 1 sec bins | Bins with >0 counts | Bins with >2000 counts | High rate bins dominated by noise | Noise dominated (total time) | Noise dominated (detector-on time) | Marked lightcurve |
|---|---|---|---|---|---|---|---|
| A | 8781 | 6613 | 2 | 2 | 0.02% | 0.03% | 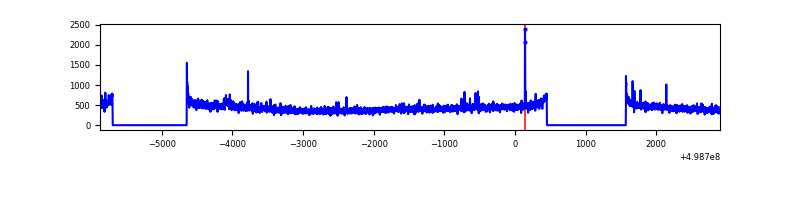 |
| B | 8781 | 6613 | 24 | 24 | 0.27% | 0.36% | 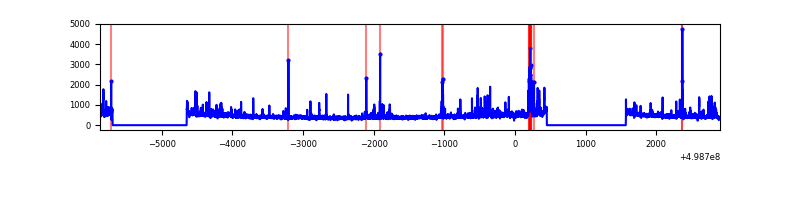 |
| C | 8781 | 6613 | 223 | 223 | 2.54% | 3.37% | 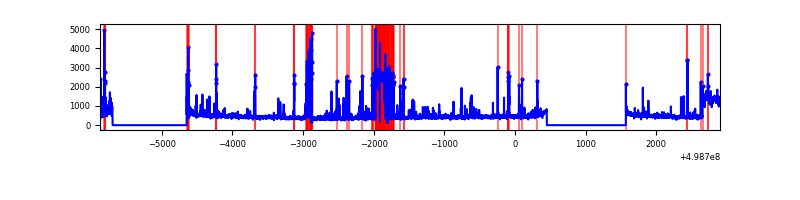 |
| D | 8780 | 6610 | 2638 | 2638 | 30.05% | 39.91% | 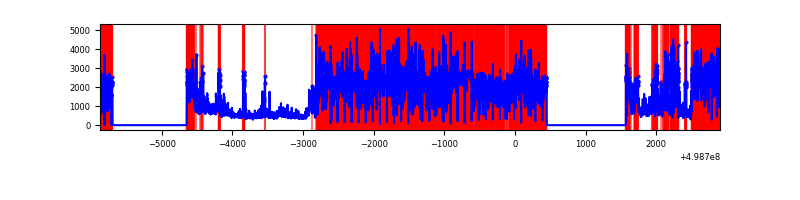 |
Top three noisy pixels from each quadrant. If the there are fewer than three noisy pixels in the level2.evt file, extra rows are filled as -1
| Pixel properties | Quadrant properties | ||||||
|---|---|---|---|---|---|---|---|
| Quadrant | DetID | PixID | Counts | Sigma | Mean | Median | Sigma |
| A | 11 | 3 | 46326 | 262.51 | 704 | 687 | 173.9 |
| A | 4 | 3 | 32707 | 184.17 | 704 | 687 | 173.9 |
| A | 8 | 6 | 15741 | 86.59 | 704 | 687 | 173.9 |
| B | 5 | 185 | 115303 | 763.67 | 699 | 675 | 150.1 |
| B | 10 | 247 | 107242 | 709.96 | 699 | 675 | 150.1 |
| B | 8 | 234 | 44924 | 294.79 | 699 | 675 | 150.1 |
| C | 4 | 5 | 726914 | 3896.03 | 673 | 667 | 186.4 |
| C | 13 | 3 | 308606 | 1651.97 | 673 | 667 | 186.4 |
| C | 14 | 254 | 64075 | 340.16 | 673 | 667 | 186.4 |
| D | 8 | 176 | 7840862 | 71888.72 | 373 | 355 | 109.1 |
| D | 2 | 172 | 901188 | 8259.64 | 373 | 355 | 109.1 |
| D | 7 | 70 | 302759 | 2772.71 | 373 | 355 | 109.1 |
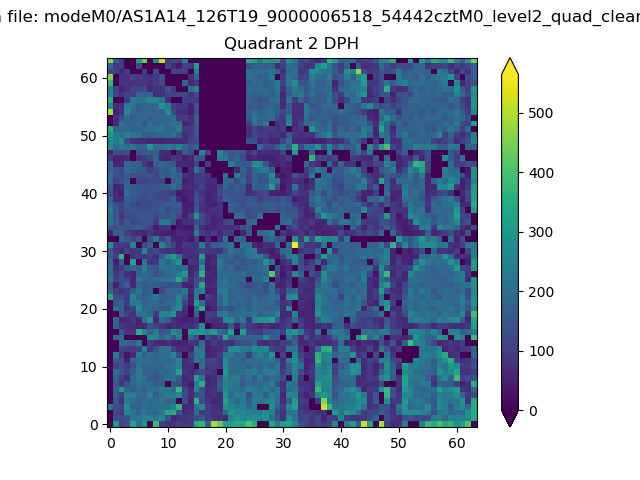
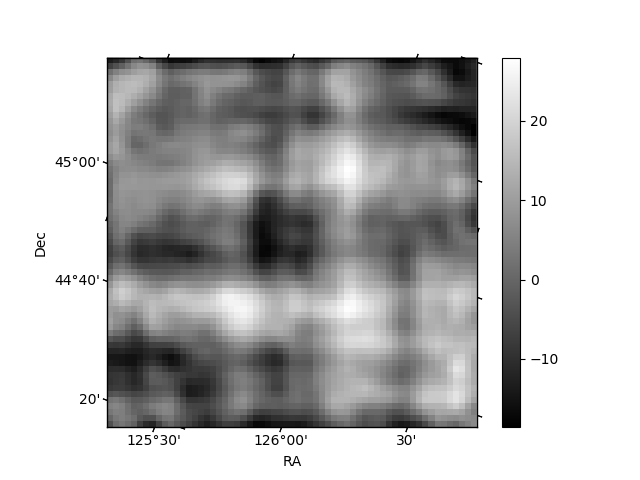
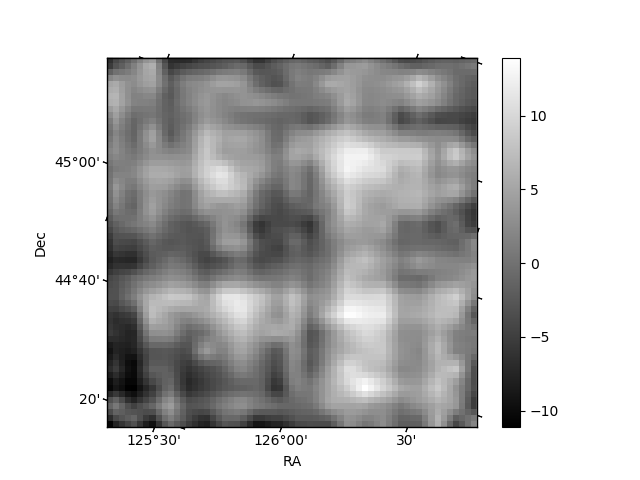
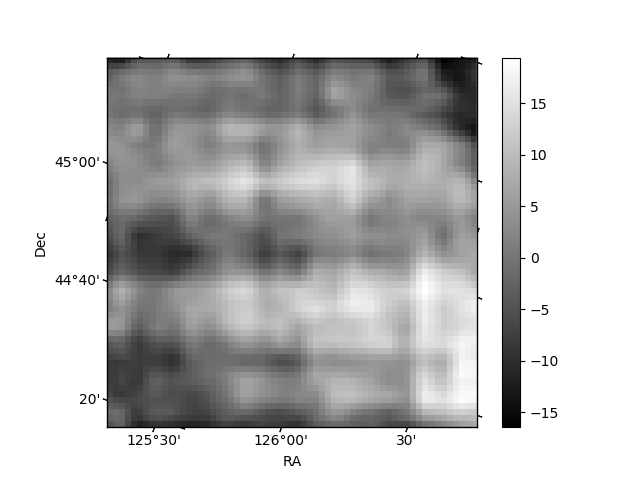
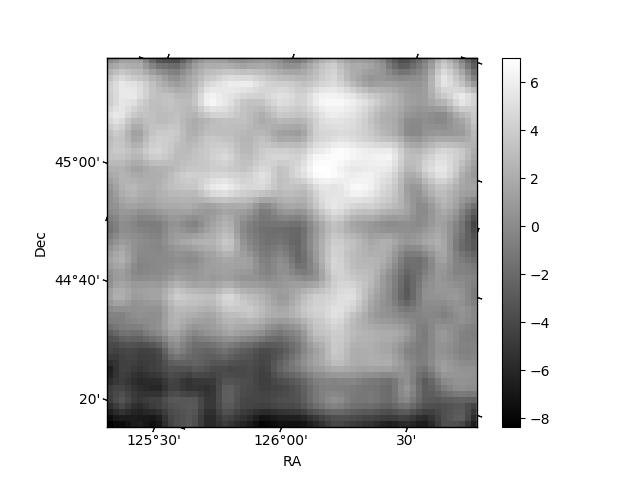
Histogram calculated using DETX and DETY for each event in the final _common_clean file
| Quadrant A | 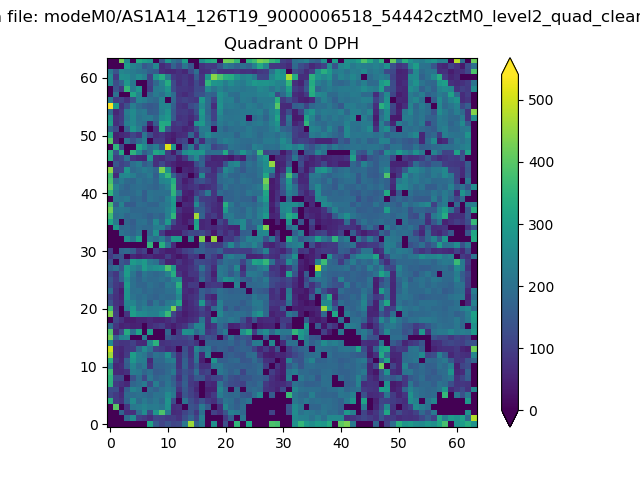 |
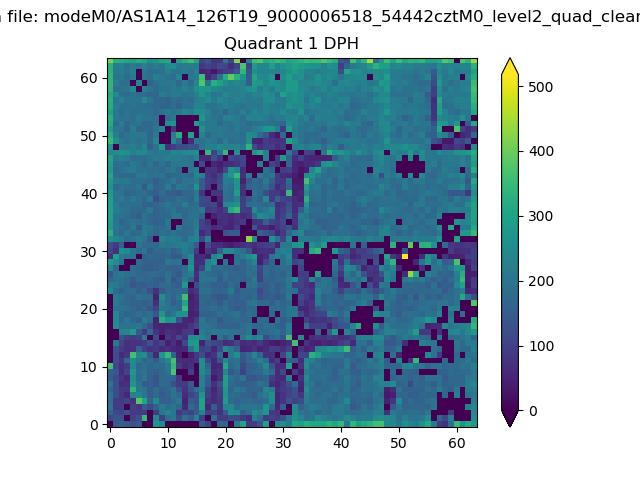 |
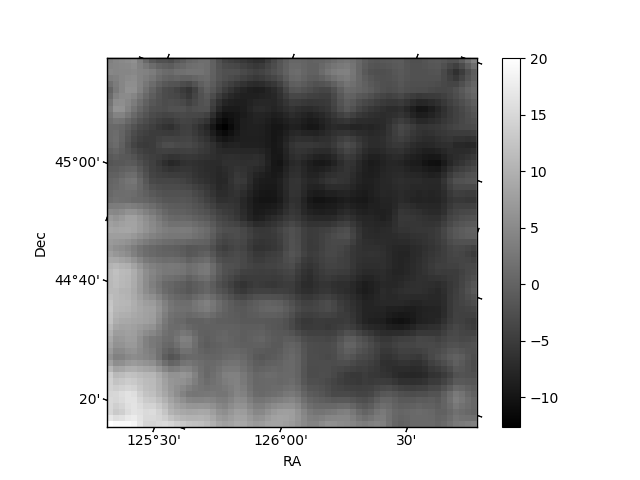
Quadrant B |
|---|---|---|---|
| Quadrant D | 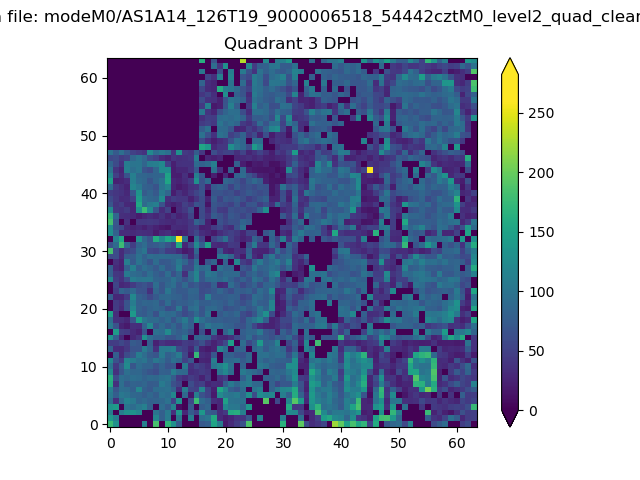 |
 |
Quadrant C |
| Plot type | Count rate plots | Images |
|---|---|---|
| Comparison with Poisson distribution Blue bars denote a histogram of data divided into 1 sec bins. Red curve is a Poisson curve with rate = median count rate of data. |
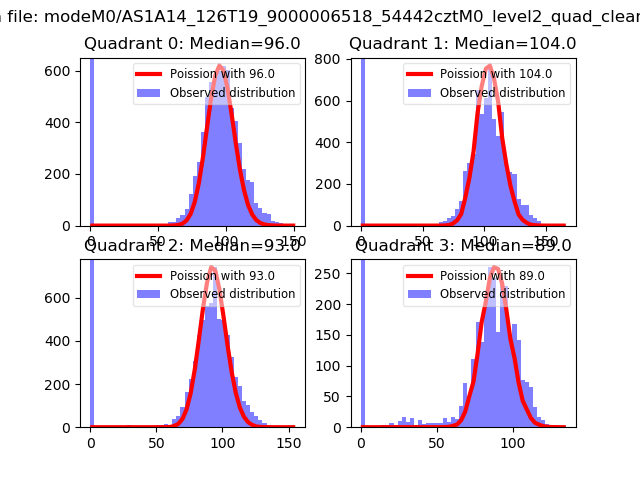 |
 |
| Quadrant-wise count rates Data is divided into 100 sec bins |
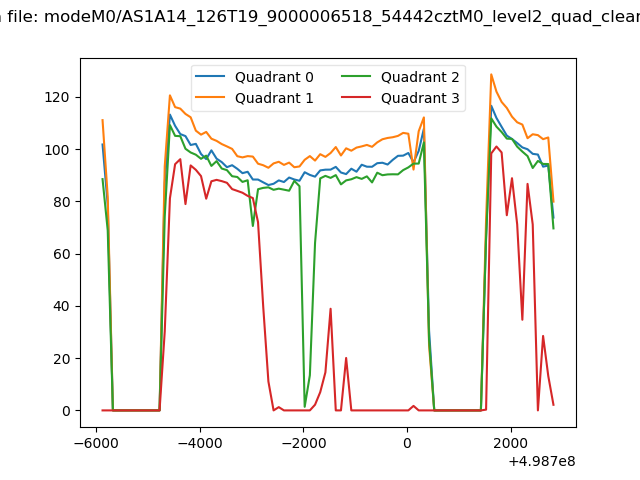 |
|
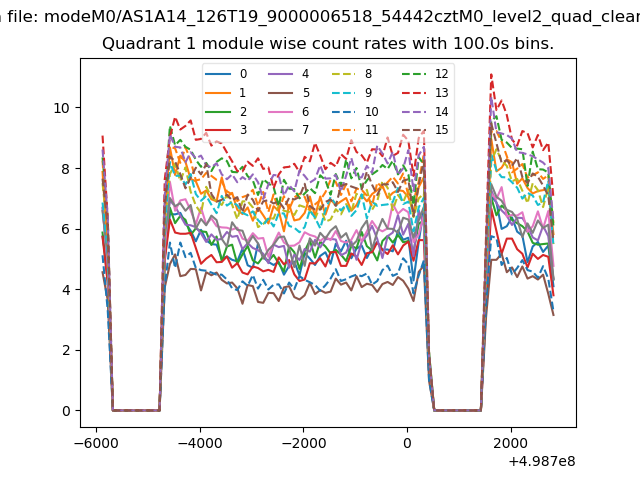
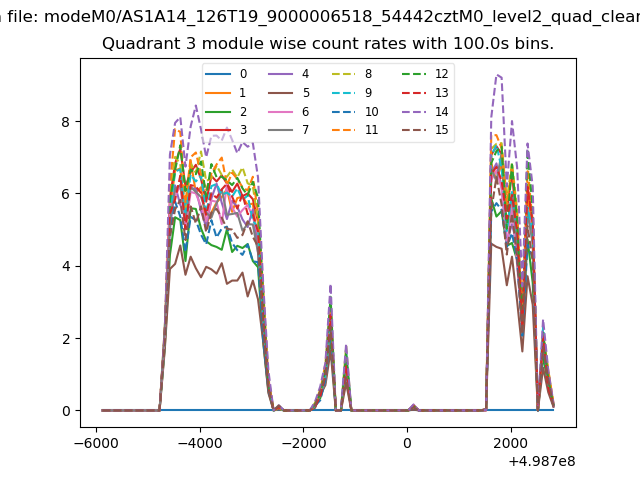
| Module-wise count rates for Quadrant A Data is divided into 100 sec bins |
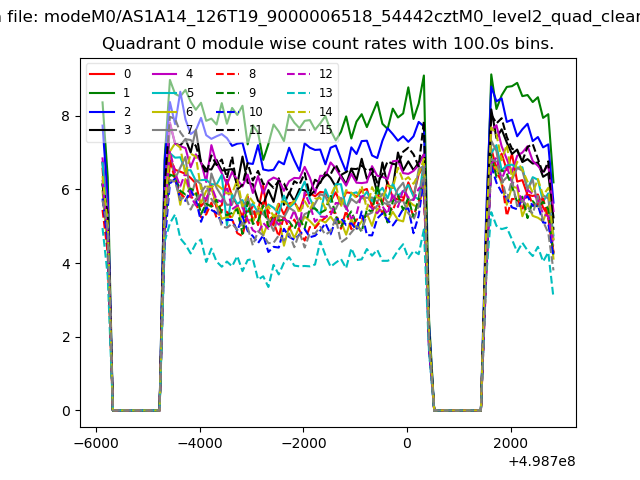 |
 |
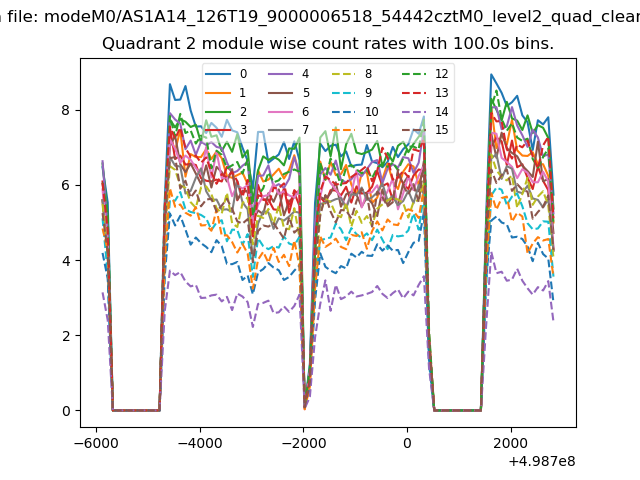
| Module-wise count rates for Quadrant B Data is divided into 100 sec bins |
 |
 |
| Module-wise count rates for Quadrant C Data is divided into 100 sec bins |
 |
 |
| Module-wise count rates for Quadrant D Data is divided into 100 sec bins |
 |
 |
| Parameter | Plot |
|---|---|
| CZT HV Monitor | 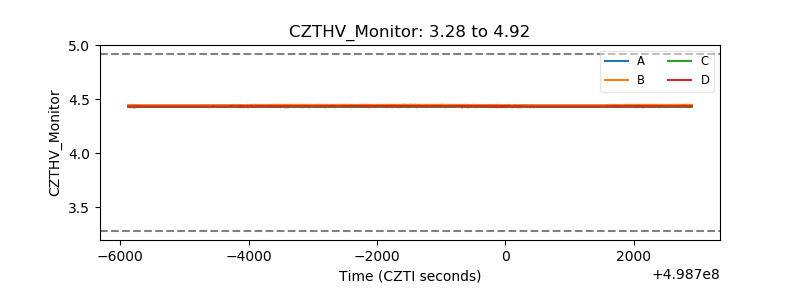 |
| D_VDD | 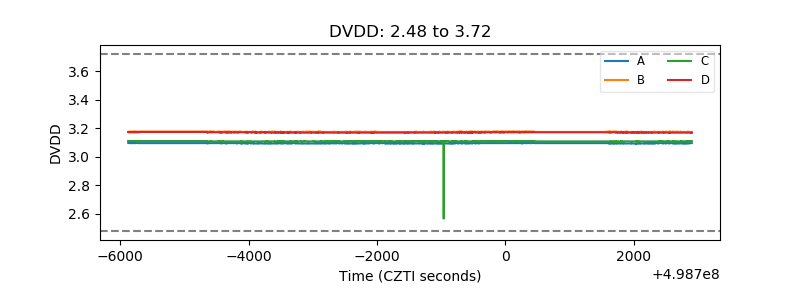 |
| Temperature 1 | 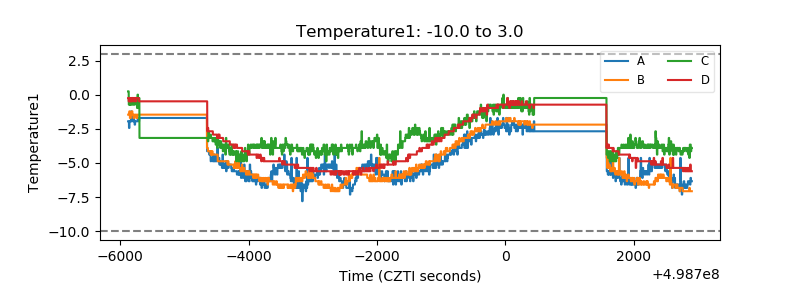 |
| Veto HV Monitor | 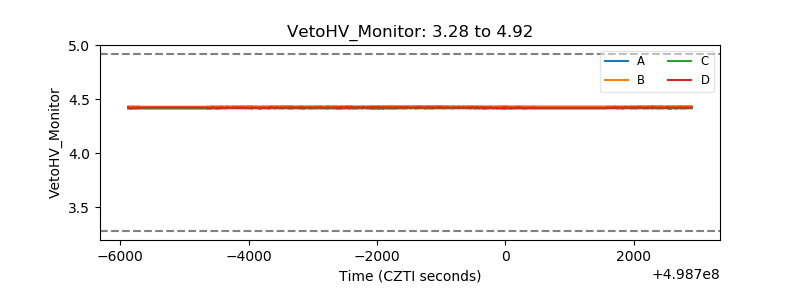 |
| Veto LLD | 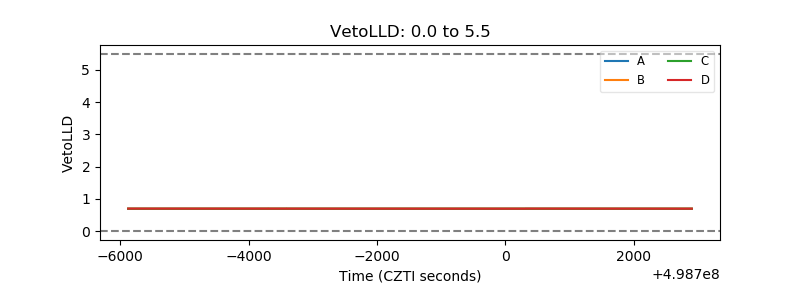 |
| Alpha Counter | 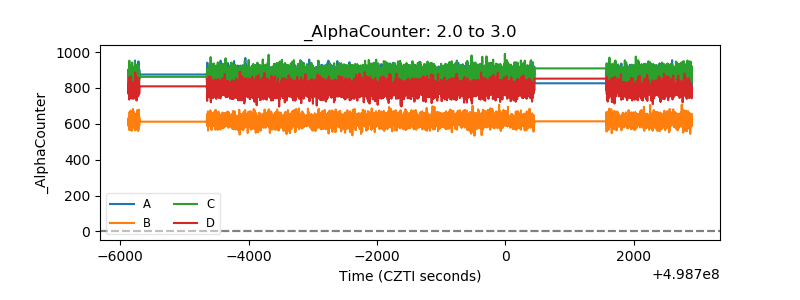 |
| _CPM_Rate | 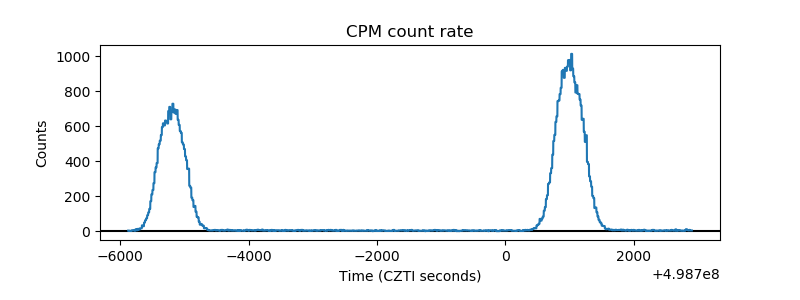 |
| CZT Counter | 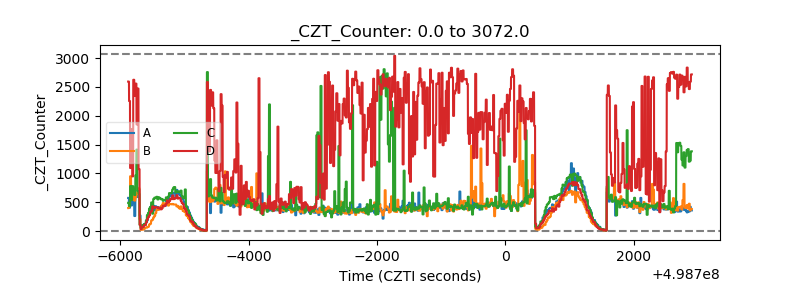 |
| +2.5 Volts monitor | 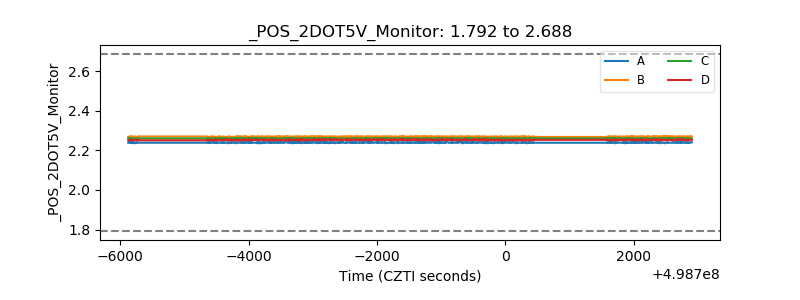 |
| +5 Volts monitor | 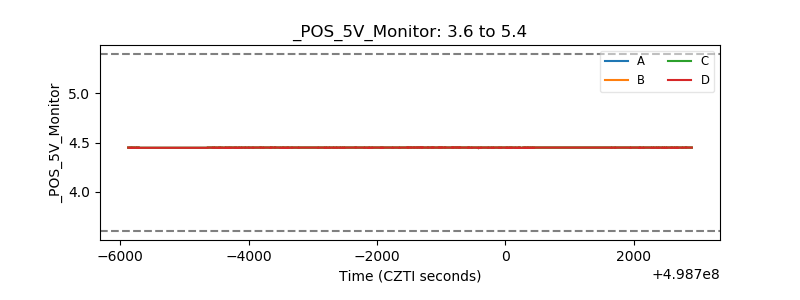 |
| _ROLL_ROT | 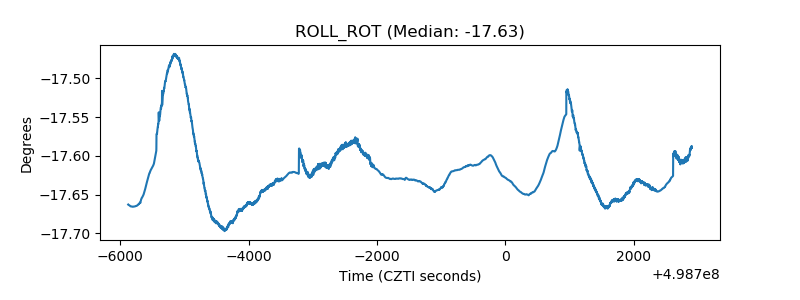 |
| _Roll_DEC | 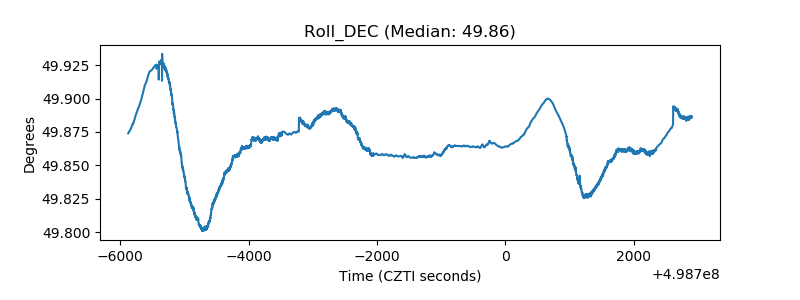 |
| _Roll_RA | 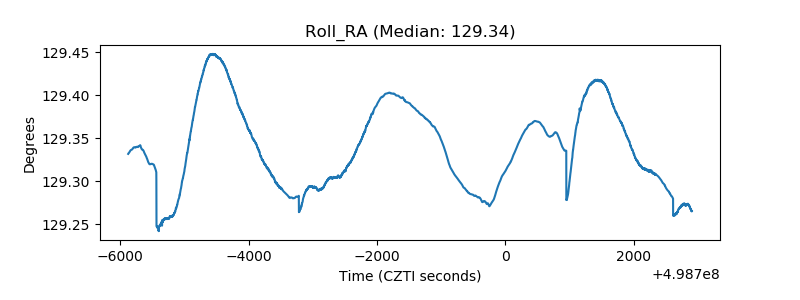 |
| Veto Counter | 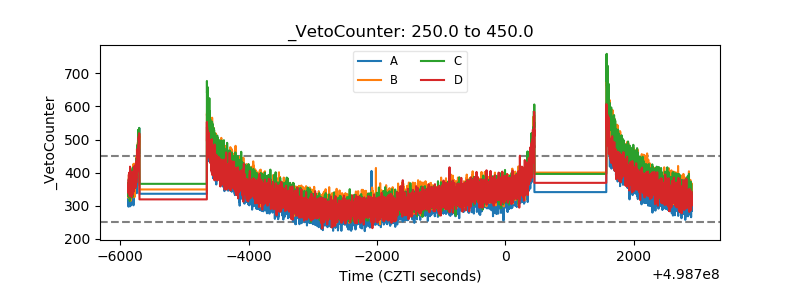 |