| Param | Original file | Final file |
|---|---|---|
| Filename | modeM0/AS1A14_126T19_9000006518_54443cztM0_level2.fits | modeM0/AS1A14_126T19_9000006518_54443cztM0_level2_quad_clean.evt |
| Size (bytes) | 530,507,520 | 90,858,240 |
| Size | 505.9 MB | 86.6 MB |
| Events in quadrant A | 2,699,892 | 628,304 |
| Events in quadrant B | 2,864,137 | 679,049 |
| Events in quadrant C | 4,386,139 | 598,692 |
| Events in quadrant D | 9,189,995 | 398,113 |
| Mode SS | |||
|---|---|---|---|
| Quadrant | BADHDUFLAG | Total packets | Discarded packets |
| A | 0 | 132 | 0 |
| B | 0 | 132 | 0 |
| C | 0 | 132 | 0 |
| D | 0 | 132 | 0 |
| Mode M0 | |||
|---|---|---|---|
| Quadrant | BADHDUFLAG | Total packets | Discarded packets |
| A | 0 | 13032 | 2 |
| B | 0 | 13396 | 2 |
| C | 0 | 17427 | 2 |
| D | 0 | 31729 | 2 |
| Mode M9 | |||
|---|---|---|---|
| Quadrant | BADHDUFLAG | Total packets | Discarded packets |
| A | 0 | 20 | 0 |
| B | 0 | 20 | 0 |
| C | 0 | 21 | 0 |
| D | 0 | 21 | 0 |
| Quadrant | Total seconds | Saturated seconds | Saturation percentage |
|---|---|---|---|
| A | 6400 | 18 | 0.281250% |
| B | 6400 | 43 | 0.671875% |
| C | 6400 | 118 | 1.843750% |
| D | 6400 | 2091 | 32.671875% |
Noise dominated data is calculated using 1-second bins in cleaned event files. If a bin has >2000 counts, and if more than 50% of those come from <1% of pixels, then it is considered to be noise-dominated and hence unusable.
| Quadrant | # 1 sec bins | Bins with >0 counts | Bins with >2000 counts | High rate bins dominated by noise | Noise dominated (total time) | Noise dominated (detector-on time) | Marked lightcurve |
|---|---|---|---|---|---|---|---|
| A | 7555 | 6401 | 0 | 0 | 0.00% | 0.00% | 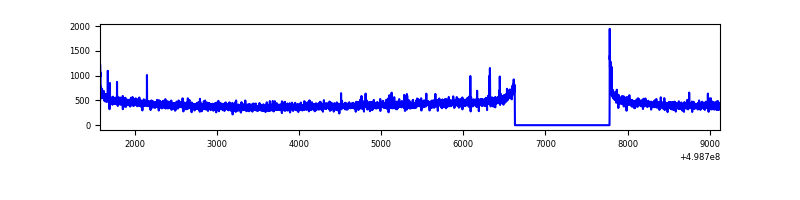 |
| B | 7555 | 6401 | 7 | 7 | 0.09% | 0.11% | 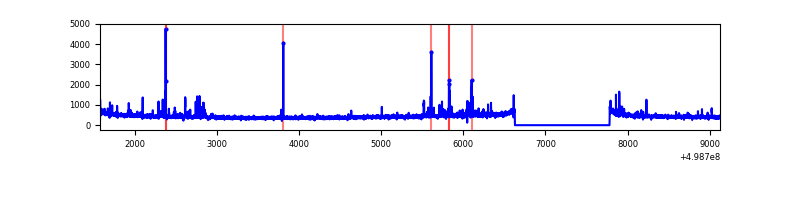 |
| C | 7555 | 6401 | 107 | 107 | 1.42% | 1.67% | 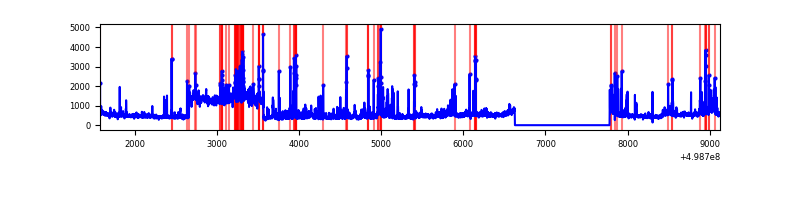 |
| D | 7555 | 6401 | 1916 | 1916 | 25.36% | 29.93% | 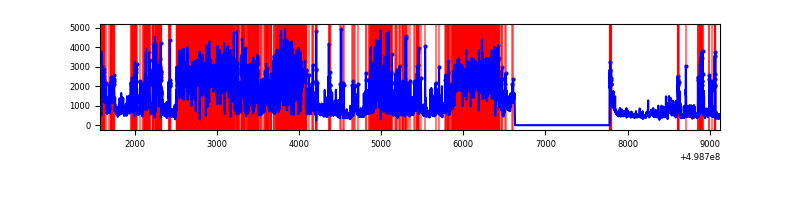 |
Top three noisy pixels from each quadrant. If the there are fewer than three noisy pixels in the level2.evt file, extra rows are filled as -1
| Pixel properties | Quadrant properties | ||||||
|---|---|---|---|---|---|---|---|
| Quadrant | DetID | PixID | Counts | Sigma | Mean | Median | Sigma |
| A | 4 | 3 | 25735 | 148.35 | 681 | 663 | 169.0 |
| A | 13 | 254 | 15450 | 87.49 | 681 | 663 | 169.0 |
| A | 11 | 3 | 11258 | 62.69 | 681 | 663 | 169.0 |
| B | 10 | 247 | 64439 | 437.76 | 677 | 653 | 145.7 |
| B | 0 | 213 | 46629 | 315.53 | 677 | 653 | 145.7 |
| B | 5 | 185 | 36002 | 242.6 | 677 | 653 | 145.7 |
| C | 4 | 5 | 1124377 | 6103.02 | 661 | 654 | 184.1 |
| C | 13 | 3 | 311698 | 1689.3 | 661 | 654 | 184.1 |
| C | 2 | 255 | 127337 | 688.02 | 661 | 654 | 184.1 |
| D | 8 | 176 | 4519429 | 28340.18 | 556 | 530 | 159.5 |
| D | 7 | 70 | 1113280 | 6978.59 | 556 | 530 | 159.5 |
| D | 2 | 172 | 1077463 | 6753.96 | 556 | 530 | 159.5 |
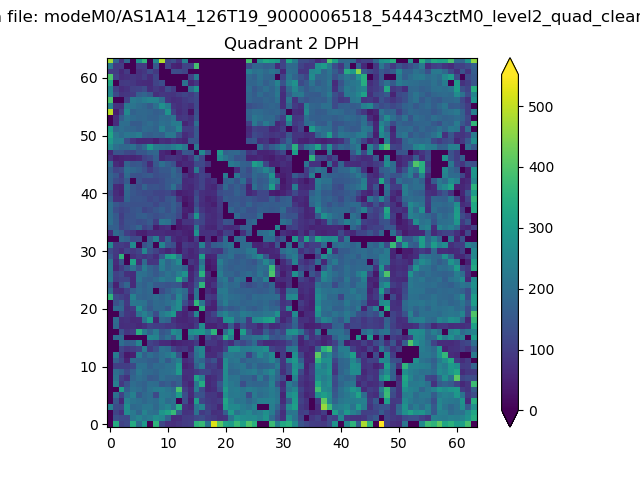
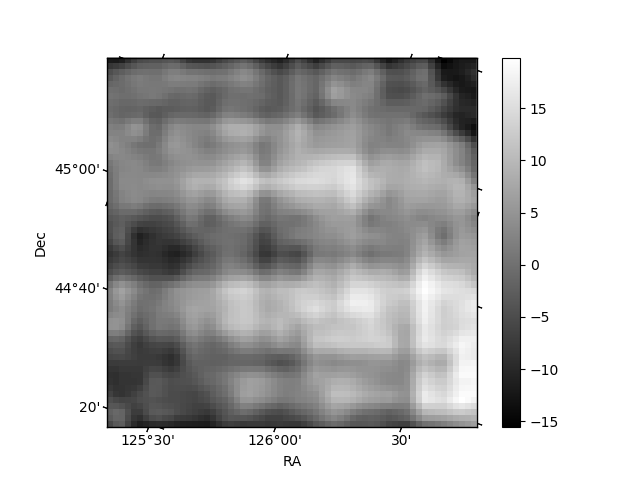
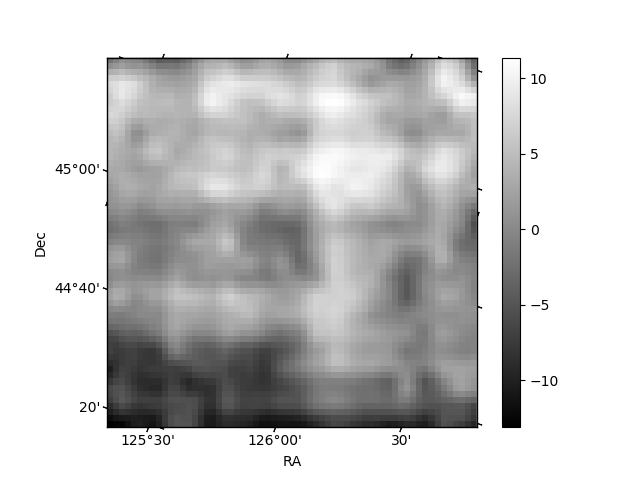
Histogram calculated using DETX and DETY for each event in the final _common_clean file
| Quadrant A | 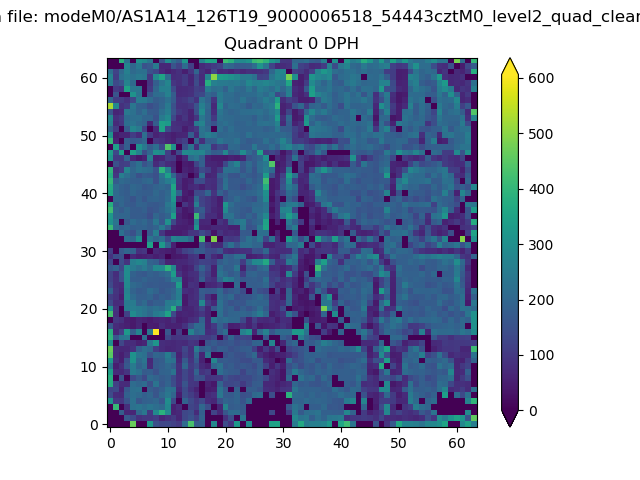 |
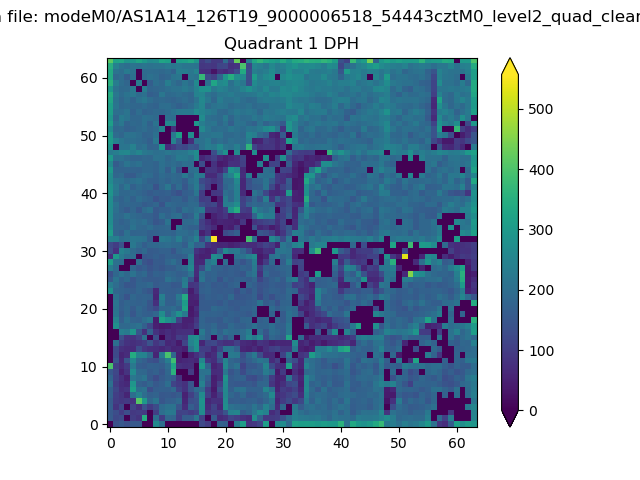 |
Quadrant B |
|---|---|---|---|
| Quadrant D | 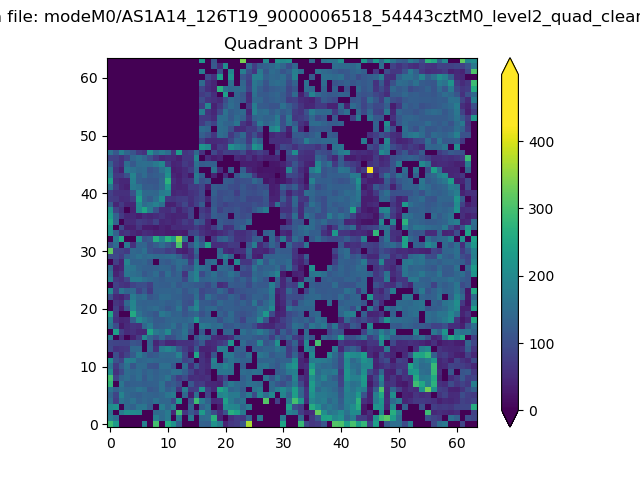 |
 |
Quadrant C |
| Plot type | Count rate plots | Images |
|---|---|---|
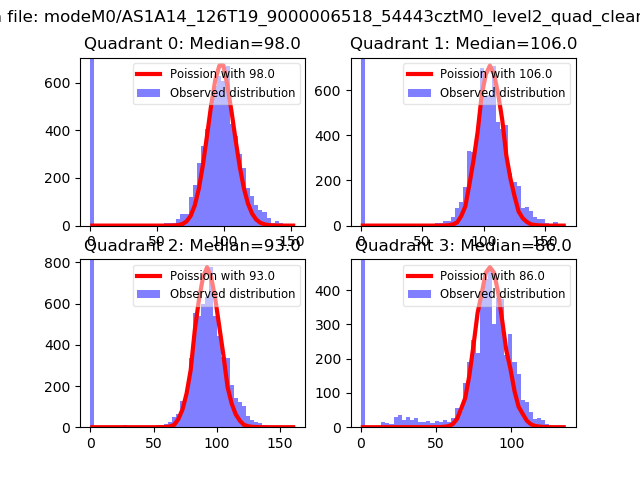
| Comparison with Poisson distribution Blue bars denote a histogram of data divided into 1 sec bins. Red curve is a Poisson curve with rate = median count rate of data. |
 |
 |
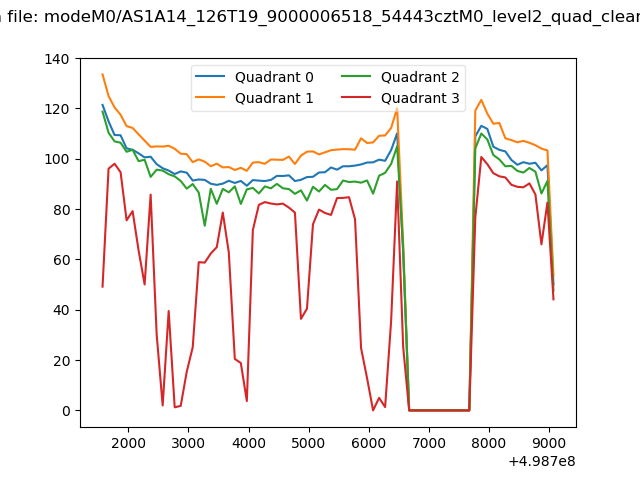
| Quadrant-wise count rates Data is divided into 100 sec bins |
 |
|
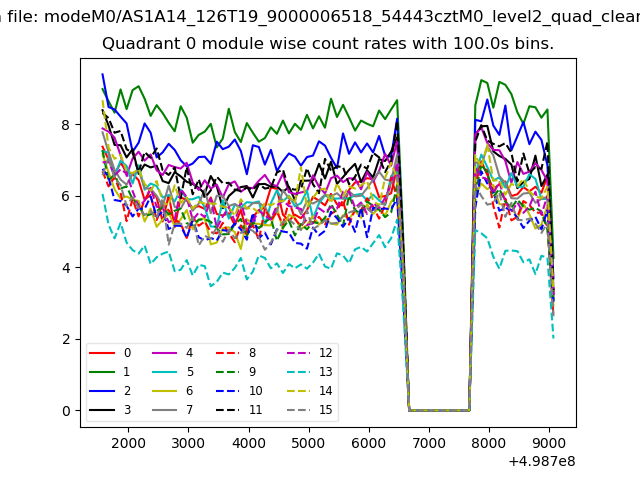
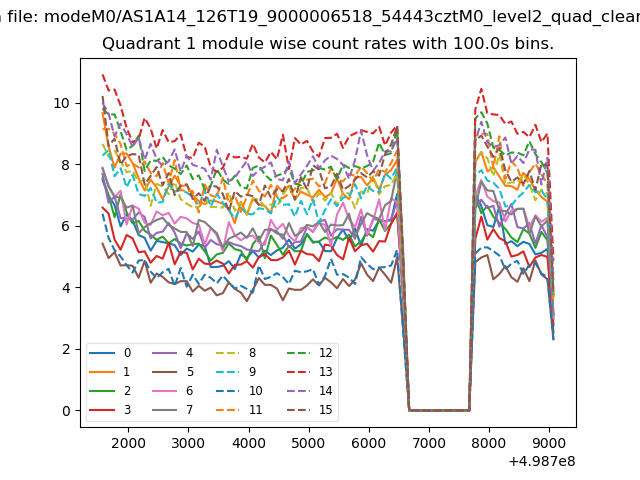
| Module-wise count rates for Quadrant A Data is divided into 100 sec bins |
 |
 |
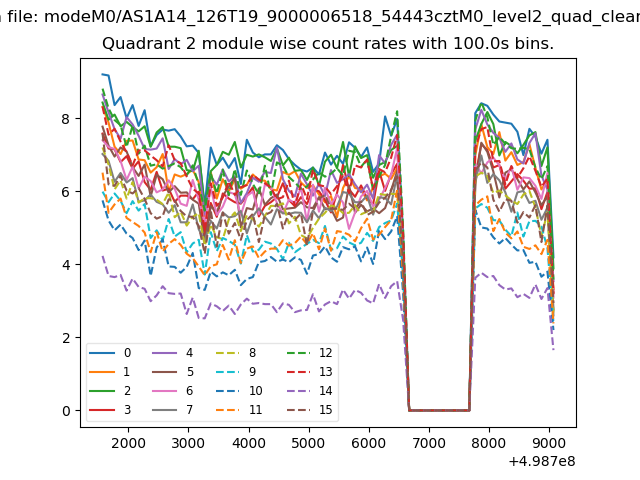
| Module-wise count rates for Quadrant B Data is divided into 100 sec bins |
 |
 |
| Module-wise count rates for Quadrant C Data is divided into 100 sec bins |
 |
 |
| Module-wise count rates for Quadrant D Data is divided into 100 sec bins |
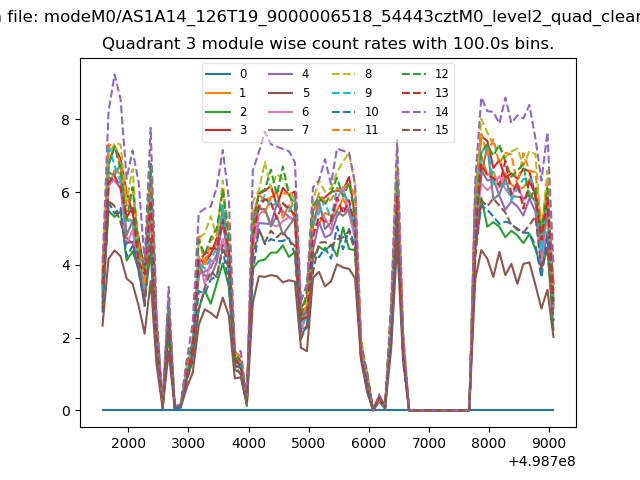 |
 |
| Parameter | Plot |
|---|---|
| CZT HV Monitor | 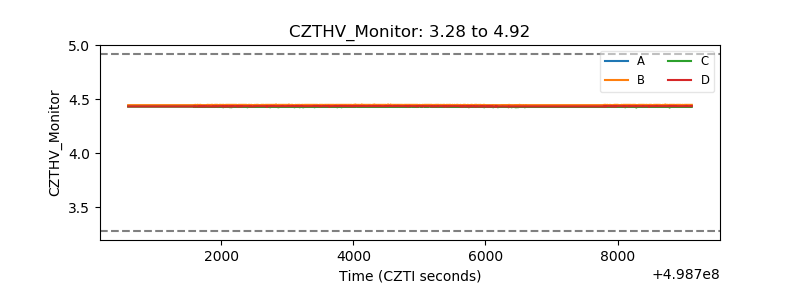 |
| D_VDD | 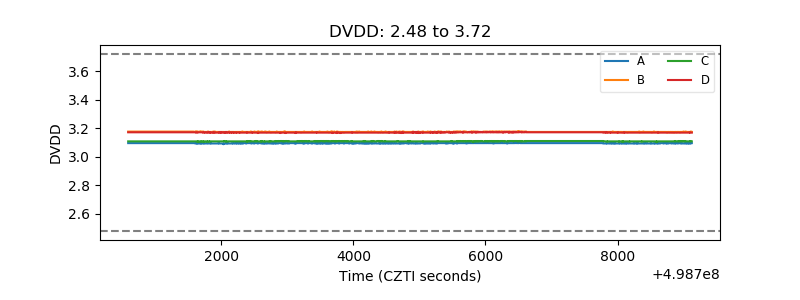 |
| Temperature 1 | 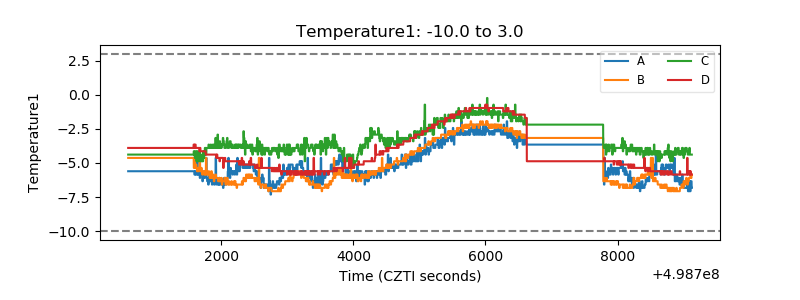 |
| Veto HV Monitor | 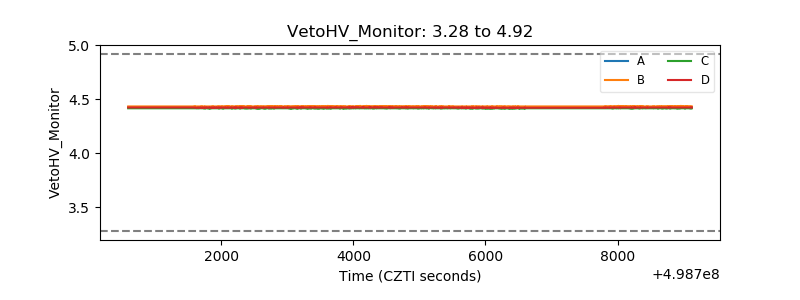 |
| Veto LLD | 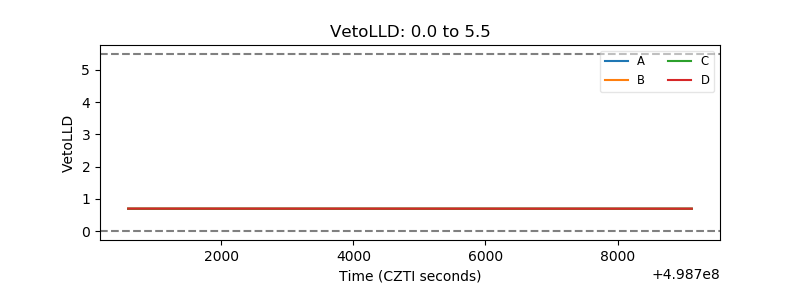 |
| Alpha Counter | 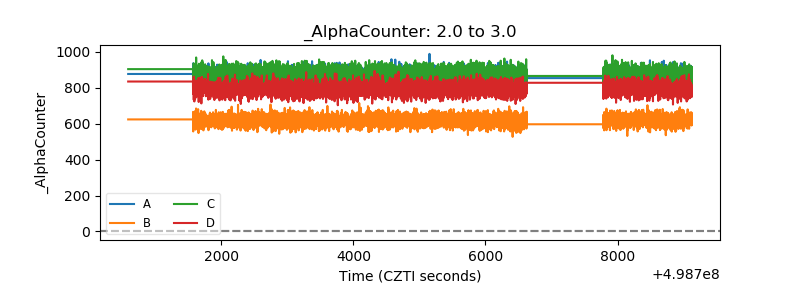 |
| _CPM_Rate | 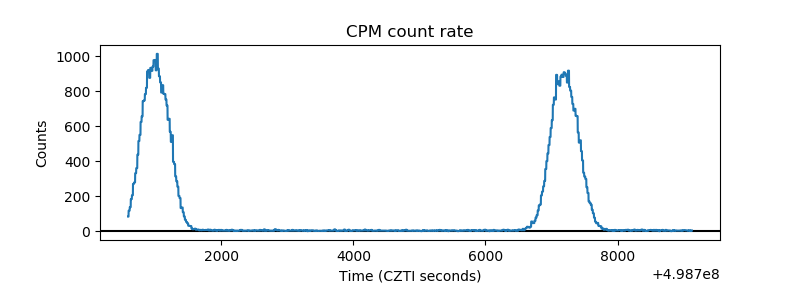 |
| CZT Counter | 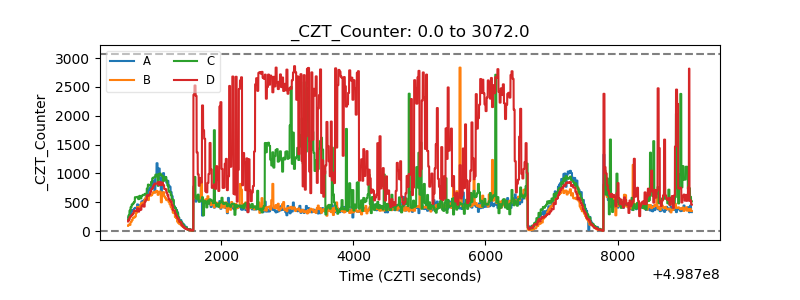 |
| +2.5 Volts monitor | 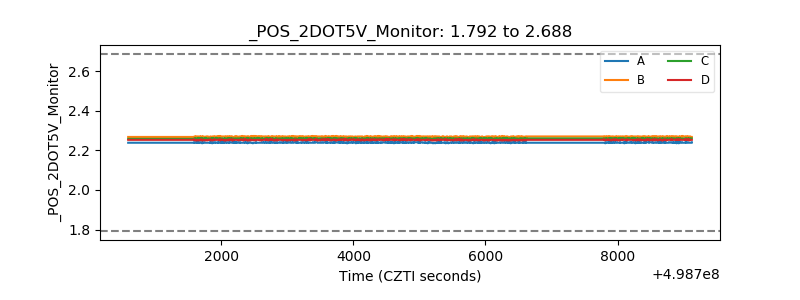 |
| +5 Volts monitor | 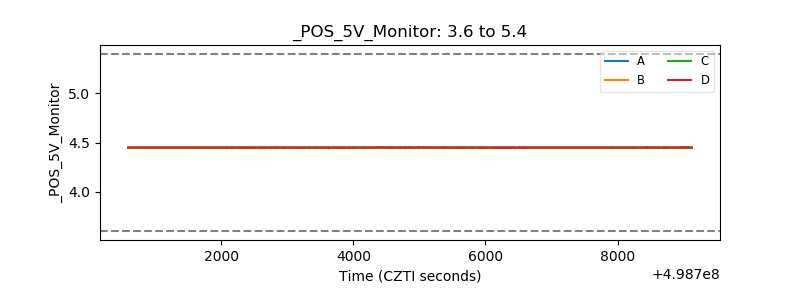 |
| _ROLL_ROT | 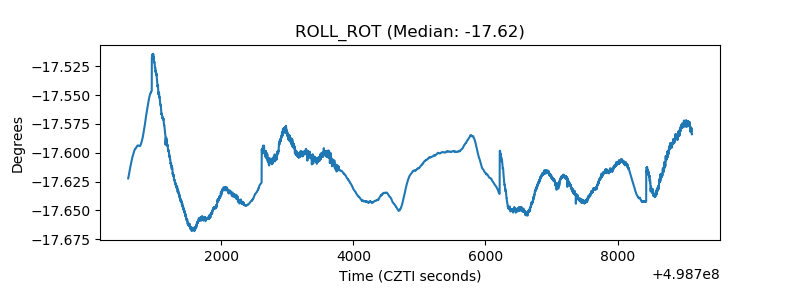 |
| _Roll_DEC | 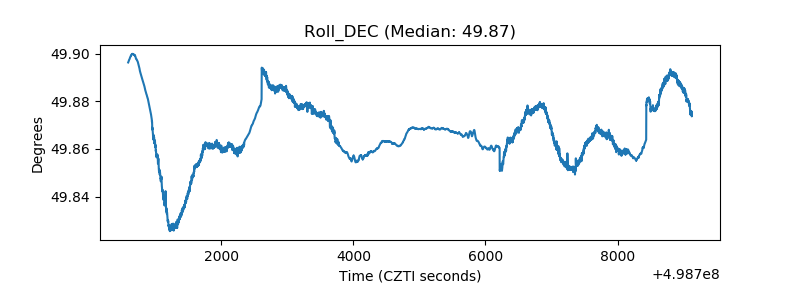 |
| _Roll_RA | 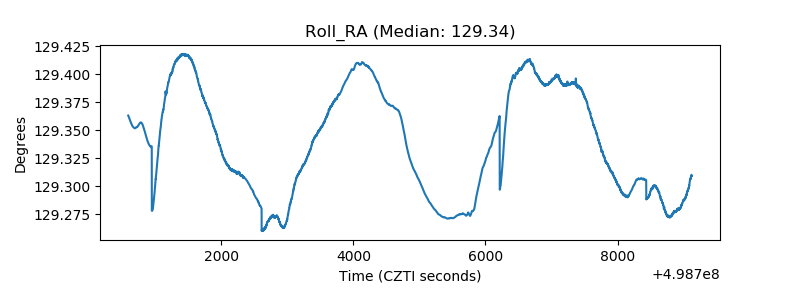 |
| Veto Counter | 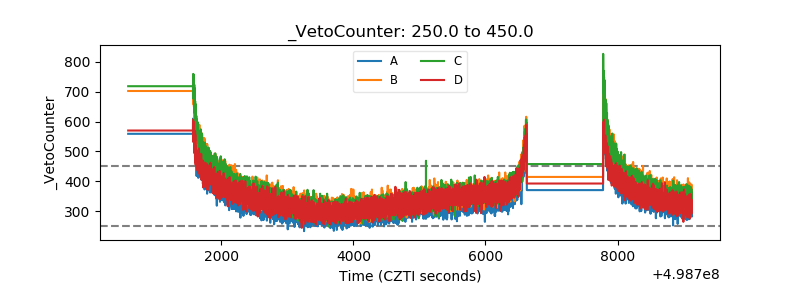 |