| Param | Original file | Final file |
|---|---|---|
| Filename | modeM0/AS1A14_126T19_9000006518_54444cztM0_level2.fits | modeM0/AS1A14_126T19_9000006518_54444cztM0_level2_quad_clean.evt |
| Size (bytes) | 641,626,560 | 92,672,640 |
| Size | 611.9 MB | 88.4 MB |
| Events in quadrant A | 2,934,739 | 658,430 |
| Events in quadrant B | 3,196,233 | 697,096 |
| Events in quadrant C | 9,816,401 | 489,736 |
| Events in quadrant D | 7,281,732 | 491,308 |
| Mode SS | |||
|---|---|---|---|
| Quadrant | BADHDUFLAG | Total packets | Discarded packets |
| A | 0 | 138 | 0 |
| B | 0 | 138 | 0 |
| C | 0 | 138 | 0 |
| D | 0 | 138 | 0 |
| Mode M0 | |||
|---|---|---|---|
| Quadrant | BADHDUFLAG | Total packets | Discarded packets |
| A | 0 | 13994 | 2 |
| B | 0 | 14725 | 3 |
| C | 0 | 33730 | 2 |
| D | 0 | 26314 | 2 |
| Mode M9 | |||
|---|---|---|---|
| Quadrant | BADHDUFLAG | Total packets | Discarded packets |
| A | 0 | 18 | 0 |
| B | 0 | 18 | 0 |
| C | 0 | 19 | 0 |
| D | 0 | 19 | 0 |
| Quadrant | Total seconds | Saturated seconds | Saturation percentage |
|---|---|---|---|
| A | 6734 | 32 | 0.475200% |
| B | 6733 | 173 | 2.569434% |
| C | 6733 | 1546 | 22.961533% |
| D | 6733 | 1248 | 18.535571% |
Noise dominated data is calculated using 1-second bins in cleaned event files. If a bin has >2000 counts, and if more than 50% of those come from <1% of pixels, then it is considered to be noise-dominated and hence unusable.
| Quadrant | # 1 sec bins | Bins with >0 counts | Bins with >2000 counts | High rate bins dominated by noise | Noise dominated (total time) | Noise dominated (detector-on time) | Marked lightcurve |
|---|---|---|---|---|---|---|---|
| A | 7849 | 6735 | 3 | 3 | 0.04% | 0.04% | 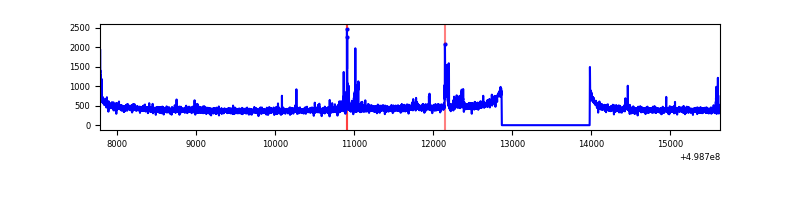 |
| B | 7848 | 6734 | 70 | 70 | 0.89% | 1.04% | 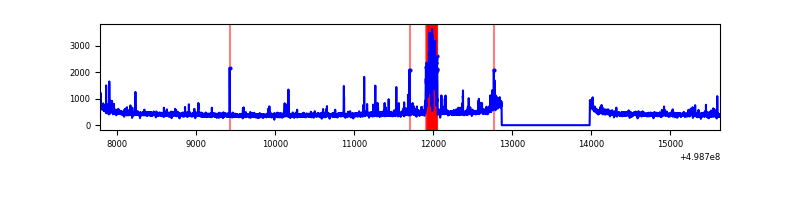 |
| C | 7848 | 6734 | 1331 | 1331 | 16.96% | 19.77% | 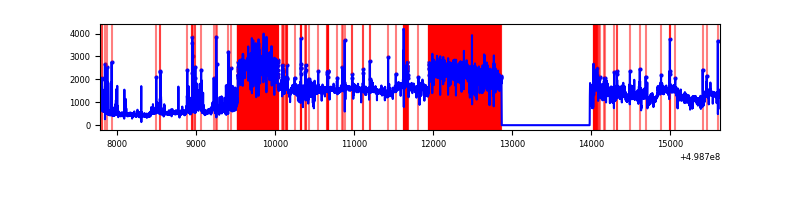 |
| D | 7848 | 6734 | 1106 | 1106 | 14.09% | 16.42% | 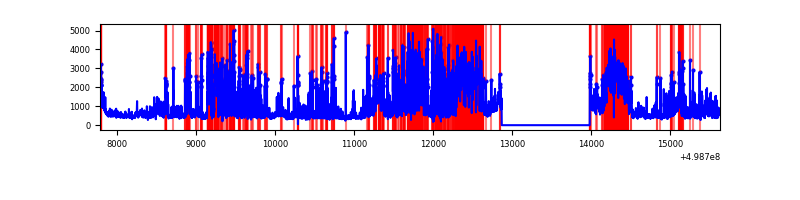 |
Top three noisy pixels from each quadrant. If the there are fewer than three noisy pixels in the level2.evt file, extra rows are filled as -1
| Pixel properties | Quadrant properties | ||||||
|---|---|---|---|---|---|---|---|
| Quadrant | DetID | PixID | Counts | Sigma | Mean | Median | Sigma |
| A | 5 | 243 | 60529 | 336.33 | 717 | 698 | 177.9 |
| A | 0 | 8 | 47445 | 262.78 | 717 | 698 | 177.9 |
| A | 4 | 3 | 26805 | 146.75 | 717 | 698 | 177.9 |
| B | 5 | 185 | 271945 | 1768.99 | 708 | 682 | 153.3 |
| B | 0 | 213 | 47432 | 304.87 | 708 | 682 | 153.3 |
| B | 10 | 247 | 42919 | 275.44 | 708 | 682 | 153.3 |
| C | 4 | 5 | 6673189 | 37823.88 | 639 | 634 | 176.4 |
| C | 13 | 3 | 187794 | 1060.93 | 639 | 634 | 176.4 |
| C | 12 | 2 | 127501 | 719.16 | 639 | 634 | 176.4 |
| D | 8 | 176 | 3274385 | 18606.23 | 615 | 587 | 176.0 |
| D | 7 | 70 | 850570 | 4830.78 | 615 | 587 | 176.0 |
| D | 2 | 172 | 161277 | 913.26 | 615 | 587 | 176.0 |
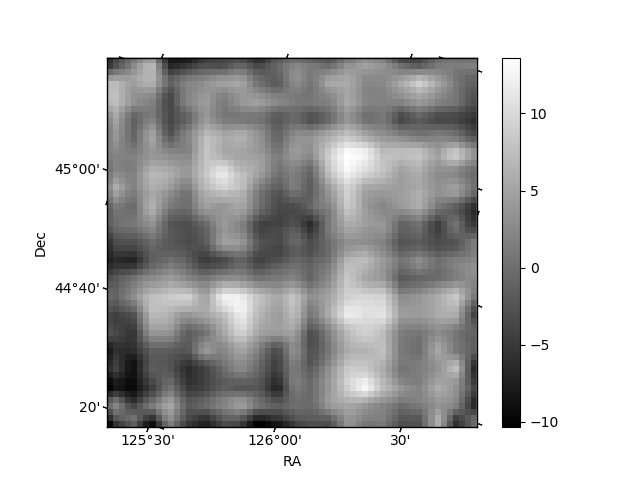
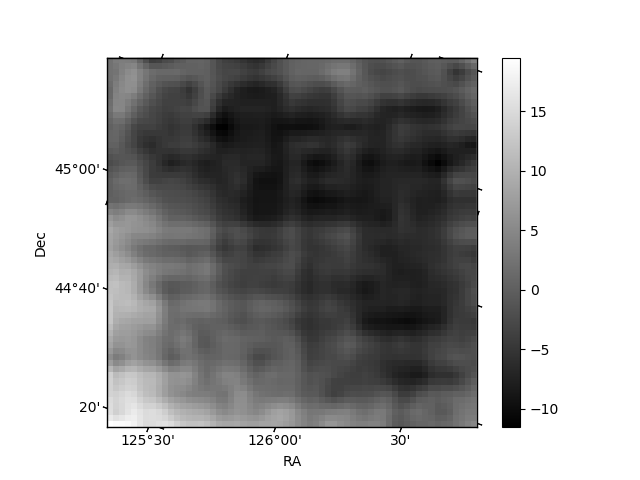
Histogram calculated using DETX and DETY for each event in the final _common_clean file
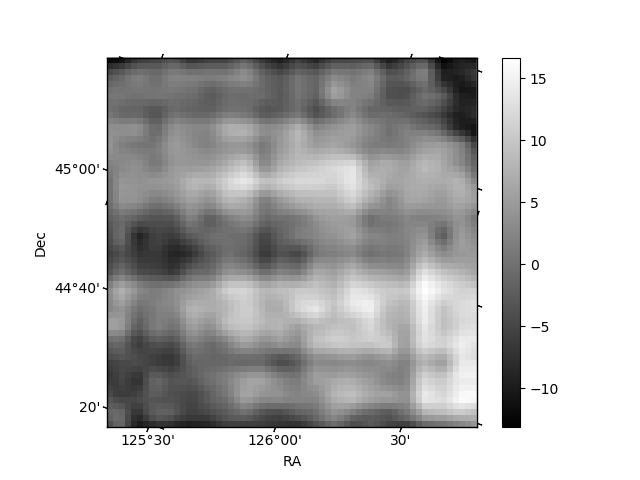
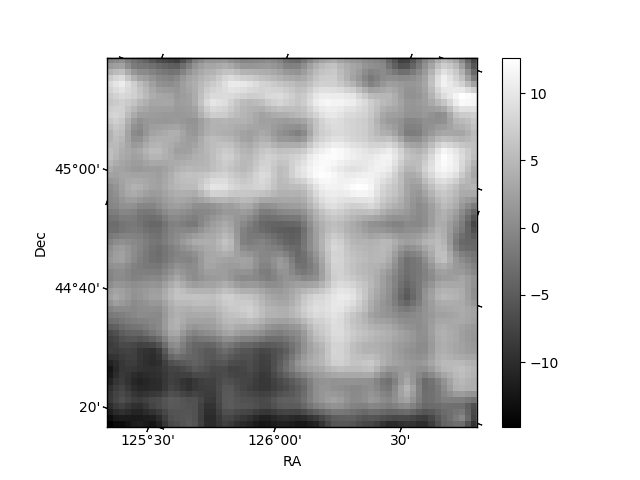
| Quadrant A | 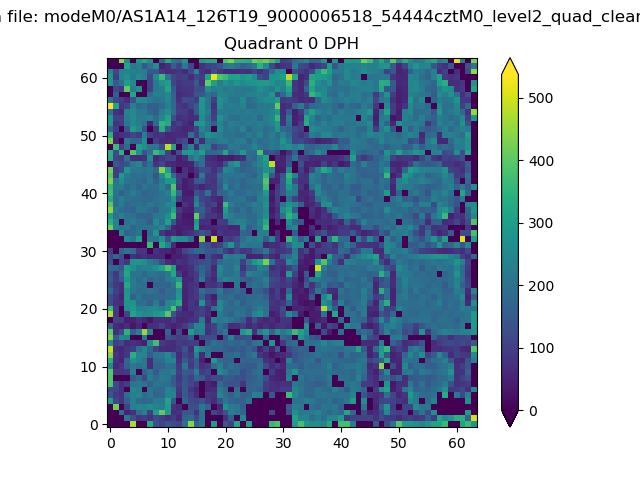 |
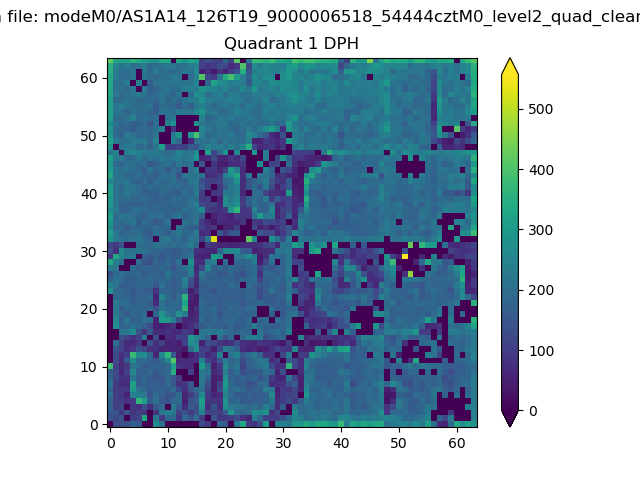 |
Quadrant B |
|---|---|---|---|
| Quadrant D | 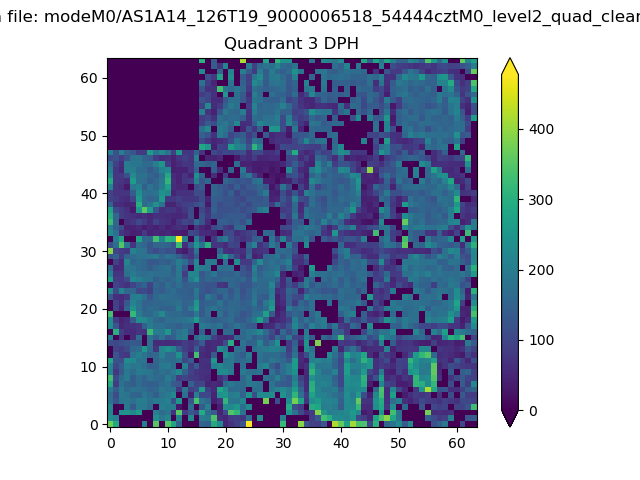 |
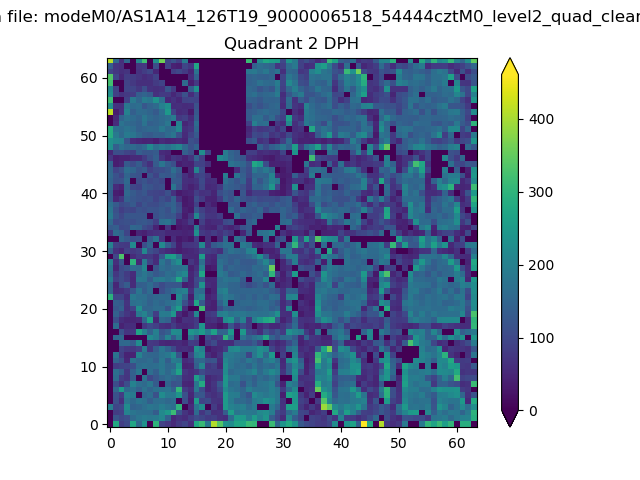 |
Quadrant C |
| Plot type | Count rate plots | Images |
|---|---|---|
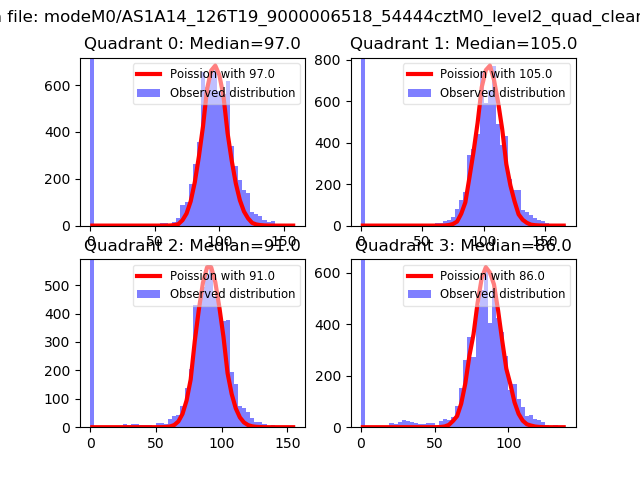
| Comparison with Poisson distribution Blue bars denote a histogram of data divided into 1 sec bins. Red curve is a Poisson curve with rate = median count rate of data. |
 |
 |
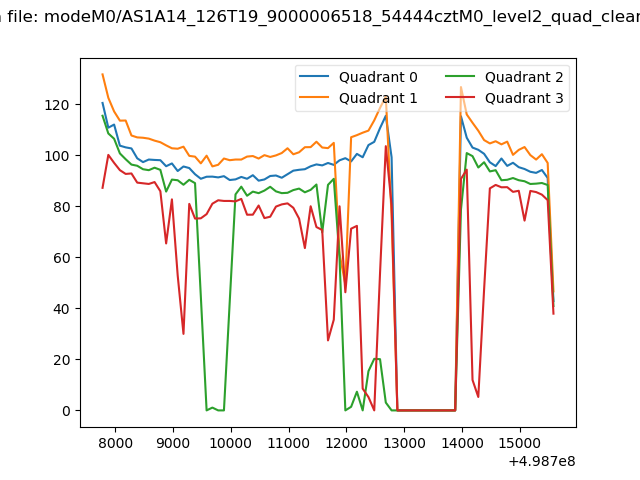
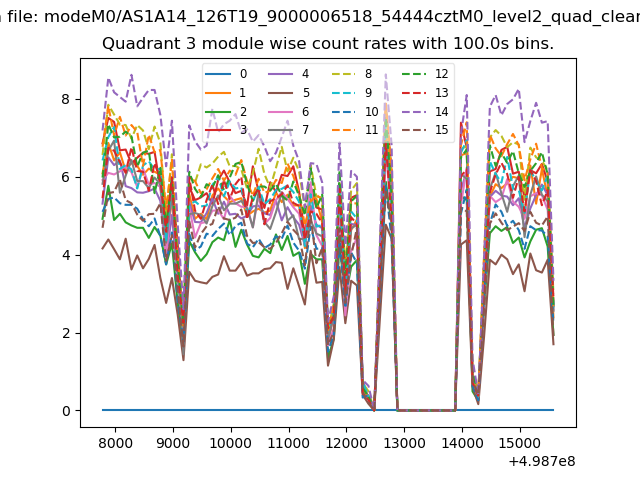
| Quadrant-wise count rates Data is divided into 100 sec bins |
 |
|
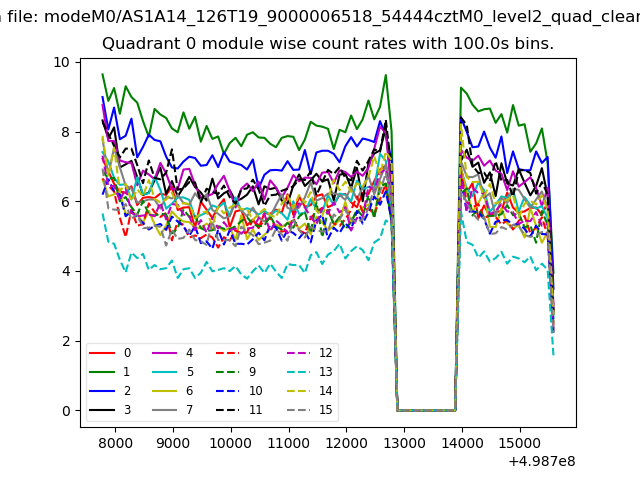
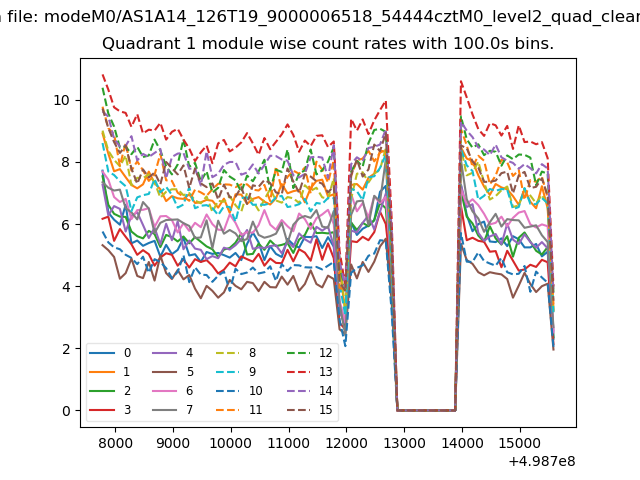
| Module-wise count rates for Quadrant A Data is divided into 100 sec bins |
 |
 |
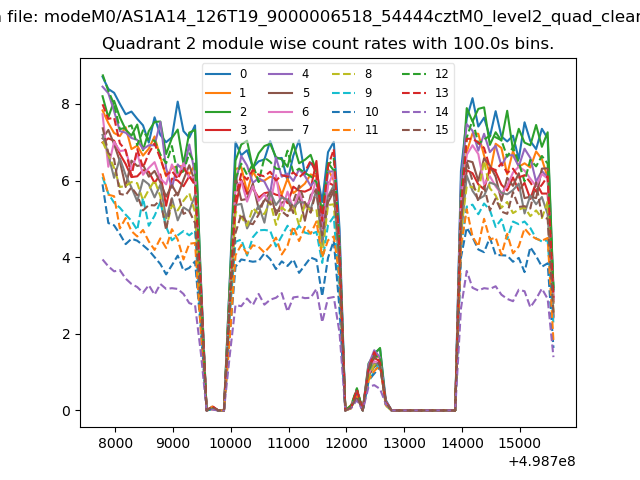
| Module-wise count rates for Quadrant B Data is divided into 100 sec bins |
 |
 |
| Module-wise count rates for Quadrant C Data is divided into 100 sec bins |
 |
 |
| Module-wise count rates for Quadrant D Data is divided into 100 sec bins |
 |
 |
| Parameter | Plot |
|---|---|
| CZT HV Monitor | 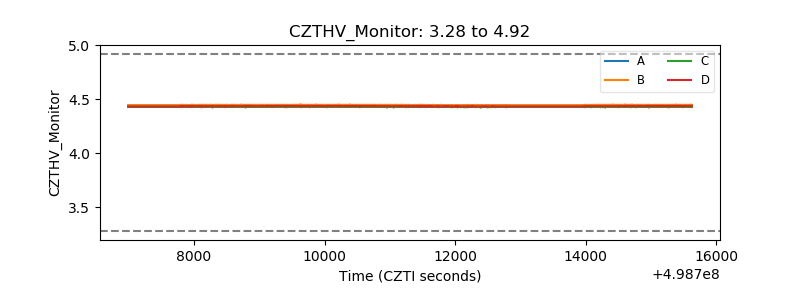 |
| D_VDD | 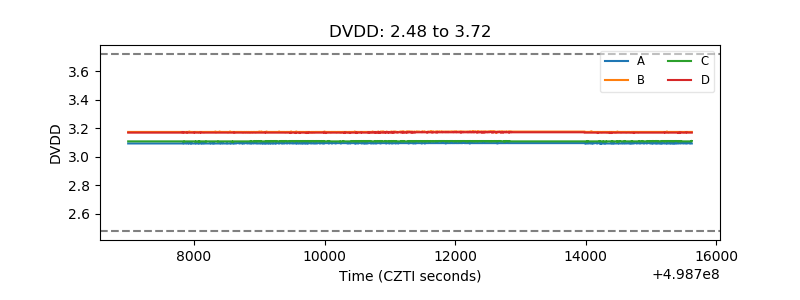 |
| Temperature 1 | 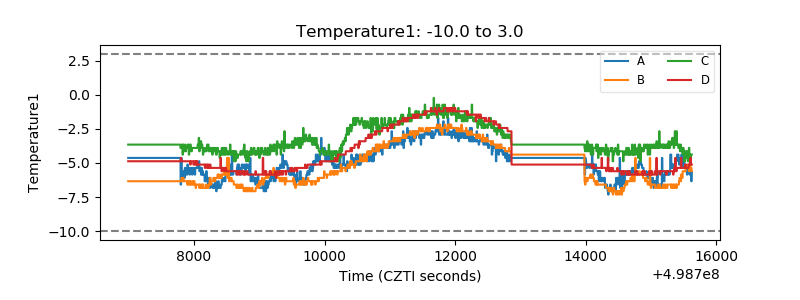 |
| Veto HV Monitor | 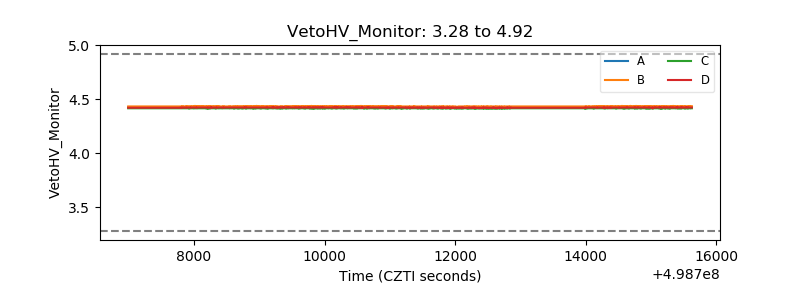 |
| Veto LLD | 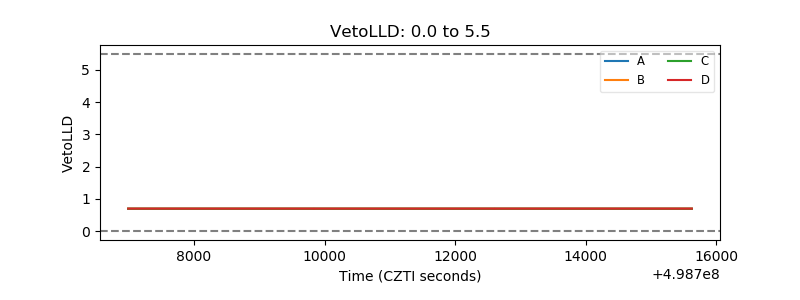 |
| Alpha Counter | 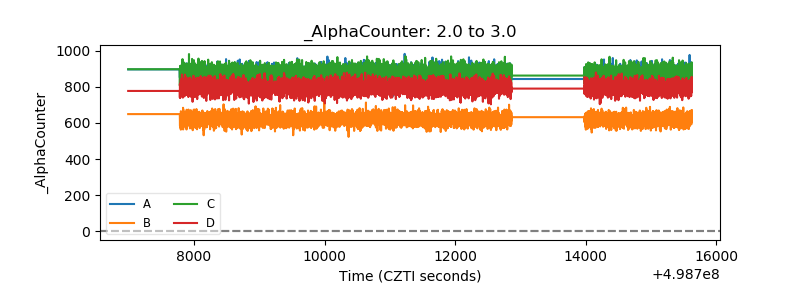 |
| _CPM_Rate | 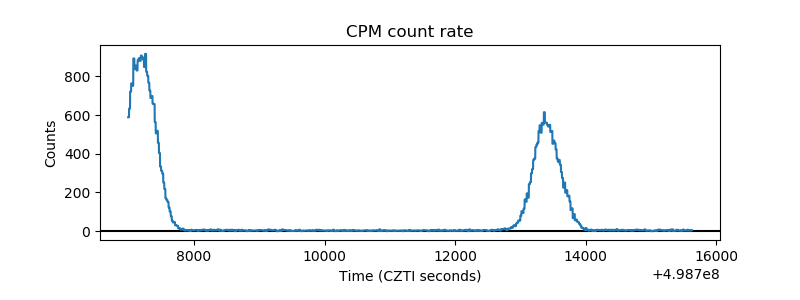 |
| CZT Counter | 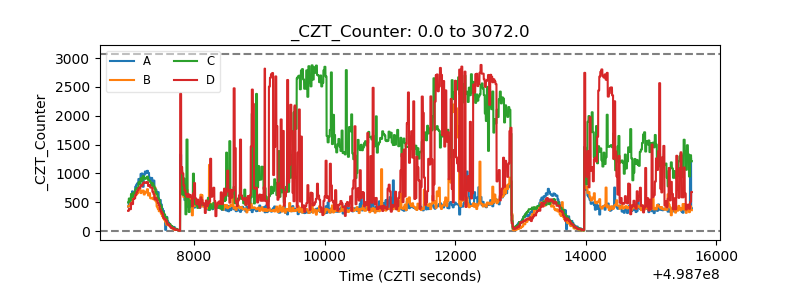 |
| +2.5 Volts monitor | 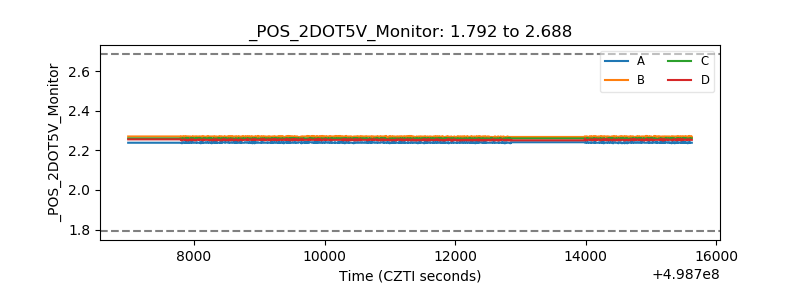 |
| +5 Volts monitor | 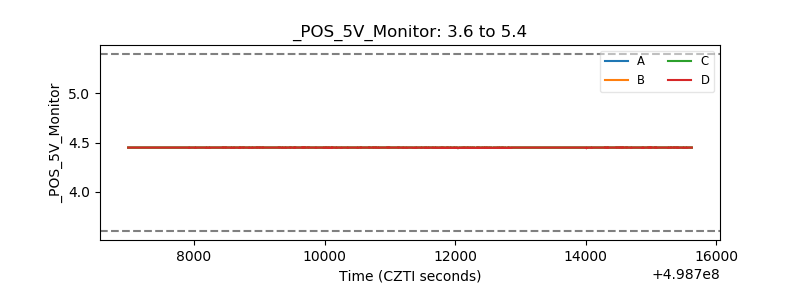 |
| _ROLL_ROT | 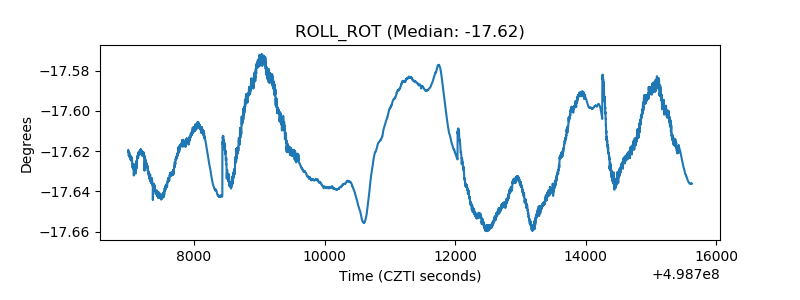 |
| _Roll_DEC | 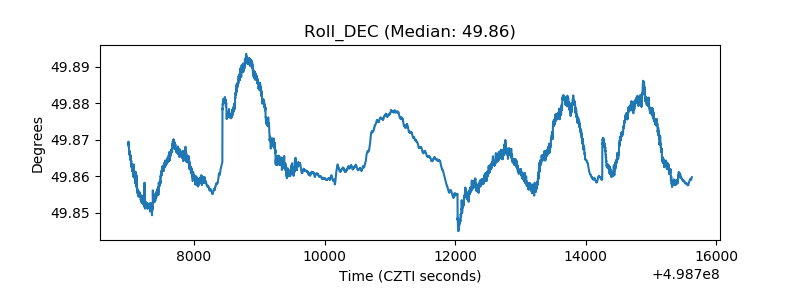 |
| _Roll_RA | 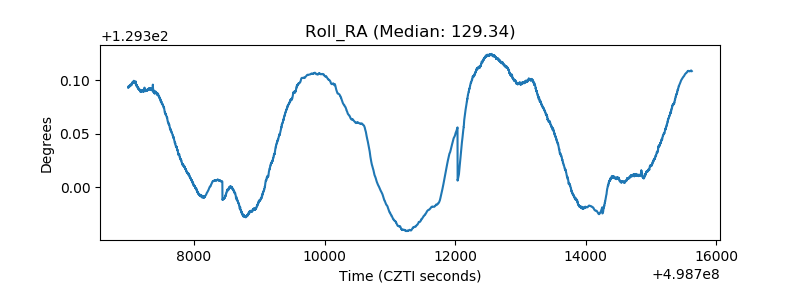 |
| Veto Counter | 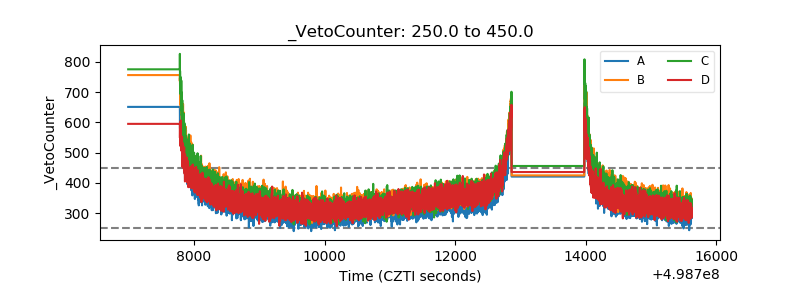 |