| Param | Original file | Final file |
|---|---|---|
| Filename | modeM0/AS1A14_126T19_9000006518_54445cztM0_level2.fits | modeM0/AS1A14_126T19_9000006518_54445cztM0_level2_quad_clean.evt |
| Size (bytes) | 535,345,920 | 84,461,760 |
| Size | 510.5 MB | 80.5 MB |
| Events in quadrant A | 2,562,698 | 583,599 |
| Events in quadrant B | 2,827,104 | 625,484 |
| Events in quadrant C | 5,562,102 | 556,929 |
| Events in quadrant D | 8,388,071 | 362,641 |
| Mode SS | |||
|---|---|---|---|
| Quadrant | BADHDUFLAG | Total packets | Discarded packets |
| A | 0 | 126 | 0 |
| B | 0 | 126 | 0 |
| C | 0 | 126 | 0 |
| D | 0 | 126 | 0 |
| Mode M0 | |||
|---|---|---|---|
| Quadrant | BADHDUFLAG | Total packets | Discarded packets |
| A | 0 | 12578 | 1 |
| B | 0 | 13248 | 1 |
| C | 0 | 21016 | 1 |
| D | 0 | 29199 | 1 |
| Mode M9 | |||
|---|---|---|---|
| Quadrant | BADHDUFLAG | Total packets | Discarded packets |
| A | 0 | 11 | 0 |
| B | 0 | 11 | 0 |
| C | 0 | 11 | 0 |
| D | 0 | 11 | 0 |
| Quadrant | Total seconds | Saturated seconds | Saturation percentage |
|---|---|---|---|
| A | 6142 | 38 | 0.618691% |
| B | 6142 | 70 | 1.139694% |
| C | 6142 | 97 | 1.579290% |
| D | 6142 | 1916 | 31.195050% |
Noise dominated data is calculated using 1-second bins in cleaned event files. If a bin has >2000 counts, and if more than 50% of those come from <1% of pixels, then it is considered to be noise-dominated and hence unusable.
| Quadrant | # 1 sec bins | Bins with >0 counts | Bins with >2000 counts | High rate bins dominated by noise | Noise dominated (total time) | Noise dominated (detector-on time) | Marked lightcurve |
|---|---|---|---|---|---|---|---|
| A | 7167 | 6144 | 1 | 1 | 0.01% | 0.02% | 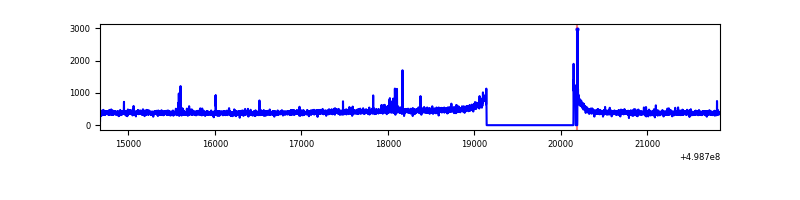 |
| B | 7167 | 6144 | 11 | 11 | 0.15% | 0.18% | 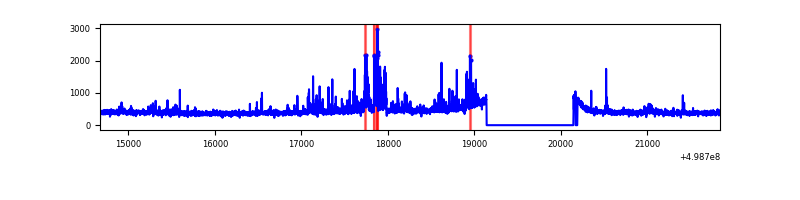 |
| C | 7167 | 6144 | 61 | 61 | 0.85% | 0.99% | 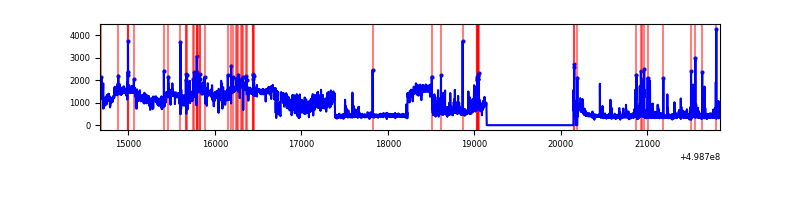 |
| D | 7167 | 6143 | 1669 | 1669 | 23.29% | 27.17% | 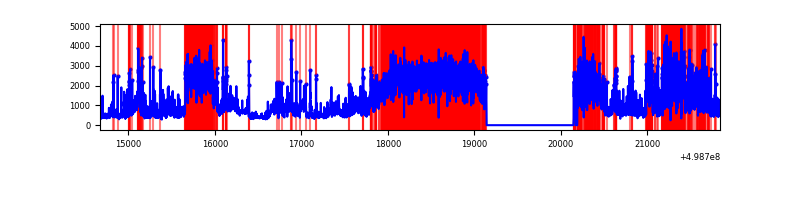 |
Top three noisy pixels from each quadrant. If the there are fewer than three noisy pixels in the level2.evt file, extra rows are filled as -1
| Pixel properties | Quadrant properties | ||||||
|---|---|---|---|---|---|---|---|
| Quadrant | DetID | PixID | Counts | Sigma | Mean | Median | Sigma |
| A | 0 | 8 | 21361 | 130.16 | 644 | 628 | 159.3 |
| A | 4 | 3 | 19960 | 121.36 | 644 | 628 | 159.3 |
| A | 13 | 254 | 13759 | 82.43 | 644 | 628 | 159.3 |
| B | 5 | 185 | 186870 | 1365.25 | 635 | 612 | 136.4 |
| B | 0 | 213 | 37352 | 269.3 | 635 | 612 | 136.4 |
| B | 10 | 247 | 32146 | 231.14 | 635 | 612 | 136.4 |
| C | 4 | 5 | 2818713 | 16651.87 | 615 | 610 | 169.2 |
| C | 13 | 3 | 130612 | 768.17 | 615 | 610 | 169.2 |
| C | 14 | 254 | 87711 | 514.67 | 615 | 610 | 169.2 |
| D | 7 | 70 | 3733224 | 24890.41 | 522 | 499 | 150.0 |
| D | 6 | 239 | 873166 | 5819.08 | 522 | 499 | 150.0 |
| D | 8 | 176 | 493704 | 3288.77 | 522 | 499 | 150.0 |
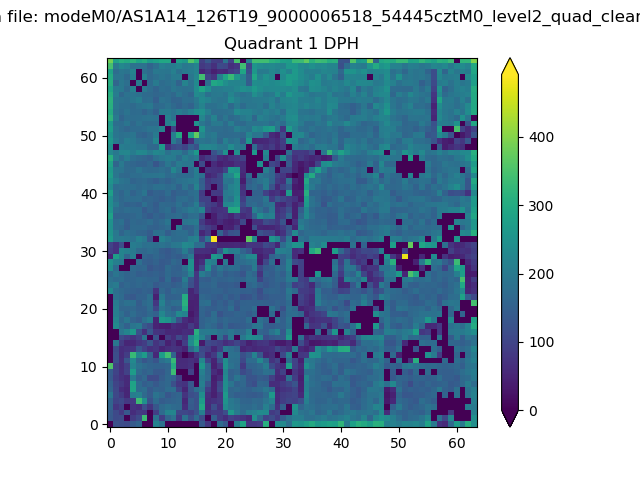
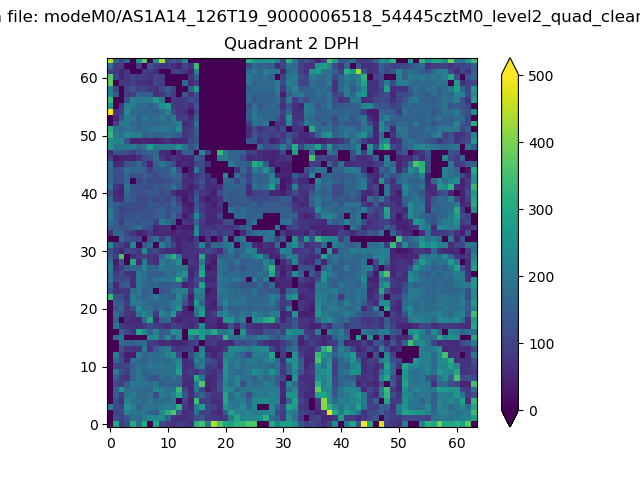
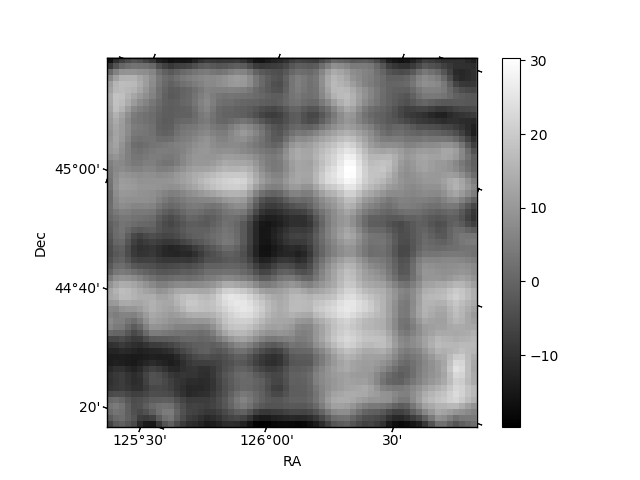
Histogram calculated using DETX and DETY for each event in the final _common_clean file
| Quadrant A |  |
 |
Quadrant B |
|---|---|---|---|
| Quadrant D | 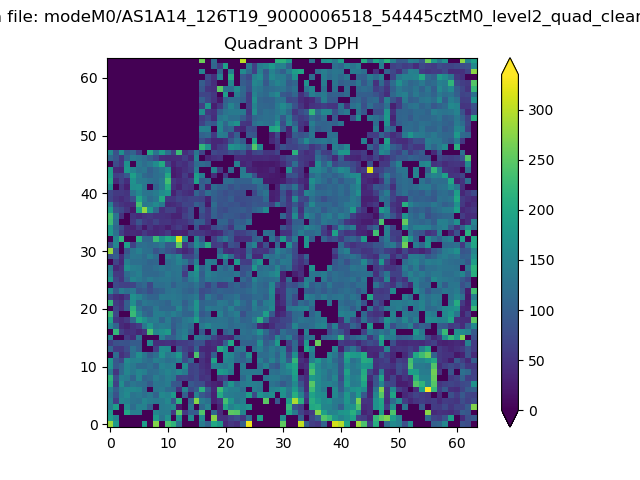 |
 |
Quadrant C |
| Plot type | Count rate plots | Images |
|---|---|---|
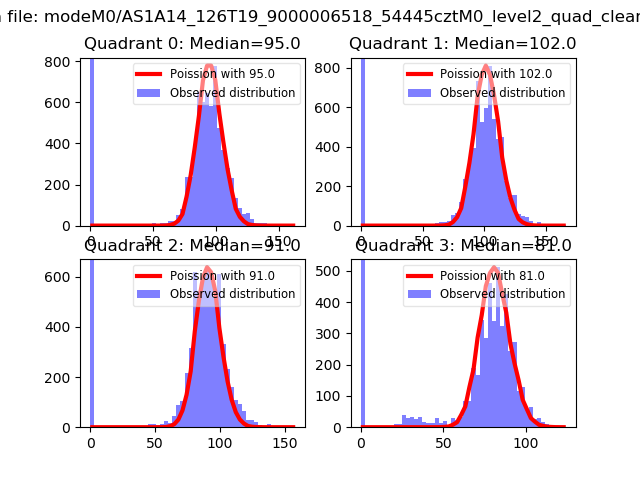
| Comparison with Poisson distribution Blue bars denote a histogram of data divided into 1 sec bins. Red curve is a Poisson curve with rate = median count rate of data. |
 |
 |
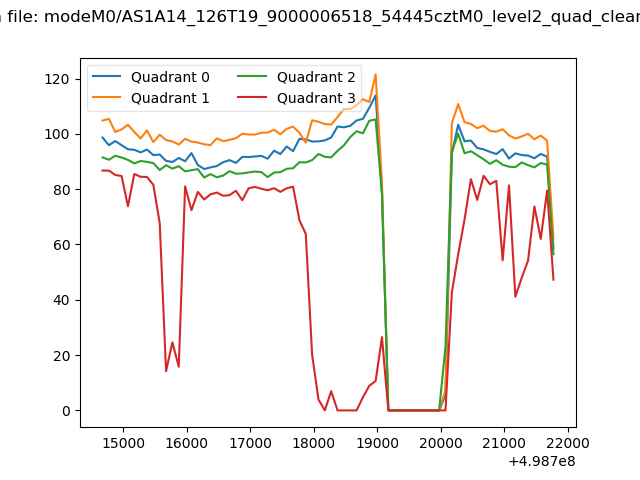
| Quadrant-wise count rates Data is divided into 100 sec bins |
 |
|
| Module-wise count rates for Quadrant A Data is divided into 100 sec bins |
 |
 |
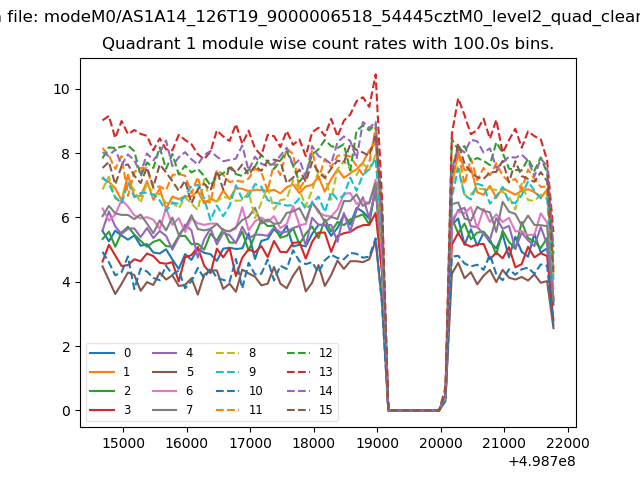
| Module-wise count rates for Quadrant B Data is divided into 100 sec bins |
 |
 |
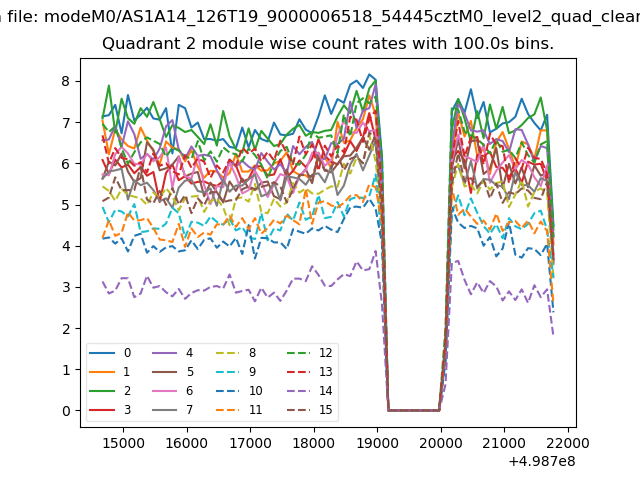
| Module-wise count rates for Quadrant C Data is divided into 100 sec bins |
 |
 |
| Module-wise count rates for Quadrant D Data is divided into 100 sec bins |
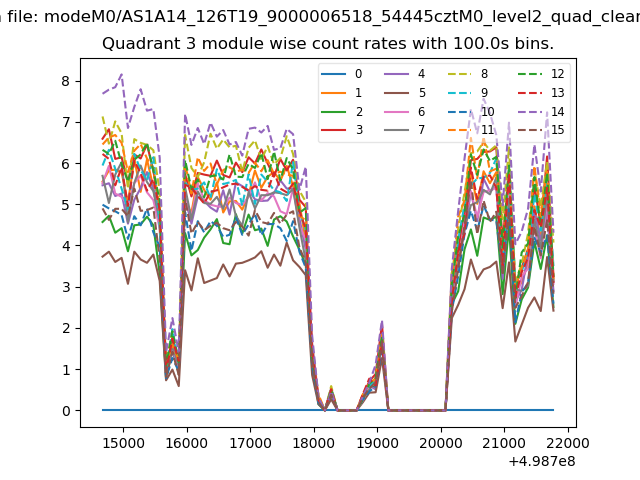 |
 |
| Parameter | Plot |
|---|---|
| CZT HV Monitor | 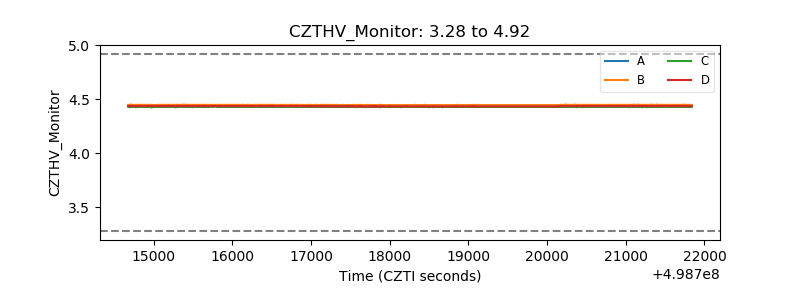 |
| D_VDD | 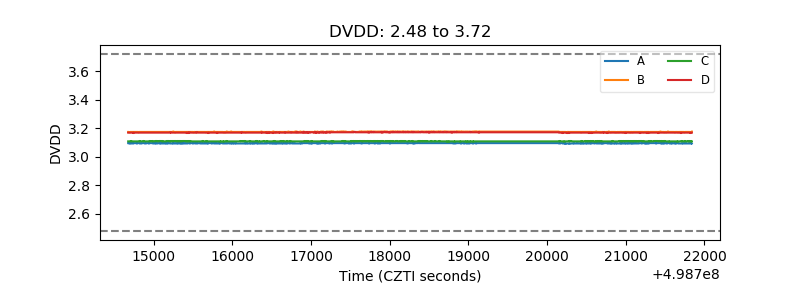 |
| Temperature 1 | 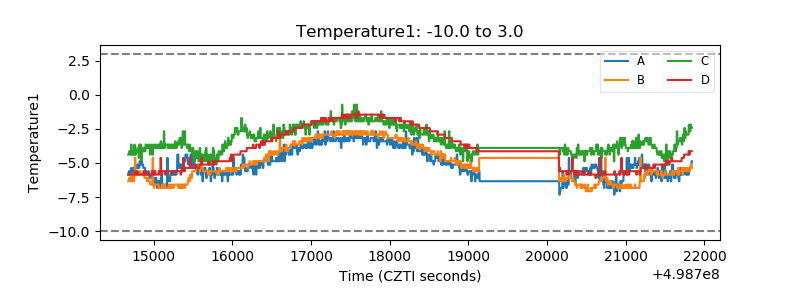 |
| Veto HV Monitor | 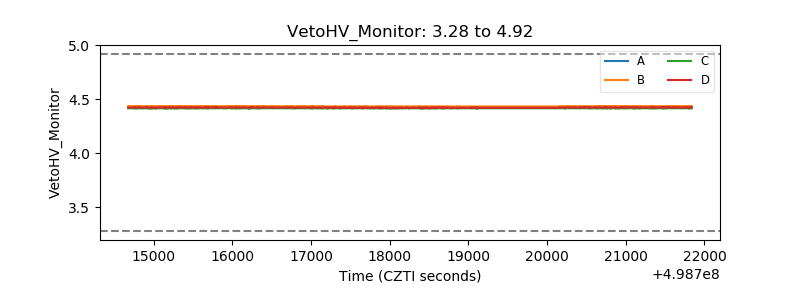 |
| Veto LLD | 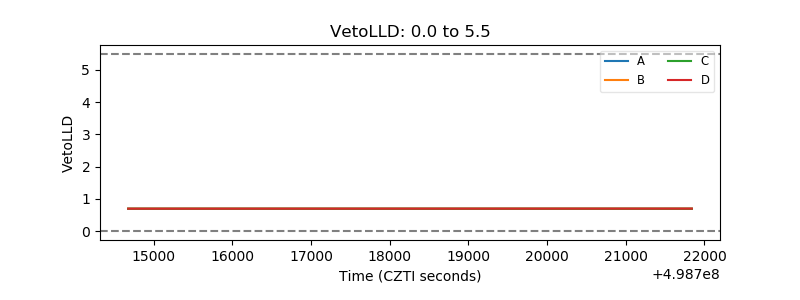 |
| Alpha Counter | 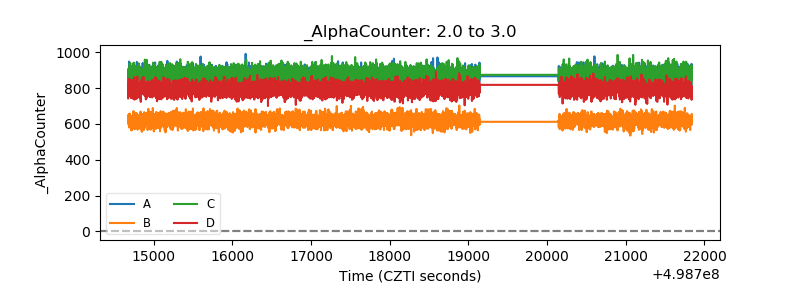 |
| _CPM_Rate | 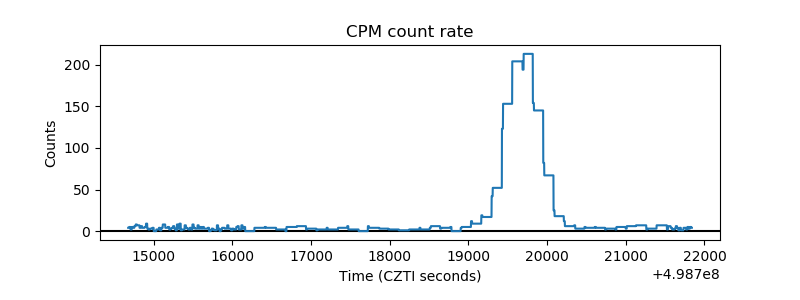 |
| CZT Counter | 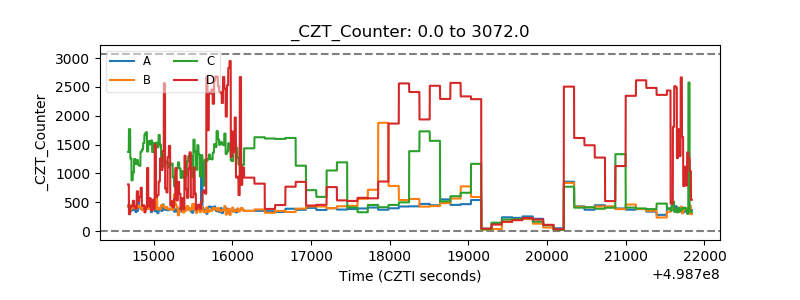 |
| +2.5 Volts monitor | 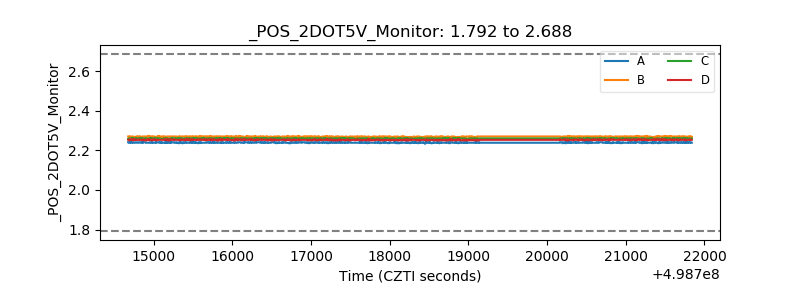 |
| +5 Volts monitor | 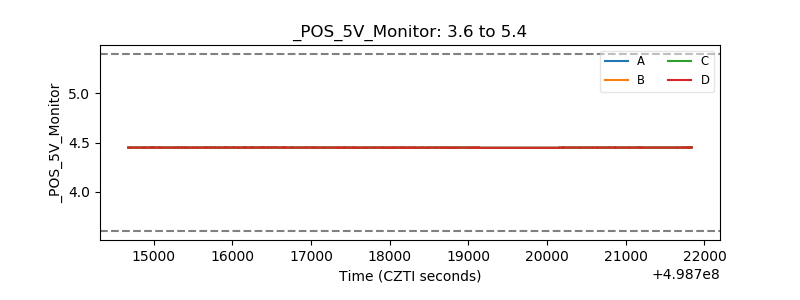 |
| _ROLL_ROT | 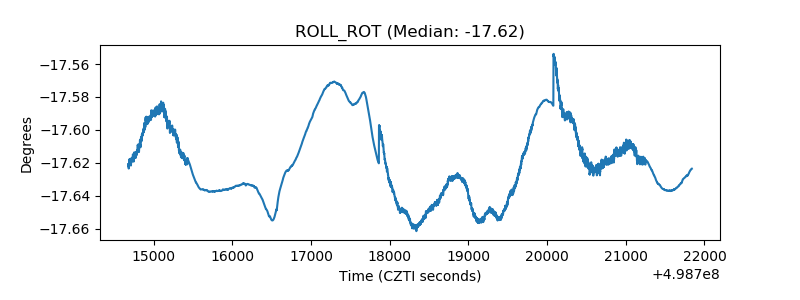 |
| _Roll_DEC | 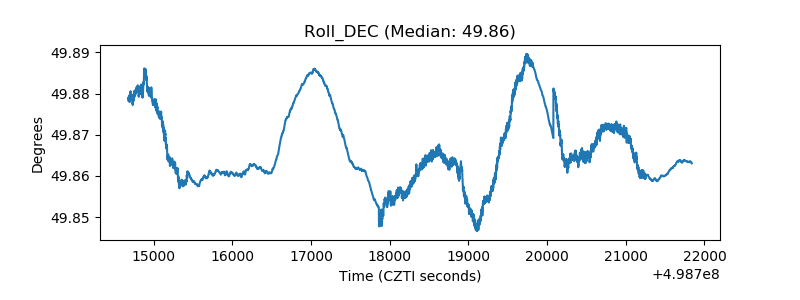 |
| _Roll_RA | 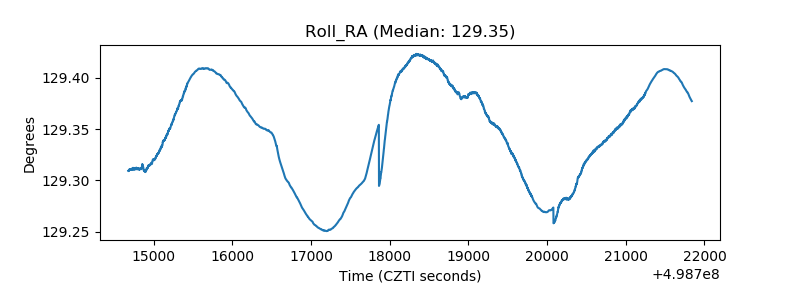 |
| Veto Counter | 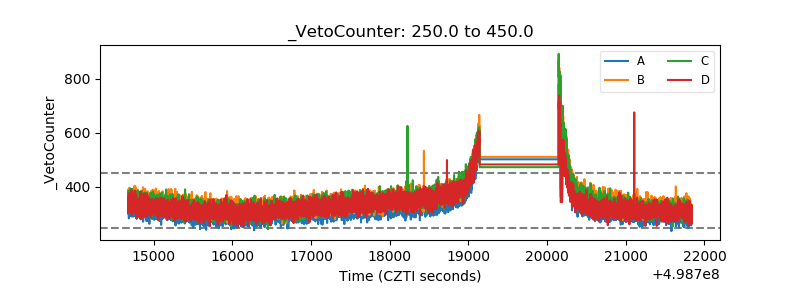 |