| Param | Original file | Final file |
|---|---|---|
| Filename | modeM0/AS1A14_126T19_9000006518_54446cztM0_level2.fits | modeM0/AS1A14_126T19_9000006518_54446cztM0_level2_quad_clean.evt |
| Size (bytes) | 582,802,560 | 82,892,160 |
| Size | 555.8 MB | 79.1 MB |
| Events in quadrant A | 2,858,144 | 591,255 |
| Events in quadrant B | 3,580,886 | 622,621 |
| Events in quadrant C | 3,257,101 | 570,763 |
| Events in quadrant D | 11,377,539 | 277,181 |
| Mode SS | |||
|---|---|---|---|
| Quadrant | BADHDUFLAG | Total packets | Discarded packets |
| A | 0 | 130 | 0 |
| B | 0 | 130 | 0 |
| C | 0 | 130 | 0 |
| D | 0 | 130 | 0 |
| Mode M0 | |||
|---|---|---|---|
| Quadrant | BADHDUFLAG | Total packets | Discarded packets |
| A | 0 | 13592 | 1 |
| B | 0 | 15610 | 1 |
| C | 0 | 14673 | 1 |
| D | 0 | 38192 | 1 |
| Mode M9 | |||
|---|---|---|---|
| Quadrant | BADHDUFLAG | Total packets | Discarded packets |
| A | 0 | 7 | 0 |
| B | 0 | 7 | 0 |
| C | 0 | 7 | 0 |
| D | 0 | 7 | 0 |
| Quadrant | Total seconds | Saturated seconds | Saturation percentage |
|---|---|---|---|
| A | 6421 | 162 | 2.522971% |
| B | 6421 | 314 | 4.890204% |
| C | 6421 | 128 | 1.993459% |
| D | 6422 | 3358 | 52.289007% |
Noise dominated data is calculated using 1-second bins in cleaned event files. If a bin has >2000 counts, and if more than 50% of those come from <1% of pixels, then it is considered to be noise-dominated and hence unusable.
| Quadrant | # 1 sec bins | Bins with >0 counts | Bins with >2000 counts | High rate bins dominated by noise | Noise dominated (total time) | Noise dominated (detector-on time) | Marked lightcurve |
|---|---|---|---|---|---|---|---|
| A | 7101 | 6422 | 21 | 21 | 0.30% | 0.33% | 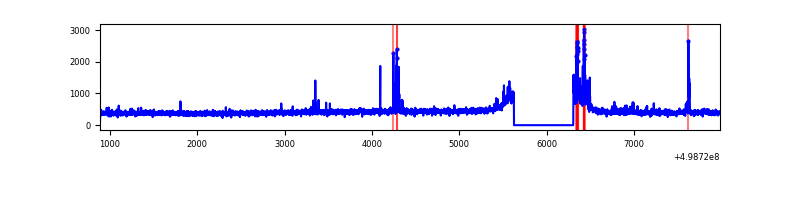 |
| B | 7101 | 6422 | 136 | 136 | 1.92% | 2.12% | 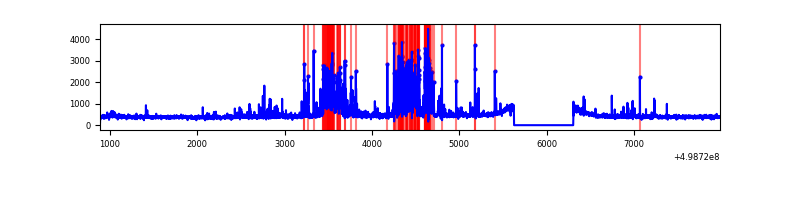 |
| C | 7101 | 6422 | 72 | 72 | 1.01% | 1.12% | 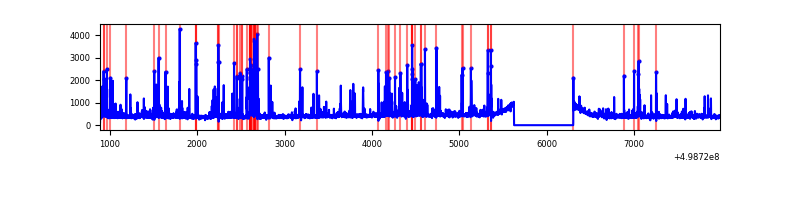 |
| D | 7102 | 6423 | 2930 | 2930 | 41.26% | 45.62% | 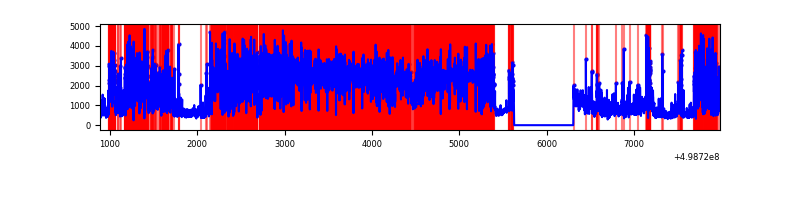 |
Top three noisy pixels from each quadrant. If the there are fewer than three noisy pixels in the level2.evt file, extra rows are filled as -1
| Pixel properties | Quadrant properties | ||||||
|---|---|---|---|---|---|---|---|
| Quadrant | DetID | PixID | Counts | Sigma | Mean | Median | Sigma |
| A | 0 | 8 | 159776 | 942.54 | 681 | 663 | 168.8 |
| A | 4 | 3 | 25108 | 144.81 | 681 | 663 | 168.8 |
| A | 13 | 254 | 14001 | 79.01 | 681 | 663 | 168.8 |
| B | 2 | 249 | 447982 | 3134.32 | 664 | 641 | 142.7 |
| B | 5 | 185 | 292826 | 2047.21 | 664 | 641 | 142.7 |
| B | 0 | 213 | 88140 | 613.07 | 664 | 641 | 142.7 |
| C | 13 | 3 | 435741 | 2403.69 | 656 | 647 | 181.0 |
| C | 14 | 254 | 113240 | 622.02 | 656 | 647 | 181.0 |
| C | 9 | 237 | 53385 | 291.35 | 656 | 647 | 181.0 |
| D | 7 | 70 | 3615915 | 26676.19 | 479 | 457 | 135.5 |
| D | 2 | 172 | 2536599 | 18712.59 | 479 | 457 | 135.5 |
| D | 8 | 176 | 1863023 | 13742.7 | 479 | 457 | 135.5 |
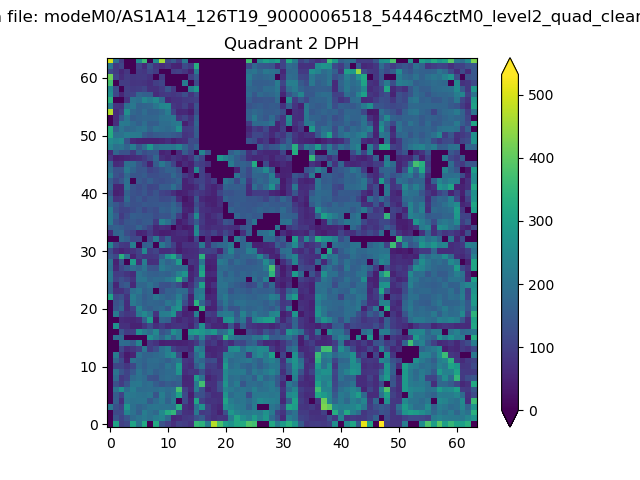
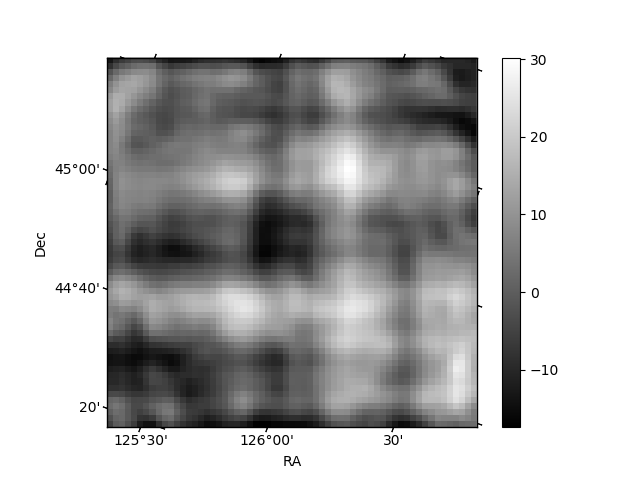
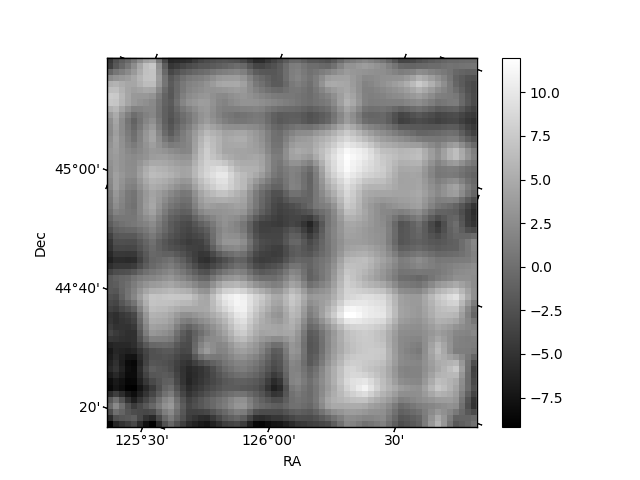
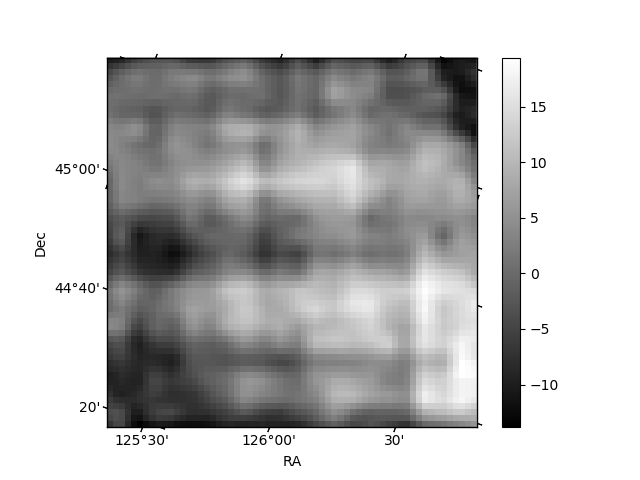
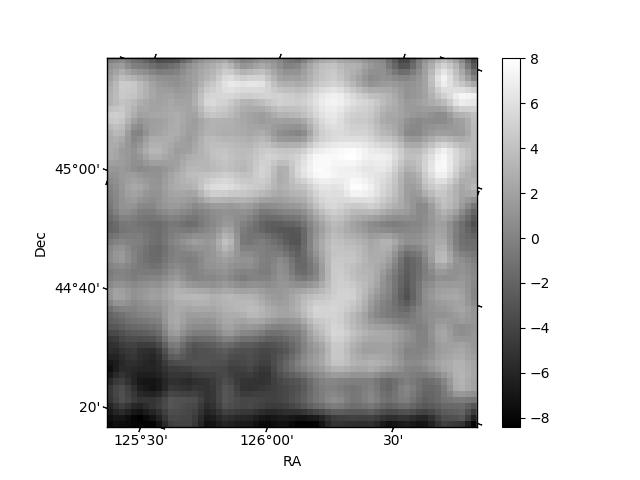
Histogram calculated using DETX and DETY for each event in the final _common_clean file
| Quadrant A | 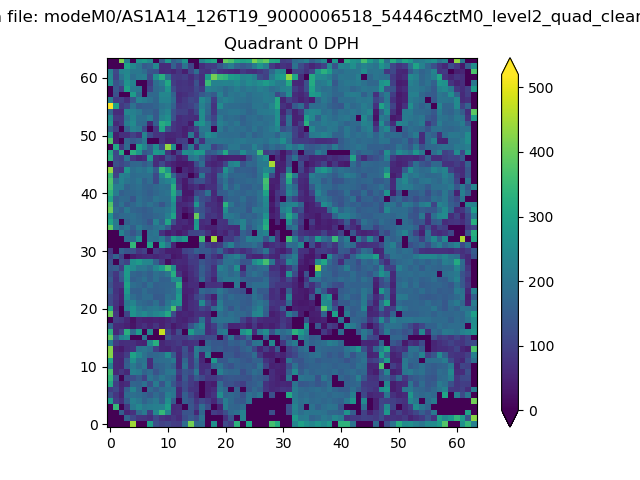 |
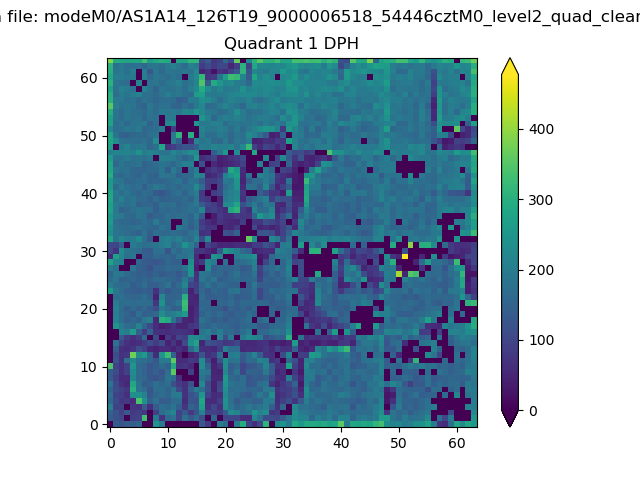 |
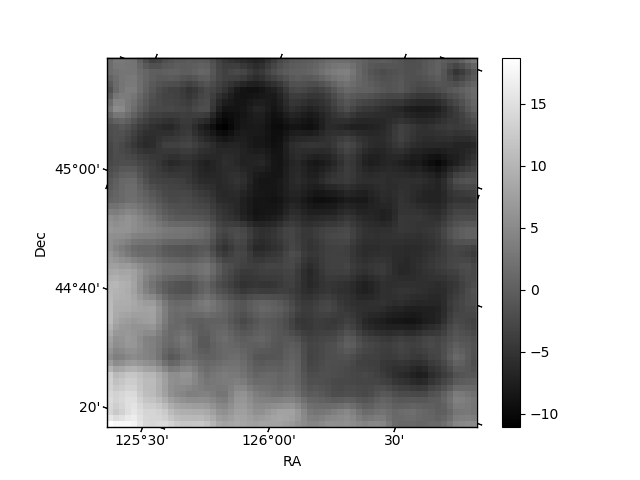
Quadrant B |
|---|---|---|---|
| Quadrant D | 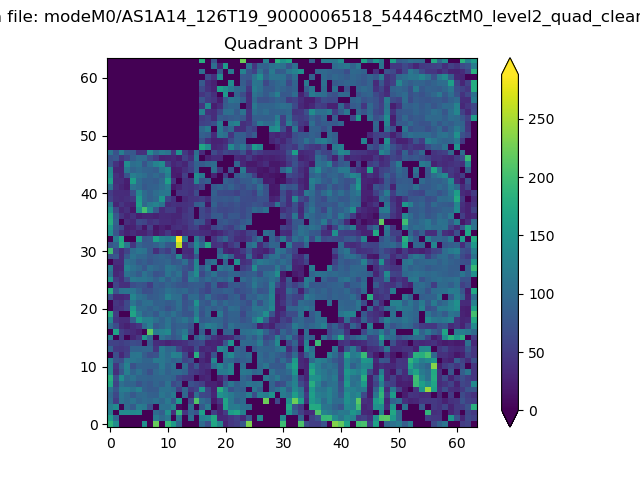 |
 |
Quadrant C |
| Plot type | Count rate plots | Images |
|---|---|---|
| Comparison with Poisson distribution Blue bars denote a histogram of data divided into 1 sec bins. Red curve is a Poisson curve with rate = median count rate of data. |
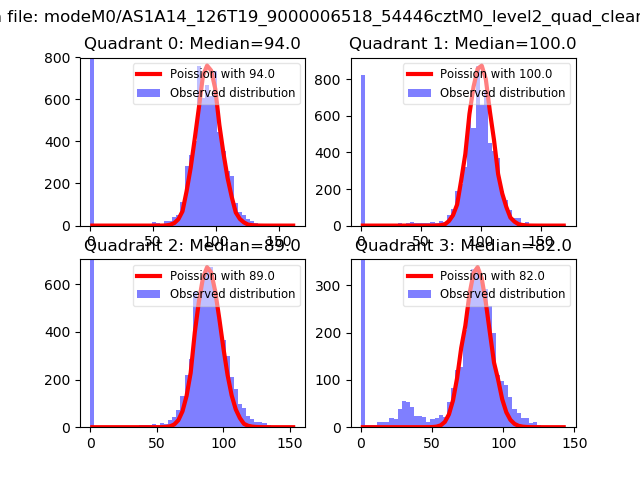 |
 |
| Quadrant-wise count rates Data is divided into 100 sec bins |
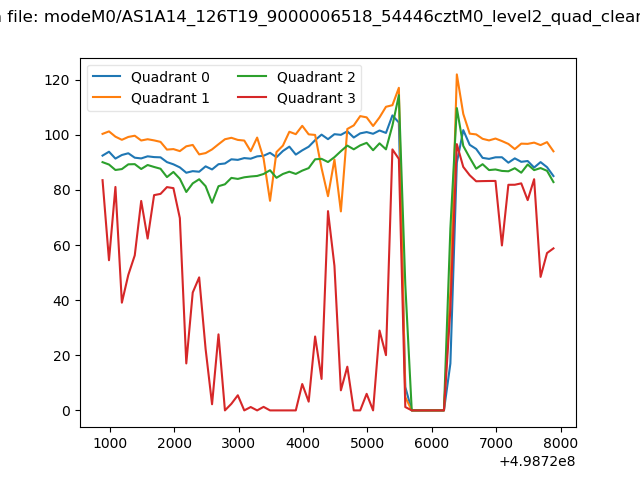 |
|
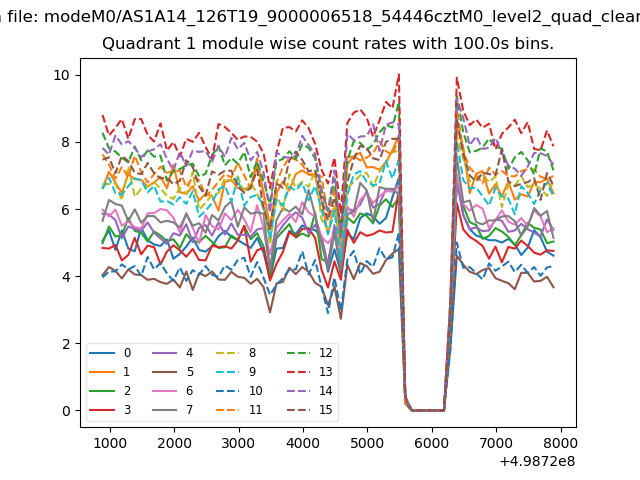
| Module-wise count rates for Quadrant A Data is divided into 100 sec bins |
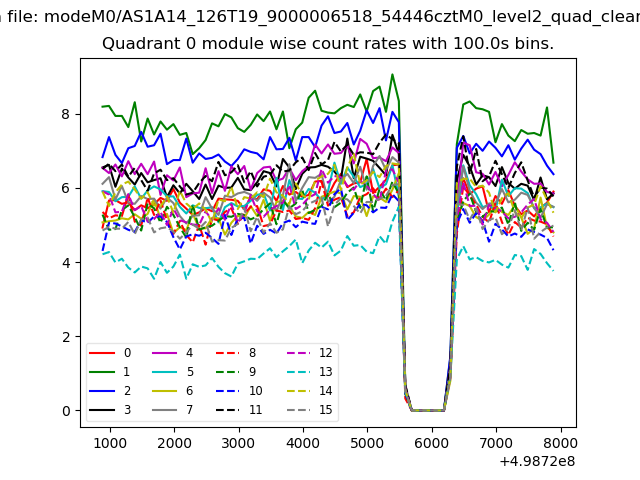 |
 |
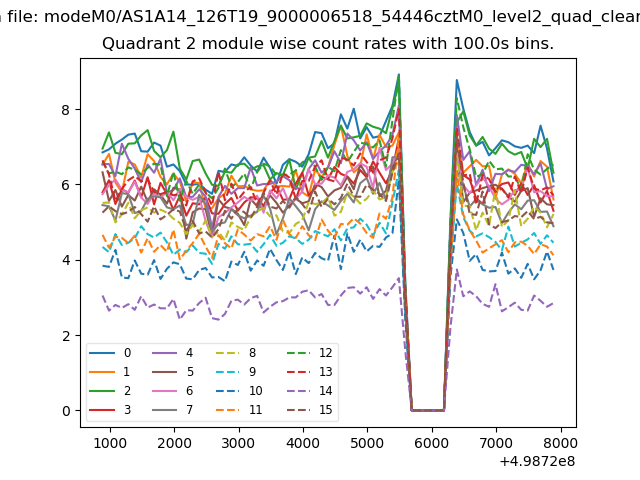
| Module-wise count rates for Quadrant B Data is divided into 100 sec bins |
 |
 |
| Module-wise count rates for Quadrant C Data is divided into 100 sec bins |
 |
 |
| Module-wise count rates for Quadrant D Data is divided into 100 sec bins |
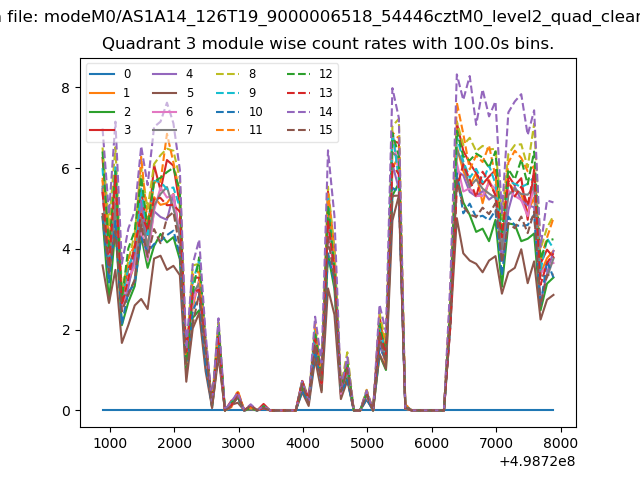 |
 |
| Parameter | Plot |
|---|---|
| CZT HV Monitor | 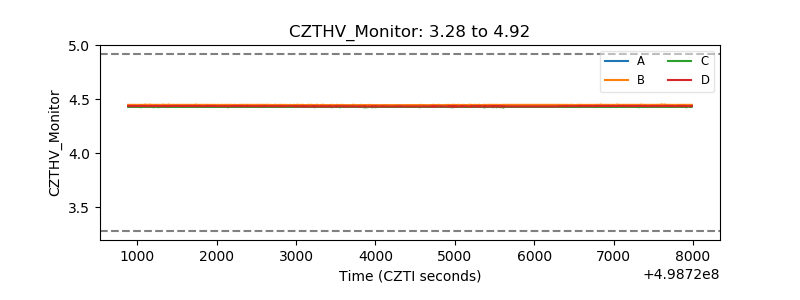 |
| D_VDD | 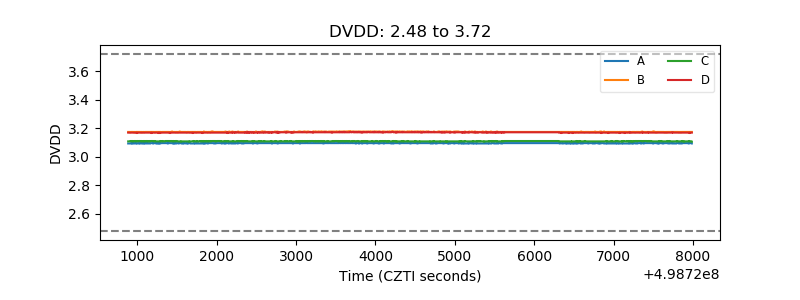 |
| Temperature 1 | 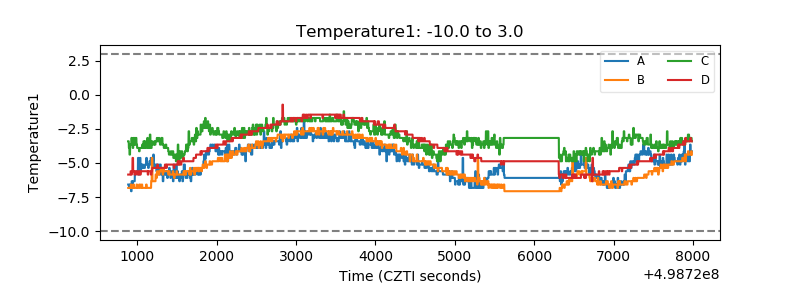 |
| Veto HV Monitor | 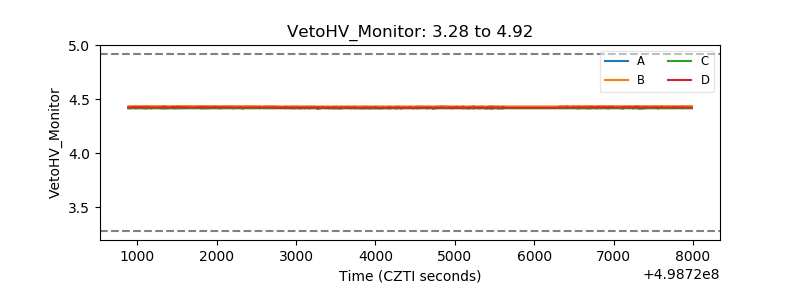 |
| Veto LLD | 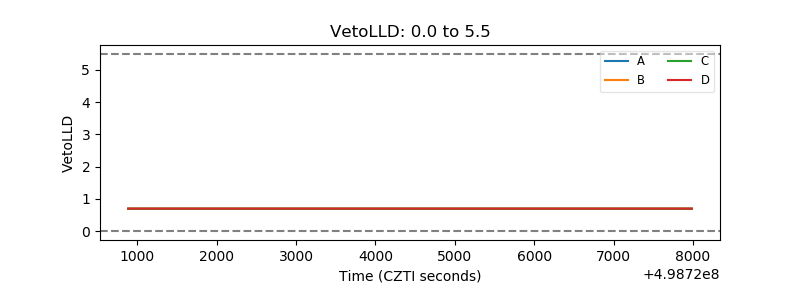 |
| Alpha Counter | 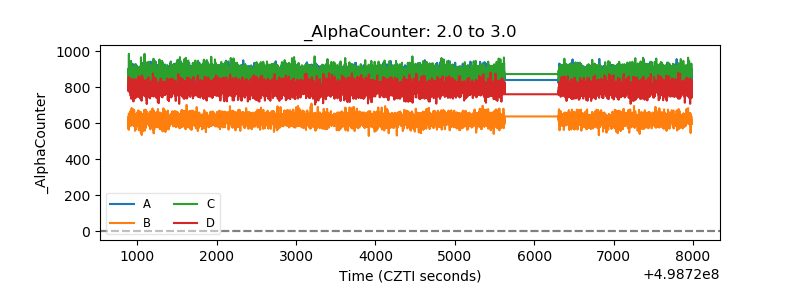 |
| _CPM_Rate | 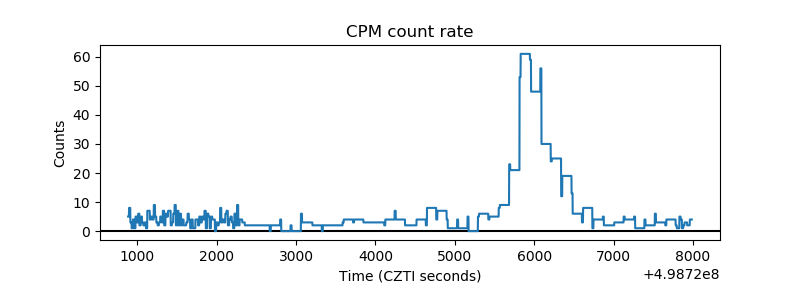 |
| CZT Counter | 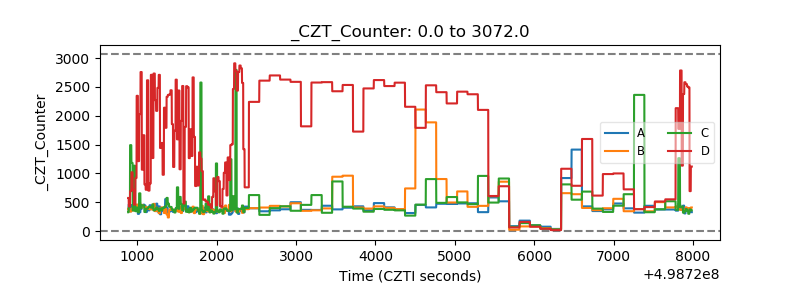 |
| +2.5 Volts monitor | 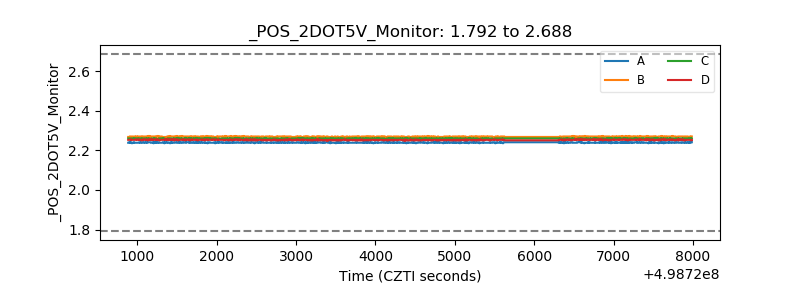 |
| +5 Volts monitor | 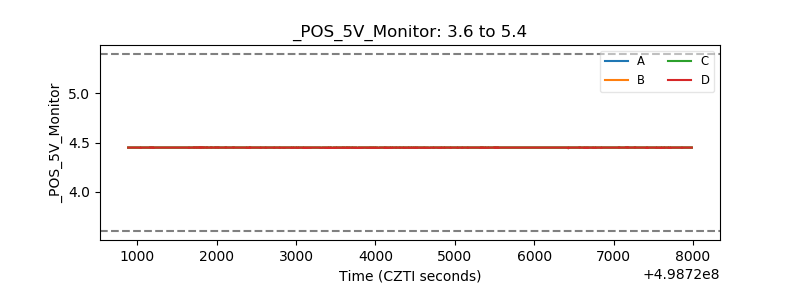 |
| _ROLL_ROT | 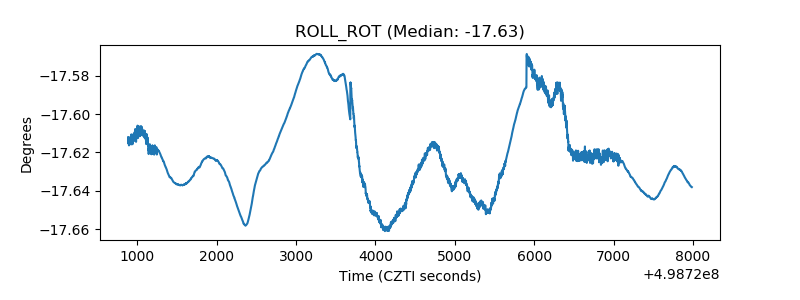 |
| _Roll_DEC | 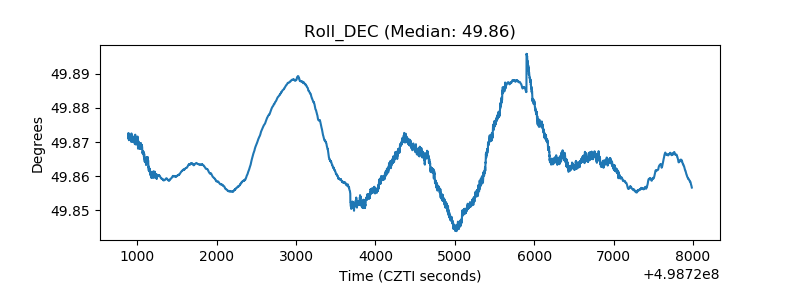 |
| _Roll_RA | 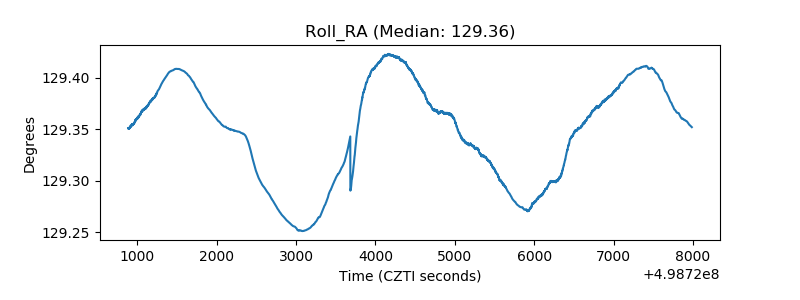 |
| Veto Counter | 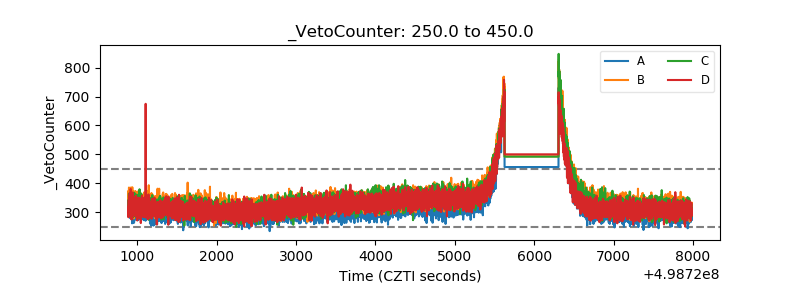 |